
A New Dynamic Community-Based Recommender System
Sabrine Ben Abdrabbah
1
, Nahla Ben Amor
2
and Raouia Ayachi
3
1
P
ˆ
ole R&D, Audensiel, 93 rue Nationale, 92700 Boulogne-Billancourt, France
2
LARODEC, Institut Sup
´
erieur de Gestion de Tunis, Universit
´
e de Tunis, 41 Avenue de la Libert
´
e, Tunis 2000, Tunisia
3
LARODEC,
´
Ecole Sup
´
erieure des Sciences
´
Economiques et Commerciales de Tunis, Universit
´
e de Tunis,
41 Avenue de la Libert
´
e, Tunis 2000, Tunisia
Keywords:
Recommendation Systems, Collaborative Filtering, Dynamic Community Detection, Overlapping
Communities, Dynamic Networks.
Abstract:
Due to the rapid changes in users’ preferences over time, it becomes increasingly important to focus on the
temporal evolution of the users’ behavioral patterns to capture the most relevant items to the users. This
paper proposes a new framework for dynamic and overlapping community-based collaborative filtering, which
models at first the dynamic behavior of users’ interests into a temporal network of items. Then, we take
advantage of the dynamic and overlapping community detection techniques to find the best partition of similar
items. The advantage of doing so is to (i) avoid processing the entire system to select similar items and
eventually overcome the scalability problem and (ii) provide users with a recommendation of items similar to
the latest appreciated items to match the current users’ taste and avoid consequently sparse cases. We conduct
experiments to study the sensitivity of some parameters (e.g., the datasets and the similarity measures) on the
recommendations’ quality. Experimental results show a considerable improvement in the proposed framework
recommendation’s accuracy compared to the state-of-the-art recommender systems.
1 INTRODUCTION
Due to the huge amount of resources accessible via
the internet, finding relevant information becomes a
challenging task. Recommender systems (RSs) were
introduced to achieve personalization and increase
users’ satisfaction by recommending items that fit
their needs and tastes. Item recommendations can be
made using different approaches namely collabora-
tive filtering, content-based and hybrid approaches.
Collaborative Filtering (CF) is the widely applied rec-
ommendation approach due to the high availability of
users’ preferences information (Qiang and Yan, 2012)
(i.e., the ratings assigned to items). Two main classes
of CF exist, namely, user-based and item-based. We
are particularly interested in the item-based approach
that consists in computing the preference prediction
based on the ratings given to similar items. Basi-
cally, the item-based CF analyzes the entire user-
item rating data to identify similar items. This can
present various challenges, including data sparsity,
scalability, and cold start problem. Community de-
tection was used in recommender systems to over-
come the recommendation issues (Sahebi and Cohen,
2011; Qin et al., 2010; Deng et al., 2014) and gen-
erate more accurate recommendations. The commu-
nity structure could reveal either the set of items or
users that share the same properties. Therefore, the
community-based recommendation has a low compu-
tational cost compared to the basic recommendation
approach since it focuses on pre-detected communi-
ties instead of the whole network. However, the exist-
ing community-based recommendation methods basi-
cally rely on static algorithms to detect communities
and fail to consider the temporal evolution of users’
interests.
Delving into the dynamic aspect of network be-
havior has become a necessity, especially for rapidly
growing complex networks. The customers’ pref-
erences and interests are changing over time. It is
crucial to track such temporal changes when defin-
ing similar items. It is affirmed that recommender
systems taking into account the dynamic behavior of
users’ interests can provide more relevant recommen-
dations of items (Yehuda, 2009). Based on this idea,
we aim to exploit the dynamics of users’ interests over
time to identify the appropriate communities corre-
sponding to each step of the network evolution. Incor-
Ben Abdrabbah, S., Ben Amor, N. and Ayachi, R.
A New Dynamic Community-Based Recommender System.
DOI: 10.5220/0011641300003393
In Proceedings of the 15th International Conference on Agents and Artificial Intelligence (ICAART 2023) - Volume 2, pages 125-136
ISBN: 978-989-758-623-1; ISSN: 2184-433X
Copyright
c
2023 by SCITEPRESS – Science and Technology Publications, Lda. Under CC license (CC BY-NC-ND 4.0)
125

porating such dynamic communities in recommenda-
tion tasks may provide the system with a good vision
of the most recent neighbors. Furthermore, in real-
world networks, the communities overlap such that
nodes may belong to several partitions at the same
time. For instance, an item naturally tends to belong
to several groups of different categories and popular-
ity. The overlapping aspect should also be taken into
account when detecting similar items to improve the
performance of the provided recommendations (Vla-
chos et al., 2014).
In this paper, we propose a new framework for dy-
namic and overlapping community-based collabora-
tive filtering (called for short DO2CF). The proposed
framework considers the evolution of users’ prefer-
ences over time and the overlapping aspect of items
when identifying the most similar items. In rough
outline, our framework consists of three main steps,
namely dynamic network construction, dynamic com-
munity detection and recommendation. The first step
consists in modeling the dynamic aspect of users’
interests into a temporal network where nodes are
the items and edges between nodes are established
based on the co-rating relationships. In the second
step, we use dynamic and overlapping community de-
tection techniques that can track all the topological
changes of the temporal network to learn the evolu-
tion of users’ interests and detect a community struc-
ture accordingly. Indeed, each community reveals
a set of items having similar interests. Finally, we
exploit the network partition to (i) select the items’
neighbors more easily and quickly, (ii) identify the
candidate items that match the users’ current tastes,
and (iii) adapt the similarity measure to consider how
much the co-users like one item relative to the other
similar items instead of all the other items they rated.
This paper is structured as follows. Section 2
presents the basics of recommender systems, com-
munity detection, and community-based recommen-
dation. Section 3 further illustrates the different steps
of our framework. Finally, Section 4 presents the con-
ducted experiments and their corresponding results.
2 RELATED WORK ON
COMMUNITY-BASED
RECOMMENDATION
We recall in this section the basic concepts of recom-
mender systems and community detection separately.
Then, we expose community-based recommendation
and their related works.
2.1 Recommender Systems
The growth of web content and services has raised
the interest in recommender systems. RSs are basi-
cally classified into three major categories, namely
Collaborative Filtering (CF), content-based filtering,
and hybrid approach. The CF exploits the user-item
rating data to suggest items to the active user. The
content-based filtering focuses on the item features to
characterize the items similar to the ones that the ac-
tive user likes. The hybrid approach takes advantage
of the rating information of users as well as the con-
tents of items to produce recommendations. In this
work, we focus on collaborative filtering as it is the
most popular and used recommendation technique.
There are two main CF approaches: item-based when
the recommendations are generated based on the ac-
tive user’s ratings for similar items, and user-based
when the recommendations are computed based on
the similar users’ ratings to the target item. We are
particularly interested in the item-based CF approach
as it provides a better recommendation quality than
the user-based algorithms (Sarwar et al., 2002). Due
to the nature of the data, CF could reveal some crit-
ical challenges such as data sparsity when there are
not enough users’ ratings, scalability when the num-
ber of ratings grows, and cold start problem when the
active user is a new coming in the system (i.e., he does
not have any rating data).
2.2 Community Detection
Complex networks are a natural way to represent so-
cial, biological, technological, and information sys-
tems. An interesting feature, that complex networks
present, is the community structure-property. Com-
munity detection was proposed as an efficient tool
to capture the hidden structure of these networks by
partitioning the entities into a set of dense subgroups
commonly called communities. A community is gen-
erally defined as a set of nodes strongly connected
among them and more weakly connected to the re-
maining of the network (Fortunato, 2010). Study-
ing the forming community structure in complex net-
works may help to learn the collective behavior of
their entities and help the understanding of the mod-
eled systems. The first attempts (Palla et al., 2005;
Newman and Girvan, 2004) focused on detecting
communities in static networks that are constructed
by aggregating all observed data (also called static
graphs). However, the democratization of the web
2.0 has produced new challenges for community de-
tection, including the overlap of communities and the
temporal aspect of the data (i.e., dynamic networks)
ICAART 2023 - 15th International Conference on Agents and Artificial Intelligence
126

(Aston et al., 2014). The static community detec-
tion algorithms cannot support such challenges be-
cause they overlook the time information that is cru-
cial to understand the phenomena taking place in the
dynamic networks. Recently, many algorithms (Caz-
abet and Amblard, 2011; Nguyen et al., 2011; Xie
et al., 2013) have been proposed to deal with dynamic
networks.
2.3 Community-Based
Recommendation
In recommender systems, there are two classes of en-
tities: items and users. Indeed, the community struc-
ture reveals either the set of items or users with the
same properties. Most of the existing works are inter-
ested in detecting communities of users since people
often tend to form communities in real life. For in-
stance, (Sahebi and Cohen, 2011) considered the dif-
ferent dimensions of social networks to extract latent
communities of users using the Principal Modular-
ity Maximization method. The resulting communities
help recommender systems to overcome the cold start
problem when the user has no rating history. (Qiang
and Yan, 2012) applied a Multi-label propagation al-
gorithm for static community detection in a bipartite
network composed of users and items. Based on the
active user’s communities, the authors recommended
items using the collaborative filtering recommenda-
tion method. (Ying et al., 2013) proposed a Prefer-
ence Aware Community Detection method (PCD) to
extract communities based on both users’ rating his-
tory and social structure. Besides, they implemented
a Preference Aware Community-based Recommenda-
tion System (PCRS) that uses the discovered commu-
nities to recommend items to users. (Guo and Peng,
2014) chose at first the spectrum analysis algorithm to
extract communities from a user-user network. Then,
they employed an evolutionary algorithm to identify
the best neighborhood size for each community. Fi-
nally, they integrated the best neighborhood size of
the active user’s community in collaborative filtering
to generate recommendations. On the other hand,
some studies are interested in finding communities
of items and incorporating them into the recommen-
dation model. For instance, (Qin et al., 2010) con-
structed a YouTube Recommender Network (YRN)
based on reviews left as comments in the YouTube
videos. Then, they used CFinder algorithm to find
communities in YRN. These communities are then
used to recommend, for the active user, diverse videos
that are not restricted to the same tag annotation. In
(Fatemi and Tokarchuk, 2013), the authors employed
the Louvain community detection method to extract
communities of movies from the social network of
movies that is constructed based on the Internet Movie
Database (IMDb). Based on these communities, ex-
tensive and diverse movies are recommended to both
individuals and groups. The studies presented above
overlooked the time dimension of users’ preferences
when computing recommendation. However, the data
collected from recommender systems is often times-
tamped. The time dimension plays a very impor-
tant role to properly capture the current need of users
based on the most recent data.
Some studies proposed to explore the dynamic as-
pect of users’ preferences in the recommendations
generation process. (Abrouk et al., 2010) proposed to
use fuzzy k-means clustering from time to time to dy-
namically capture the last users’ preferences when de-
tecting communities. These latter are then exploited
to predict the active user’s preferences for the unseen
items. In (Hamzaoui et al., 2012), the authors have
clustered items into groups using the K-mean algo-
rithm. Then, they identified the clustering center of
each cluster. The center is represented as the average
ratings over all the items in the cluster. Finally, they
computed the similarity between the target item and
all the identified centers to select its neighbors and
generate recommendations. The authors assigned a
time weight for each pair of <user, item> with the
aim to decay the old data when computing the item-
item similarity. In (Xin et al., 2014), the authors em-
ployed the Importance Greedy (IG) algorithm to de-
tect communities in the reader-reader similarity net-
work. The book recommendation list is generated
based on top ’k’ books which are recently borrowed
by the users belonging to the active user’s community.
The time of book borrowing is considered to highlight
the time factor when generating book recommenda-
tions. (Yin et al., 2014) employed a modified Proba-
bilistic latent semantic analysis (PLSA) model to dis-
cover communities. Then, they applied matrix factor-
ization on each community. To model the temporal
changes in users’ interests, they used a time decay
function which weighed the importance of the users
latest interests when generating recommendations.
The existing community based-recommendation
methods still rely on static community detection al-
gorithms that cannot deal with the dynamic aspect of
users’ interests. Static community detection cannot
support the network’s topological changes, and conse-
quently it misrepresents the true image of the network
partitions. Using these communities in the preference
prediction process may reduce the performance of the
generated recommendations.
A New Dynamic Community-Based Recommender System
127
3 A NEW FRAMEWORK FOR
DYNAMIC AND OVERLAPPING
COMMUNITY-BASED CF
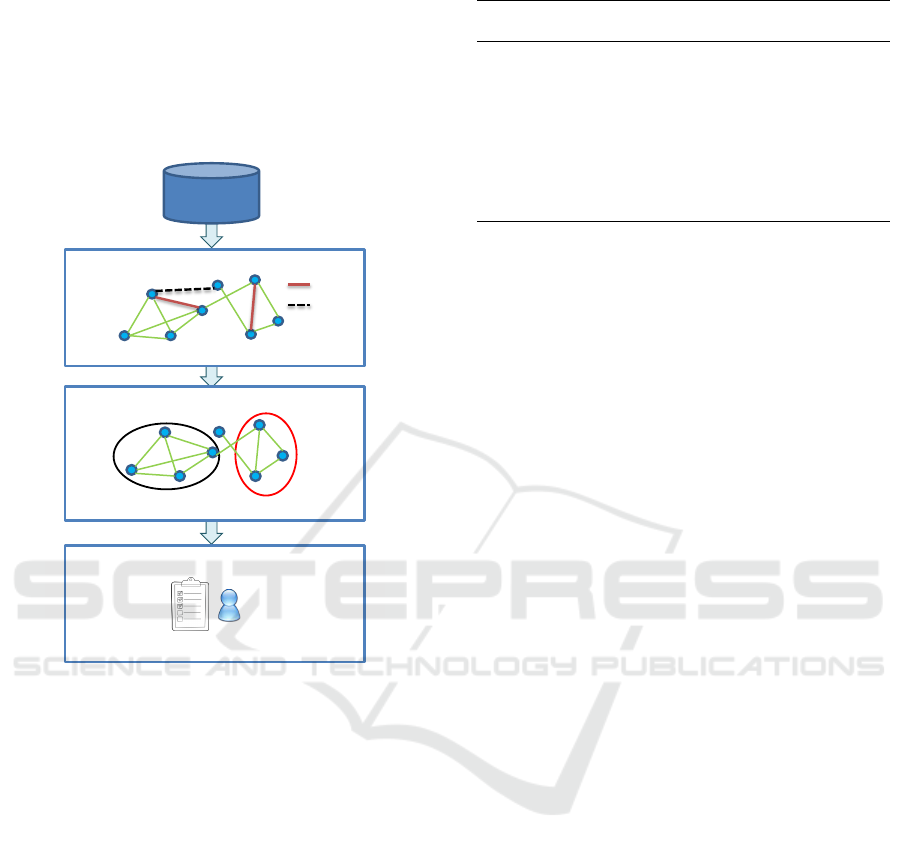
We propose a new framework for dynamic and over-
lapping community-based CF (DO2CF) (shown in
Figure 1) comprising three main steps detailed below.
Step 1: Dynamic network construction
Step 2: Dynamic community detection
Network community structure
Step 3: Recommendation
Time-stamped
Data
Item-item dynamic network
Recommendation list
Add
Delete
Figure 1: A framework for dynamic and overlapping
community-based CF.
3.1 Step 1: Dynamic Network
Construction
The users’ interests in items are rapidly changing over
time. This step consists in modeling the dynamic as-
pect of users’ interests into a temporal network as
it is the most appropriate representation when data
evolves rapidly. Indeed, the snapshot-based repre-
sentation cannot track all the interactions that appear
over the multiple stages of the network life. Such
representation is more adapted to time windows data
composed of long-lasting relations (for instance, a
weekly/monthly/yearly complete crawl of a system)
and cannot fit the evolving nature of users’ interac-
tions in recommender systems. To build the tempo-
ral network, we start by modeling items as nodes and
items relationships as edges. Nodes and edges can be
added to (+) or removed from (-) the graph. We con-
sider that a link exists between two items as long as
these items interact frequently enough during a given
Table 1: Example of rating database.
UserID ItemID Rating(1 −
5)
Timestamp
Alex Titanic 3 12/03/2014
Alex Troy 3 12/03/2014
Amel Troy 3 16/03/2014
Doudi Titanic 3 16/03/2014
Kim Batman 5 17/03/2014
Sam Titanic 4 14/03/2014
Sam Troy 4 14/03/2014
Kim Titanic 5 17/03/2014
Doudi Batman 3 16/03/2014
period. Items interactions are defined based on the
co-ratings relationship delivered from users’ profiles.
An item-item interaction is created if one user gives
the same rating to both items in the same period. To
model the network topology changes, we define two
parameters N as the number of interactions and P as
the number of days.
• An edge is inserted if there are at least N interac-
tions between two items over a period of P days.
• An edge is removed if, over a period of P days,
they occur less than N interactions between two
items.
Example 1. Let us consider a movie rating database
that contains three movies (Titanic, Troy, Batman)
and five users (Alex, Amel, Doudi, Kim, Sam). The
users’ ratings data are presented in Table 1.
In order to construct the temporal network of the
period T from 12/03 to 17/03, we first model the
movies as nodes and we consider that N = 2 and
P = 3. Thus, to create an edge between two movies,
we need at least two interactions between these ones
over a period of three days. To this end, we will check
if Titanic and Troy can be linked. So, we start by ex-
tracting all Titanic-Troy interactions:
• Alex rates both Titanic and Troy with the same
rating (i.e., 3) in the same date (March the 12
th
),
so the first interaction between Titanic and Troy is
created on 12/03/2014.
• Sam gives the same rating (i.e., 4) to both Titanic
and Troy in the same date (March the 14
th
), so
the second interaction between Titanic and Troy
is created on 14/03/2014.
Over the first 3 days (i.e., from (12/03) to (14/03)),
there are two interactions between Titanic and Troy.
Then, the edge between these nodes is created. Over
the 3 following days (i.e., from (14/03) to (17/03)),
the edge between Titanic and Troy is removed since
there are less than two interactions. Moreover, an
edge is created between Titanic and Batman since
there are more than two interactions between them
over the period from (14/03) to (17/03). The net-
work is finally constructed since there are no more
ICAART 2023 - 15th International Conference on Agents and Artificial Intelligence
128
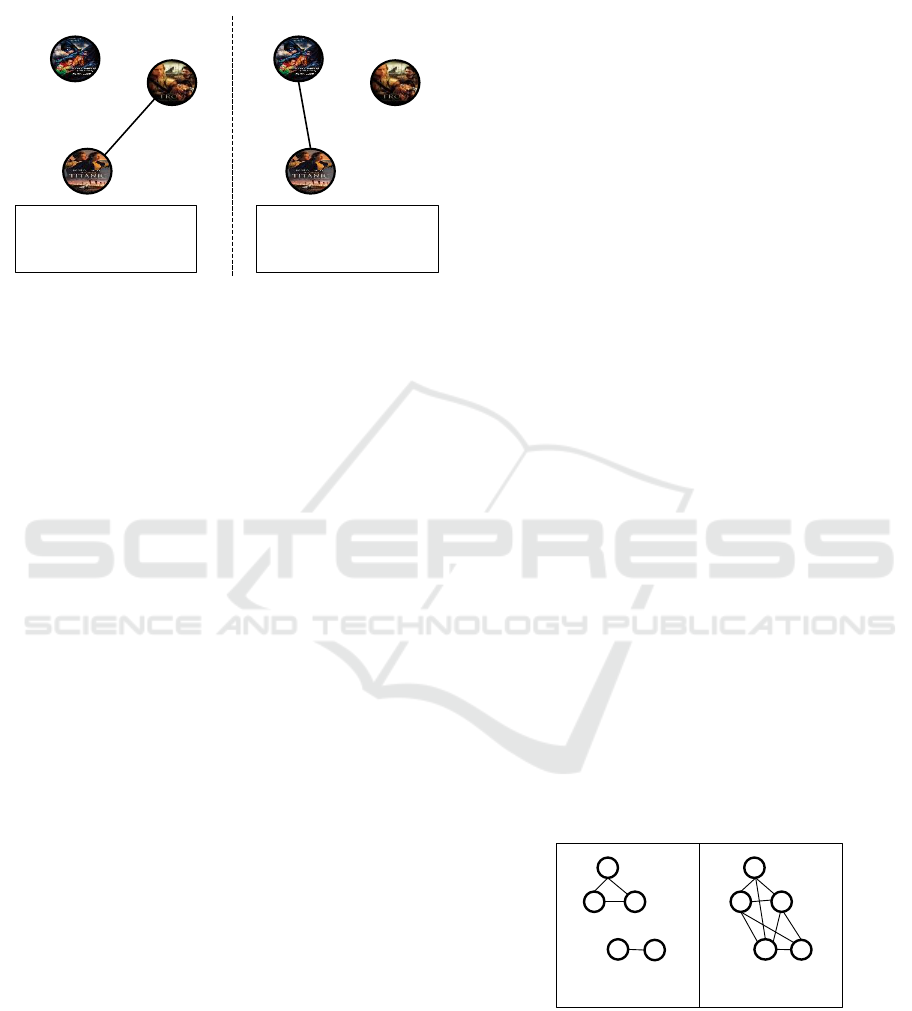
rating data after (17/03). The different steps of the
temporal network construction are presented in Fig-
ure 2.
Iteration 1: from 12/03/2014 to 14/03/2013
[2, 3]
# 12/03/2014
Iteration 2: from 15/03/2014 to 17/03/2013
[2, 3]
# 15/03/2014
- Titanic Troy
+ Titanic Batman
+ Titanic Troy
Figure 2: An example of the temporal network construction.
The parameters P and N are considered key to cre-
ating more semantic links between nodes. The es-
timation of these parameters highly depends on the
datasets. Recommendation datasets are often char-
acterized by three features, including the number of
users, the number of items, and the number of ratings
(i.e., numerical evaluations given by users to items).
At first, we process all the data to find out the num-
ber of interactions N corresponding to each pair of
items (i.e., how many users give the same rating to
both of these items) and the period P in which these
N interactions occurred. Then, we select many signif-
icant values for N and P: N
min
(resp. N
med
, N
Q3
and
N
max
) which indicates the minimal (resp. median, 3rd
quartile and maximal) number of interactions and P
min
(resp. P
med
, P
Q3
and P
max
) which indicates the mini-
mal (resp. median, 3rd quartile and maximal) number
of days. Knowing that the 3rd quartile indicates the
values below which 75% of observations in a set of
data fall. A temporal network is constructed based on
each possible combination between N and P.
Example 2. Let us re-consider the same rating
database of Table 1. We compute the parameters
N and P corresponding to each pair of items in the
dataset. The number of interactions N for [Titanic,
Troy] (resp. [Titanic, Batman] and [Troy, Batman]) is
equal to 2 (resp. 2 and 1). The period P in which these
interactions occurred between [Titanic, Troy] (resp.
[Titanic, Batman] and [Troy, Batman]) is equal to 3
(resp. 2 and 1). Thus, the number of interactions N
min
(resp. N
med
, N
Q3
, N
max
) is equal to 1 (resp. 2, 2, 2)
and the number of days P
min
(resp. P
med
, P
Q3
, P
max
) is
equal to 1 (resp. 2, 2, 3).
The resulting item-item dynamic network is then
considered as a generic temporal network that repre-
sents the evolution of users’ preferences over time.
3.2 Step 2: Dynamic Community
Detection
Given the temporal network that models the dynamic
evolution of users’ interests (i.e., the output of step1),
this step consists in using a community detection
algorithm to extract communities. The community
identification process strongly depends on the nature
of the network (i.e., dynamic or static) and the over-
lapping aspect of the network entities (if the entities
may belong to different subgroups at the same time).
It is well understood that items in the recommender
system are naturally characterized by multiple com-
munity memberships since they may satisfy the needs
of several users with different tastes. Thus, overlap-
ping community detection might be more appropri-
ate to reveal interesting and useful patterns of similar
items.
Moreover, the users’ interests in items are chang-
ing over time. We need an algorithm that can con-
sider the dynamic aspect of this behavior when de-
tecting communities. The ongoing changes of a net-
work may be among the most interesting properties
to consider to detect more significant and appropriate
communities. We consider for instance the evolution
of two steps (t
1
and t
2
) of a small graph composed of
five nodes represented in Figure 3. If we only have
a simple view of the last step (t
2
), we will not be
able to identify the appropriate community structure
in the network. This is mainly because this network
is strongly connected since it merges the whole ob-
served links during the studied period. However, if we
have an overview of the evolution process, we will be
able to detect the network community structure that
represents the real situation. Hence, by seeing t
1
and
t
2
, we can say that we probably have two communities
(i.e., (abc) and (de)). Consequently, a considerable
impact on recommendations is envisaged depending
on the type of community detection algorithm.
a
c b
d
e
b
d
e
t
1
t
2
a
c
Figure 3: Example of two different steps of a network evo-
lution.
In this step, we focus on community detection al-
gorithms that deal with two basic characteristics: the
dynamic behavior of the network and the overlapping
aspect of communities. In this work we focus on al-
A New Dynamic Community-Based Recommender System
129

gorithms that can support the temporal network (i.e.,
output of step 1) as input, namely iLCD (Cazabet and
Amblard, 2011) and AFOCS (Nguyen et al., 2011).
• In (Cazabet and Amblard, 2011), the authors pro-
pose an Intrinsic Longitudinal Community Detec-
tion (iLCD) that uses a multi-agent-based method
to handle the evolution of communities. The gen-
eral principle of the algorithm is essentially based
on local computations. Indeed, the communi-
ties can perceive only the nodes that they contain
and they can interact only with other communities
having at least a node in common. When they per-
ceive a topological change in their local environ-
ment (edge/node addition/removal), the candidate
communities take decisions to add/lose nodes,
split into two distinct communities, or merge with
another community based on a set of rules:
– For any link addition (i, j) in the network, if i
is in a community C and j does not belong to
C, iLCD checks if j must be integrated into C
and it finds then the set of these newly-formed
communities by the appearance of this new link
(i.e., resulted from the fusion of the modified
communities).
– For any deletion of a link, if this edge is found
within a community, iLCD checks if the con-
cerned community C loses one or many nodes
which may lead to self-division.
• In (Nguyen et al., 2011), the authors proposed
the Adaptively Finding Overlapping Community
Structure (AFOCS) algorithm that can detect
overlapping communities in a dynamic network
through two phases. The first phase consists in
discovering all possible basic communities in the
original input network by extracting at first all
possible densely connected sub-graphs of the net-
work and then combining those that share a sig-
nificant common substructure. The second phase
consists in examining, after every network topo-
logical change, the internal density of the current
community structure to update the basic commu-
nity structure:
– If new node addition (V + v): AFOCS checks
if v should (i) be considered as outliers or (ii)
joins existing communities or (iii) forms a new
community with a substructure of the network.
– If new edge addition (E + e): AFOCS checks
if e (i) has no impact on the current structure
or (ii) allows the combination of two existing
communities or (iii) allows an existing commu-
nity to grow up.
– If node deletion (V −v): AFOCS checks if this
change (i) has no impact on the current struc-
ture or (ii) allows an existing community to
contract or to disappear.
– If edge deletion (E −e): AFOCS checks if this
change (i) has no intact on the current structure
or (ii) allows an existing community to split
into two distinct communities.
3.3 Step 3: Recommendation
This step consists in generating the recommendation
list for the active user based on the network commu-
nity structure of items (i.e., the output of step 2). The
discovered communities are exploited to (i) determine
the candidate items that can suit the active user’s latest
feedback and (ii) select the items involved to compute
the active user’s preferences prediction for these can-
didate items.
Typically, the preference prediction is computed
for each unseen item. However, it is not necessary
to handle the items that could not match the active
user’s current needs. Indeed, the user’s preferences
change over time and what was interesting before may
not be the case now. For this reason, we assume
that the active user would be interested in items sim-
ilar to his/her current taste, namely candidate items.
The candidate items are therefore identified based
on the communities of the recently appreciated item.
By doing this, (i) we avoid browsing all the unseen
items and eventually overcome the scalability prob-
lem. And (ii) we keep away from sparse cases since
there is at least one similar item already liked by the
active user. Then, the active user’s preference for each
candidate item is computed to generate the top k rec-
ommendation list.
P
u,i
=
∑
j∈C
s(i, j) r
u, j
∑
j∈C
|s(i, j)|
(1)
where C is the set of items pertaining to the communi-
ties of i, r
u, j
is the rating given by the active user u to
the item j and s(i, j) is the similarity degree between
items i and j.
There are several methods to compute the relative
similarity among items in the literature (Sarwar et al.,
2001). Basically, the similarity of items i and j is
computed by looking essentially to the co-users who
have rated both these two items. We present a brief
description of the most common similarity measures
as follows:
• Pearson correlation measures the similarity be-
tween items based on the correlation between the
co-users ratings.
s(i, j)=
∑
u∈U
(R
u,i
−R
i
)(R
u, j
−R
j
)
√
∑
u∈U
(R
u,i
−R
i
)
2
√
∑
u∈U
(R
u, j
−R
j
)
2
ICAART 2023 - 15th International Conference on Agents and Artificial Intelligence
130

where U is the set of co-users, R
u,i
is the rating
given by user u to item i, R
i
is the average ratings
given to i and R
j
is the average ratings given to j.
• Cosine measure estimates the similarity of two
items by looking to the distance between the fea-
ture vectors of these items.
s(i, j)=cos(i,j)=
i∗j
∥
i
∥
2
∗
∥
j
∥
2
• Tanimoto coefficient is the implementation of Jac-
card similarity that computes the similarity be-
tween two items based on the intersection of their
preferences.
• Likelihood ratio computes the similarity between
items based on the overlapping users’ preferences.
• Adjusted cosine similarity uses the average of the
u
th
co-user’s ratings to make the correlation be-
tween the co-users’ preferences. However, in this
work we focus on computing the similarity of two
items within the same community. Intuitively, we
modify the Adjusted cosine similarity to integrate
the community structure in addition to the co-
users rating information. In fact, we replace the
mean of the user’s ratings with the mean of the
user’s ratings for items belonging to the common
communities to measure how much the co-users
like one item relative to the other similar items
they rated.
s(i, j)=
∑
u∈U
(R
u,i
−R
u,C
i j
)(R
u, j
−R
u,C
i j
)
√
∑
u∈U
(R
u,i
−R
u,Ci j
)
2
r
∑
u∈U
(R
u, j
−R
u,C
i j
)
2
where U is the set of co-users, R
u,i
is the rating
given by user u to item i, R
u,Ci j
is the average rat-
ings given by user u to items belonging to com-
mon communities of i and j.
The preference estimation is also affected, on the
one hand, by the number of items in the same com-
munities and, on the other hand, by the number of
common communities. Algorithm 1 presents the rec-
ommendation step.
Example 3. Let us consider the network commu-
nity structure composed of 2 communities C
1
and C
2
.
Movies Ted2, Batman and X-men belong to C
1
and
movies Gladiator, Batman and Ted2 belong to C
2
. Ta-
ble 2 presents the rating data of Jane on the available
movies.
We can note that the Ted2 and Batman movies
are more similar than any other movies since they
have more common communities. For instance,
Batman will be considered twice in the preference
computation as it has two common communities with
Ted2 while X−men will be considered just once as it
shares one common community with Ted2. Knowing
Algorithm 1: Pseudocode for the recommendation step.
Require: : Network community structure C =
c
j
,
Active user u, active user’s ratings R
u
Ensure: : Recommendation list L
i
∗
← Max pre f erred(R
u
)
C
∗
←target communities(C,i
∗
)
for j ∈ candidate items(C
∗
,R
u
) do
P
u, j
← Pre f erence(R
u
,C, j)
end for
L ←Max Pre f erence(P
u, j
)
% Max pre f erred(R
u
): Returns the most recent liked item by the user u
% target communities(C,i
∗
): Returns the communities of i
∗
% candidate items(C
∗
,R
u
): Returns the set of items belonging to C
∗
and has not yet been rated by u.
% Pre f erence(R
u
,C, j): computes the preference prediction as the
weighted sum of the u’s ratings given to the items belonging to
the communities of j.
% Max Pre f erence(P
u, j
): Selects the top-k items with the higher
preference prediction values in the recommendation list.
Table 2: Jane’ Ratings data.
Movie title Rating(1 −5)
Batman 3
X-men 5
Ted2 ?
Gladiator ?
that the similarity between the pair of items (Ted2,
Batman) (resp. (Ted 2, X−men) and (Gladiator,
Batman)) is 0.4 (resp. 0.53 and 0.6), the preference
of Jane on movies Ted2 and Gladiator are computed
as follows:
P
Jane,Ted2
=
∑
b∈C
1
,C
2
s(Ted2,b)∗r
Jane,b
∑
b∈C
1
,C
2
|s(Ted2,b)|
=
(0.4∗3)+(0.4∗3)+(0.53∗5)
0.4+0.4+0.53
= 3.79
P
Jane,Gladiator
=
∑
b∈C
2
s(Gladiator,b)∗r
Jane,b
∑
b∈C
1
|s(Gladiator,b)|
=
0.6∗3
3
= 3
Thus, the movie Ted2 is selected as the best rec-
ommendation alternative to Jane.
4 EXPERIMENTAL STUDY
To evaluate the accuracy of the proposed framework,
we conduct experiments on two real-world data sets
A New Dynamic Community-Based Recommender System
131

namely, MovieLens data set
1
and Video games re-
views data set
2
. All the experiments are implemented
in Java JDK 1.8 on a windows 10 based PC with in-
tel Core i3 processor having a speed of 2.40 GHz and
4GB of Ram and compiled in eclipse framework. In
what follows, we first describe the data sets and the
evaluation metrics. Then, we present the experimen-
tal results.
4.1 Datasets and Metrics
The data sets used in our experiments are:
• MovieLens data set extracted from movies recom-
mender system containing 10 million of ratings
collected from 72 000 users on 10 000 movies
(items) from 2000 to 2009. Each user has rated
at least 20 items and made a rating at five discrete
levels from 1 to 5.
• Video game reviews data set extracted from Ama-
zon including 1 million ratings spanning from
June 1997 to July 2014. The ratings are collected
from 129 496 customers on more than 1371 video
games, and they are on a numeric five-point scale
(i.e., from 1 to 5).
Each data set is divided into two subsets: a train-
ing set and a testing set. The training set is used to
construct the dynamic network of items, detect com-
munities and finally, predict the user’s rating for an
item to generate the recommendation list. The test-
ing set is used to evaluate the closeness of the pre-
dicted rating compared to the user’s provided rating.
To this end, we first split the data chronologically
into testing (20% of the recent instances) and training
(the remaining ones). The efficiency of the proposed
framework is evaluated using classification accuracy
measure, namely F-measure and predictive accuracy
metric, namely Mean Absolute Error (MAE) (Chena
and Liu, 2017). F-measure denotes the weighted har-
monic mean of the precision and recall of the gener-
ated recommendations. MAE measures the deviation
of the estimated preference from the true preference
value specified by the active user. The lower the MAE
is, the better the generated recommendations are. For-
mally:
F −measure =
2 ∗Precision ∗Recall
Precision + Recall
Precision =
RR
RR + FR
Recall =
RR
RR + RN
1
https://movieLens.umn.edu
2
https://snap.stanford.edu/data/web-Amazon.html
where RR denotes relevant and recommended items,
RN denotes relevant and not recommended items,
and FR denotes not relevant and recommended items.
MAE =
∑
n
i=1
|p
i
−q
i
|
n
where p
i
denotes the predicted rating for item i, q
i
denotes the true rating for item i, n: the corresponding
ratings-prediction pairs.
4.2 Experimental Protocol
Before presenting the experimental results and com-
paring them with state-of-the-art recommendation al-
gorithms, we propose to test the impact of some pa-
rameters on the quality of the proposed framework.
The parameters representing the optimum values are
then taken for the rest of the experiment.
4.2.1 The Parameters N and P
To detect the values that can capture communities
with the most interesting size and internal topologies,
we count, for each pair of items, the number of in-
teractions N and the corresponding period P. Subse-
quently, we select various significant values (i.e., the
minimal, the median, the 3rd quartile, and the maxi-
mal) for these parameters as follows:
• For MovieLens data, we found 171 787 pairs of
movies interacted together. The maximal num-
ber of interactions N
max
(resp. the minimal N
min
,
the median N
med
, and the 3rd quartile N
Q3
) is 414
(resp. 1, 2 and 2). The maximal period of days
P
max
(resp. the minimal P
min
, the median P
med
,
and the 3rd quartile P
Q3
) is 1035 (resp. 1, 119 and
517).
• For video game data, we found 3580 pairs of
video games that have interacted together. The
maximal number of interactions N
max
(resp. the
minimal N
min
, the median N
med
, and the 3rd quar-
tile N
Q3
) is 55 (resp. 1, 1, 2). The maximal period
of days P
max
(resp. the minimal P
min
, the median
P
med
, and the 3rd quartile P
Q3
) is 5329 (resp. 1,
2290 and 2664).
A temporal network is constructed for each pos-
sible combination between P and N (i.e., 4
2
tempo-
ral networks built for each dataset). We first apply
iLCD and AFOCS to detect dynamic communities
from each temporal network. The resulting communi-
ties are then used to compute recommendations. We
kept only the valid temporal network of items (i.e.,
with existing links and a non-empty community struc-
ture) since it is hard to find connections that hold on
between nodes if N is maximal and/or P is minimal.
ICAART 2023 - 15th International Conference on Agents and Artificial Intelligence
132
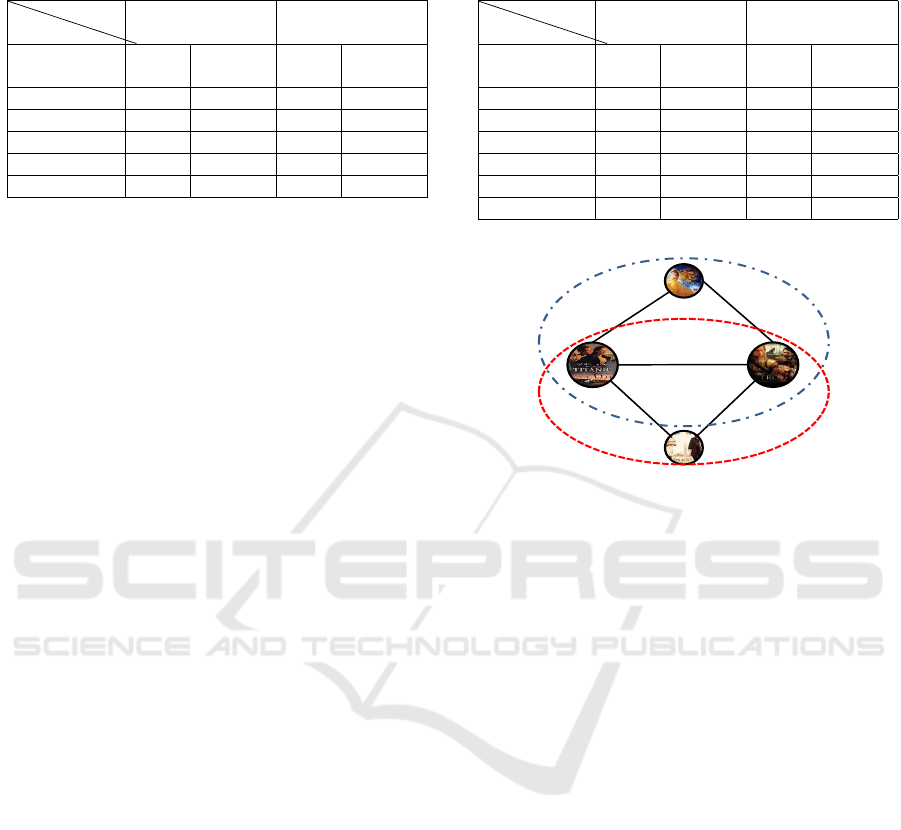
Table 3: The impact of N and P on the recommendation
quality in MovieLens.
[N,P]
Algo
iLCD AFOCS
MAE F −
measure
MAE F −
measure
[1,119] 0.68 0.267 0.88 0.15
[1,517] 0.6 0.29 0.7 0.2
[1,1035] 0.56 0.299 0.66 0.22
[2,517] 0.683 0.277 0.81 0.154
[2,1035] 0.48 0.39 0.57 0.258
We present in Tables 3 and 4 the accuracy of the rec-
ommendation for different community detection algo-
rithms and different temporal networks in MovieLens
and Video Game reviews data sets, respectively. Table
3 shows that the prediction accuracy in MovieLens
dataset reaches its maximum when N is fixed to 2 and
P is fixed to 1035. While Table 4 shows that the pre-
diction accuracy in the Video Games data set reaches
its maximum when N is equal to 2 and P is equal to
5329. Thus, we conclude that the prediction accu-
racy reaches its maximum when N is the median value
and P takes the maximum for both databases. Indeed,
we need to consider the most frequent value of item-
item interactions and the maximal period P to keep
the highest number of connected nodes. We can also
observe from Tables 3 and 4 that by using the dynamic
iLCD algorithm the recommendation quality reaches
its maximum compared to AFOCS. This is justified
by: (i) its aptitude for considering the network evolu-
tion over time that has a major impact on the detected
network community structure and (ii) its ability to dis-
tinguish between representative nodes and hubs (i.e.,
highly centralized nodes) to decide against merging
communities with many outside neighboring nodes.
Example 4. For instance, if we consider Figure
4. Titanic, Troy, and Tourist are 3 movies of the
same community C
1
(i.e., many users have evaluated
Tourist similarly as Titanic and Troy). Moreover,
movies Belle, Titanic and Troy belong to the same
community C
2
). However, Tourist and Belle cannot
be similar (i.e., be in the same communities C
1
∪C
2
)
just because both are similar to Titanic and Troy.
These latter are popular legendary movies and can
be appreciated by many users with different tastes.
Hence, we chose to use dynamic iLCD algorithm
(Cazabet and Amblard, 2011) to detect communities
in the remaining experiments. Figure 5 shows two
snapshots of the network community structure de-
tected by iLCD with the aforementioned optimal re-
sults of N and P.
Table 4: The impact of N and P on the recommendation
quality in Video games.
[N,P]
Algo
iLCD AFOCS
MAE F −
measure
MAE F −
measure
[1,2290] 1.22 0.263 1.34 0.19
[1,2664] 1.2 0.27 1.29 0.194
[1,5329] 1.19 0.284 1.268 0.2
[2,2290] 1.4 0.192 1.6 0.166
[2,2664] 1.02 0.293 1.24 0.225
[2,5329] 0.99 0.32 1.18 0.3
𝐶
1
𝐶
2
Figure 4: Example of a network structure.
4.2.2 The Effect of the Similarity Measure
In this experiment, we choose to test the similarity
measures namely, Pearson correlation, Cosine, Tani-
moto coefficient, Likelihood ratio and adjusted cosine,
as they are commonly used in recommender systems
in our data sets, and study their effects on the obtained
prediction quality. We have implemented the Ad-
justed cosine similarity measure, and we use Apache
Mahout’s implementations of other measures. Figure
6 shows the evaluation results.
We can see that for both MovieLens and Video
Games data sets, using the adjusted similarity in the
proposed framework achieves the lowest MAE and
the highest F-measure value compared to other simi-
larity measures. This result can be justified by the fact
that is more interesting to focus on how much the co-
users liked similar items instead of all the other items
to measure the similarity of items of the same com-
munities. Therefore, the adjusted cosine similarity is
used in what follows.
4.3 Comparison with Related Work
In this section, we propose to compare the recom-
mendation accuracy of our dynamic and overlapping
community-based recommendation framework with
existing related work approaches presented in Table
5.
A New Dynamic Community-Based Recommender System
133
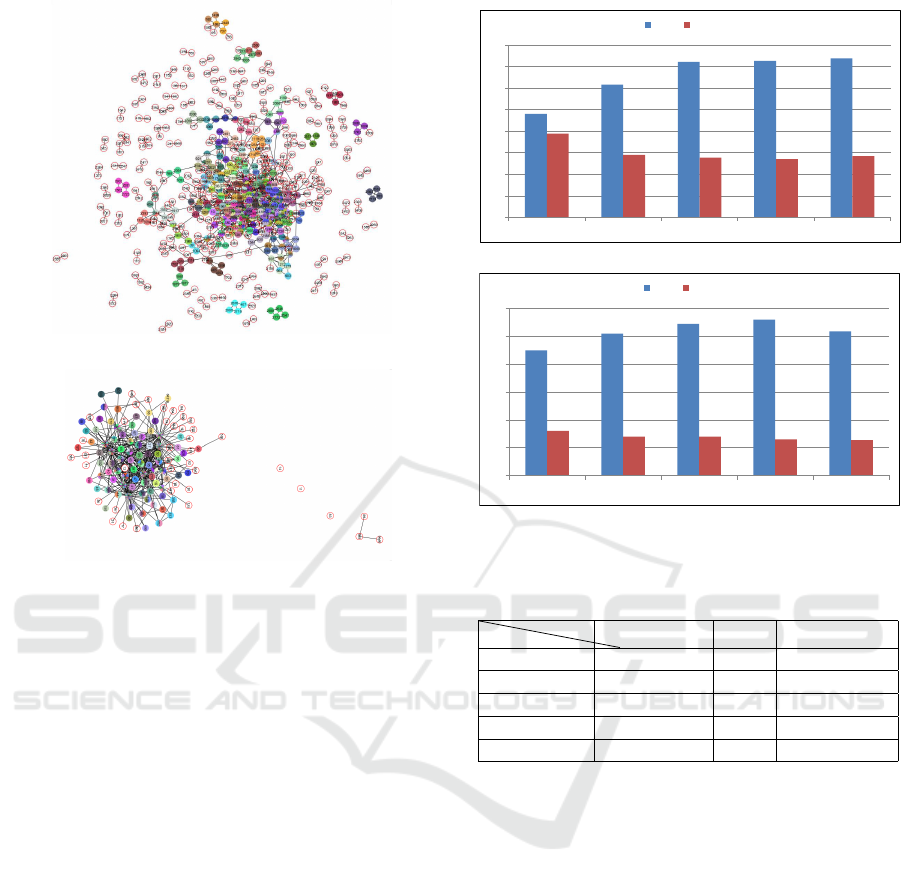
(a) MovieLens.
(b) Video Games reviews.
Figure 5: Network Community structure of iLCD with
[N
med
,P
max
].
The static community-based CF (so-called
S.community) (Fatemi and Tokarchuk, 2013) em-
ployed the Louvain method to extract communities
of movies. The static clustering-based CF (so-called
S.cluster) (O’Connor and Herlocker, 2001) consists
in using the Average link clustering algorithm to
group items into clusters based on the similarity
matrix. The dynamic clustering-based CF (so-called
D.cluster) (Hamzaoui et al., 2012) included a time
weight parameter in item-item similarity measure
to penalize the impact of historical data and then
take into account the dynamics of the active user’s
purchase habits. The timeSVD++ (Yehuda, 2009)
refers to the time-sensitive algorithm that considers
temporal information beyond the rating matrix by
introducing time-variant biases for each user and
each item. The idea is to decay the weight of the
user’s old ratings to have no effect on his status at the
current time.
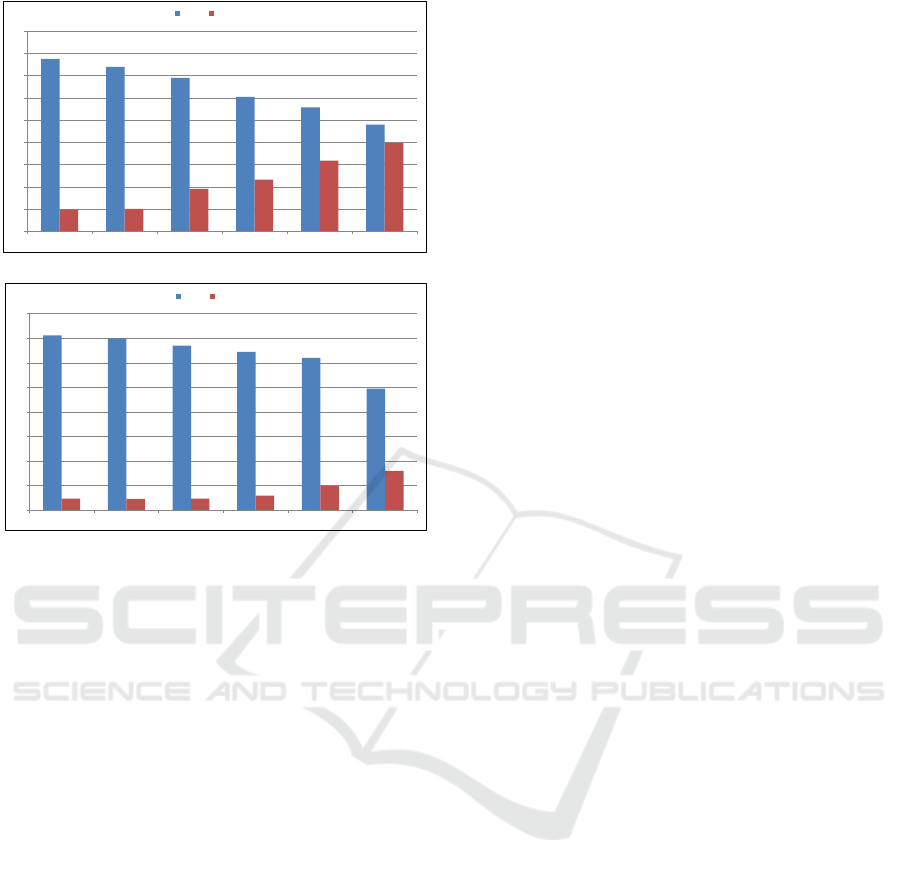
Figure 7 displays the prediction accuracy results
over the state-of-the-art recommendation methods.
First, the prediction quality of S.cluster is un-
surprisingly worse than item-based CF as stated by
the literature (O’Connor and Herlocker, 2001). For
instance, applied to the MovieLens data set, the
clustering-based approach yields an MAE of 0.77
0
0,1
0,2
0,3
0,4
0,5
0,6
0,7
0,8
Adjusted Tanimoto Pearson Cosine Likelihood
MAE F-measure
(a) MovieLens data set.
0
0,2
0,4
0,6
0,8
1
1,2
Adjusted Tanimoto Pearson Cosine Likelihood
MAE F-measure
(b) Video Games data set.
Figure 6: Sensitivity of similarity measures.
Table 5: State-of-the-art methods.
Name
Overlapping Time Method
item-based No No KNN
S.community Yes No Louvain
S.cluster No No Average link
D.cluster No Yes K-means
TimeSVD++ No Yes −
and the item-based CF yields an MAE of 0.739.
Moreover, applied to the Video Games data set, the
clustering-based approach gives a higher MAE (i.e.,
1.42) and thus a lower accuracy compared to the ba-
sic item-based (i.e., 1.39). The decrease in accuracy
could be due to the fact that the clustering algorithms
group items to be exclusively in one cluster. However,
certain items may have significant predictive value
for multiple clusters. Subsequently, the predictions
computed using a static and overlapping community
detection approach (S.community) are more accurate
than the basic item-based. This is explained by the
fact that the overlapping aspect of the items subgroups
(i.e., an item may be a member of more than one
community) may reveal interesting neighbors selec-
tion (i.e., containing similar items with different pop-
ularity and preferences). It can also be observed from
Figure 7) that the D.cluster, in both data sets, provides
a better quality of prediction compared to both item-
based and S.community because it considers the tem-
poral information of users’ preferences when com-
ICAART 2023 - 15th International Conference on Agents and Artificial Intelligence
134
0
0,1
0,2
0,3
0,4
0,5
0,6
0,7
0,8
0,9
S.cluster item-based S.community D.cluster TimeSVD++ DO2CF
MAE F-measure
(a) MovieLens data set.
0
0,2
0,4
0,6
0,8
1
1,2
1,4
1,6
S.cluster item-based S.community D.cluster TimeSVD++ DO2CF
MAE F-measure
(b) Video Games data set.
Figure 7: The performance of the state-of-the-art recom-
mendation algorithms.
puting the similarity between items (i.e., by penaliz-
ing the impact of old rating data and highlighting the
recent data rating). However, the time-sensitive al-
gorithm TimeSVD++ performs better than D.cluster
since it considers the temporal dimension in a large
space (i.e., not only when computing the similarity).
Finally, the proposed framework for overlapping and
dynamic community-based CF (DO2CF) has a lower
MAE value (i.e., 0.48 in MovieLens and 0.99 in the
Video games data set) compared to D.cluster, and this
meant that it yields the best recommendation accu-
racy in comparison to all the other CF methods. This
is justified by the fact that by considering both the
temporal changes in users’ interests and the overlap-
ping aspect of items, the detected communities can
better reveal the items that represent the most recent
related neighbors. Accordingly, the quality of the
community structure has an impact on recommenda-
tion accuracy. Furthermore, DO2CF performs better
than TimeSVD++ since the latter aims to capture tem-
poral effects by incorporating a time-variant bias for
each user and item at every time window. Indeed,
TimeSVD++ cannot track the underlying pattern for
different biases of time windows.
5 CONCLUSIONS
In this paper, we propose a new framework for dy-
namic and overlapping community-based CF that al-
lows (i) modeling the dynamic aspect of users’ pref-
erences in a recommender system into a dynamic
network, (ii) identifying dynamic and overlapping
groups of items using a community-detection algo-
rithm, and (iii) providing a diverse recommenda-
tion list that could match the current users’ tastes.
Through this work, we highlight that by consider-
ing the network topology changes and the overlap-
ping membership of items, the detected communities
are more significant and appropriate. Consequently,
a considerable impact on the recommendations’ qual-
ity is envisaged depending on the type of community
detection algorithm. In addition to the recommenda-
tion accuracy improvement, the experimental results
for both MovieLens and Video Games data sets indi-
cate that (DO2CF) can scale with large data and ad-
dress sparsity.
REFERENCES
Abrouk, L., Gross-Amblard, D., and Cullot, N. (2010).
Community detection in the collaborative web. Inter-
national Journal of Managing Information Technol-
ogy (IJMIT), 2(4).
Aston, N., Hertzler, J., and Hu, W. (2014). Overlapping
community detection in dynamic networks. Journal
of Software Engineering and Applications, 7(10):872–
882.
Cazabet, R. and Amblard, F. (2011). Simulate to detect:
a multi-agent system for community detection. 2011
IEEE/WIC/ACM International Conference on Web In-
telligence and Intelligent Agent Technology (WI-IAT),
2:402–408.
Chena, M. and Liu, P. (2017). Performance evaluation of
recommender systems. International Journal of Per-
formability Engineering, 13(8):1246–1256.
Deng, W., Patil, R., Najjar, L., Shi, Y., and Chen, Z. (2014).
Incorporating community detection and clustering
techniques into collaborative filtering model. The 2nd
International Conference on Information Technology
and Quantitative Management (ITQM’14), 31:66–74.
Fatemi, M. and Tokarchuk, L. (2013). A community
based social recommender system for individuals and
groups. 2013 International Conference on Social
Computing (SocialCom), pages 351–356.
Fortunato, S. (2010). Community detection in graphs.
Physics reports, 486(3):75–174.
Guo, L. and Peng, Q. (2014). A neighbor selection method
based on network community detection for collabo-
rative filtering. the 13th International Conference on
Computer and Information Science (ICIS’14), (143-
146).
A New Dynamic Community-Based Recommender System
135

Hamzaoui, N., Sedqui, A., and Lyhyaoui, A. (2012). Multi-
criteria collaborative recommender. International
journal of computational linguistics research, 3(3).
Newman, M. E. J. and Girvan, M. (2004). Finding and eval-
uating community structure in networks. Phisical re-
view E, 69(2).
Nguyen, N. P., Dinh, T. N., Tokala, S., and Thai, M.
(2011). Overlapping communities in dynamic net-
works: Their detection and mobile applications. Pro-
ceedings of the 17th annual international conference
on Mobile computing and networking, pages 85–96.
O’Connor, M. and Herlocker, J. (2001). Clustering items for
collaborative filtering. Proceedings of the ACM SIGIR
Workshop on Recommender Systems: Algorithms and
Evaluation.
Palla, G., Farkas, I., and Vicsek, T. (2005). Uncovering
the overlapping community structure of complex net-
works in nature and society. Nature, pages 814–818.
Qiang, H. and Yan, G. (2012). A method of personalized
recommendation based on multi-label propagation for
overlapping community detection. the 3rd Interna-
tional Conference on System Science Engineering De-
sign and Manufacturing Informatization, 1:360–364.
Qin, S., Menezes, R., and Silaghi, M. (2010). A recom-
mender system for youtube based on its network of
reviewers. the IEEE International Conference on So-
cial Computing, pages 323–328.
Sahebi, S. and Cohen, W. (2011). Community-based rec-
ommendations: a solution to the cold start problem.
Workshop on Recommender Systems and the Social
Web (RSWEB).
Sarwar, B. M., Karypis, G., Konstan, J., and Riedl, J.
(2001). Item-based collaborative filtering recommen-
dation algorithms. the 10th international conference
on world wide web (www’01).
Sarwar, B. M., Karypis, G., Konstan, J., and Riedl, J.
(2002). Recommender systems for large-scale e-
commerce: Scalable neighborhood formation using
clustering. Proceedings of the 5th International Con-
ference on Computer and Information Technology
(ICCIT).
Vlachos, M., Fusco, F., Mavroforakis, C., Kyrillidis, A. T.,
and Vassiliadis, V. G. (2014). Improving co-cluster
quality with application to product recommendations.
Proc. CIKM, pages 679–688.
Xie, J., Chen, M., and Szymanski, B. K. (2013). Label-
rankt: Incremental community detection in dynamic
networks via label propagation. CoRR.
Xin, L., Haihong, E., Junde, S., Meina, S., and Junjie, T.
(2014). Book recommendation based on community
detection. Pervasive Computing and the Networked
World, pages 364–373.
Yehuda, K. (2009). Collaborative filtering with temporal
dynamics. Proceedings of the 15th ACM SIGKDD In-
ternational Conference on Knowledge Discovery and
Datamining, pages 447–456.
Yin, B., Yang, Y., and Liu, W. (2014). Exploring social
activeness and dynamic interest in community-based
recommendation system. Proceedings of the 23rd
International Conference on World Wide Web, pages
771–776.
Ying, J.-C., Shi, B.-N., Tseng, V., Tsai, H.-W., Cheng,
K. H., and Lin, S.-C. (2013). Preference-aware com-
munity detection for item recommendation. 2013
Conference on Technologies and Applications of Ar-
tificial Intelligence (TAAI), pages 49–54.
ICAART 2023 - 15th International Conference on Agents and Artificial Intelligence
136
