
Annotation-Based Evaluation of Wrist EDA Quality and Response
Assessment Techniques
E. Pattyn
1,2
, E. Lutin
1,2
, A. Van Kraaij
3
, N. Thammasan
3
, D. Tourolle
3
, I. Kosunen
3
, D. Tump
3
,
W. De Raedt
2
and C. Van Hoof
1,2,3
1
Department of Electrical Engineering, KU Leuven, Leuven, Belgium
2
Imec, Leuven, Belgium
3
OnePlanet Research Centre, Wageningen, The Netherlands
Keywords: Affective Computing, Feature Extraction, Physiology, Signal Processing Algorithms, Wearable Sensors.
Abstract: Electrodermal activity (EDA) reflects changes in electrical conductivity of the skin via activation of the
sympathetic nervous system. Ambulatory EDA measurements bring multiple challenges regarding quality
assessment and response detection. A signal quality indicator (SQI) is one method to overcome these. This
study aimed to investigate the transferability and generalizability of several open-source state-of-the-art SQIs
and response detectors regarding their performance against manually annotated EDA of participants in rest.
Three annotators identified artifacts and physiological responses in wrist EDA of 45 participants (10.75 hours).
The F1-score, precision, and recall of several state-of-the-art SQIs and response detectors were computed on
a subset of the annotated data (n=28). The SQIs and response detectors resulted in F1 scores between 3-16%
and 18-32%, respectively. These results indicated that current SQIs and response indicators are not performant
enough for EDA of subjects in rest, implying similar or worse outcomes for ambulatory EDA. It is suggested
that SQIs must be adjusted based on the used device and set-up.
1 INTRODUCTION
Electrodermal activity (EDA) refers to changes in the
electrical conductivity of the skin. When the body
responds to stress or arousal, the sympathetic nervous
system activates the sweat glands, causing an increase
in EDA. EDA derived features can improve mental
health by enhancing wearable data insights. EDA can
be decomposed into tonic and phasic components.
The tonic component varies slowly and is referred to
as Skin Conductance Level (SCL). The phasic
component represents rapid responses following a
stimulus and is referred to as Skin Conductance
Response (SCR) (Boucsein, 2012).
Measurements of EDA via wearables bring
multiple challenges. First, measurements in daily life
favour wrist measurements, which imply lower SCL
and smaller SCRs compared to finger measurements
(van Dooren et al., 2012). Second, measurements
might be disrupted by loss of skin contact, movement
of the device on the skin, or local pressure. Last, SC
responses might not be related to mood states but to
physical exertion or thermoregulation (Boucsein,
2012). These challenges have implications for both
signal quality assessment and response detection. In
the case of short-term experiments, researchers can
locate and remove artifacts or annotate the responses
manually (Doberenz et al., 2011). However, in the
case of long-term data, this is too time-consuming,
thus automatic removal of artifacts and response
detection are needed. New methods have been
developed for this purpose.
1.1 Artifact Handling
There are two main artifact handling approaches. The
first one is artifact reduction in which filtering is the
most adopted technique. Low-pass filtering is often
used to remove rapid changes in the signal (Healey et
al., 2000; Gashi et al., 2020). The main disadvantage
of filtering is that it can potentially distort the true
EDA. More recently, new techniques have been
explored such as sparse recovery (Kelsey et al., 2018)
and wavelet-based motion artifact removal (Shukla et
al., 2018) but these techniques are not yet
systematically implemented.
Another approach is artifact labelling by
formulating a signal quality indicator (SQI), which
calculates a quality score for a segment of the signal
186
Pattyn, E., Lutin, E., Van Kraaij, A., Thammasan, N., Tourolle, D., Kosunen, I., Tump, D., De Raedt, W. and Van Hoof, C.
Annotation-Based Evaluation of Wrist EDA Quality and Response Assessment Techniques.
DOI: 10.5220/0011640800003414
In Proceedings of the 16th International Joint Conference on Biomedical Engineering Systems and Technologies (BIOSTEC 2023) - Volume 4: BIOSIGNALS, pages 186-194
ISBN: 978-989-758-631-6; ISSN: 2184-4305
Copyright
c
2023 by SCITEPRESS – Science and Technology Publications, Lda. Under CC license (CC BY-NC-ND 4.0)

to remove the bad quality segments during analysis.
Recently, EDA SQI research has focused on rule-
based techniques and machine learning approaches.
Taylor et al. (2015), for example, converted their
classifier (binary: ‘good or bad quality’ or multiclass:
‘good, bad, or questionable quality’) into a freely
available web-based tool, called EDAexplorer, which
has been widely adopted in EDA research. More
recently, Gashi et al. (2020) published EDArtifact, a
freely available repository for artifact detection.
1.2 Response Handling
Most response detection algorithms attempt to
remove the SCL from the EDA to retrieve the SCR.
Previously, this was done by signal differentiation, as
this eliminates constant components. In Healey et al.
(2000), for example, responses are registered when
the derivative of the EDA crosses a threshold. Kim et
al. (2004) added an additional step, i.e., convolution
with a Bartlett window, before differentiation.
In parallel to these differentiation-based methods,
more complex decomposition of EDA into its tonic
and phasic components was investigated to solve the
problem of overlapping responses. Benedek and
Kaernbach (2010), for example, published a
decomposition tool called Ledalab whereas Greco et
al. (2016) introduced cvxEDA, a variation which uses
convex optimization.
Regarding response detection following
decomposition, multiple solutions have been
proposed. Ledalab includes its own response
detection method, whereas cvxEDA has been used in
combination with external response detectors.
Multiple open-source toolkits provide the latter
option including NeuroKit2 (Makowski et al., 2021).
However, these toolboxes rarely provide a full
pipeline from quality control to response detection.
1.3 Objectives
This study aims to investigate the performance of
several open-source or well-described state-of-the-art
SQIs and response detectors against manual
annotations in an independent dataset of EDA
collected with dry-electrodes at the wrist in a
controlled set-up. The algorithms will be tested
without adaptations or retraining to investigate their
generalizability to new datasets. As algorithms
performing poorly on data collected in controlled
settings are unlikely to perform well in ambulatory
settings, the comparison of these algorithms serves as
a first step in the development of a pipeline that
combines artifact and response detection for
ambulatory EDA.
2 METHODS
2.1 Data Collection
Physiological data from a previously collected trial
were analysed. This dataset was collected at the
Lowlands festival in 2019 by imec and contains data
from 132 participants (mean age: 28 years, std: 8
years, 52% women). Before the study, the medical
ethical committee of the Maxima Medical Centre
reviewed it and decided that it does not need ethical
approval. Participants were asked to do different tests
whilst wearing several sensors including the Biopac
MP160 (on two fingers) and two Chill+ wristbands
(one on each wrist). The latter is a non-commercial
wearable developed by imec for research purpose.
All participants completed an informed consent
before participation. An overview of the protocol is
shown in Table A.1 (Appendix). In this analysis, the
following physiological signals were included: EDA,
accelerometery (ACC), and temperature from the left
Chill+ wristband, EDA from the right Chill+, and
EDA from the Biopac attached to two fingers of the
left hand. The EDA (µS) of the Chill+ was captured
using two flat Ag-AgCl electrodes of 11 mm diameter
at 256 Hz. The EDA captured by Biopac MP160 at
256 Hz was used as reference EDA (Appendix Figure
A.1).
2.2 Pre-Processing
87 out of the 132 participants were excluded from the
analysis because of various reasons: 1) one of the two
Biopac systems was wrongly calibrated, 2)
participant drop out or abnormal behaviour, 3)
temperature baseline issues, 4) EDA baseline issues
or EDA consisted only of noise, 5) synchronization
issues between the Biopac and the wristband, 6) the
EDA electrodes were detached during the trial, and 7)
crashing of the math test Python program caused by
invalid user input. The data of the remaining 45
participants (mean age of 27 years, std: 7 years, 45%
women), were analysed. All the physiological signals
were resampled from 256 Hz to 8 Hz.
2.3 Annotation
The downsampled EDA of the left Chill+ of all
included participants (n=45, 10.75 hours in total) was
annotated by three annotators separately (having 2-5
Annotation-Based Evaluation of Wrist EDA Quality and Response Assessment Techniques
187

years of experience in the EDA field) using PALMS
software (Fedjajevs et al., 2020). All annotators
followed pre-set annotation guidelines that were
developed using a combination of published
guidelines and empirical experience (Boucsein, 2012;
Taylor et al., 2015) (details available upon request).
During annotation, the following information was
available: 1) the EDA from the Biopac, 2) the EDA
from the left Chill+, 3) the driver from the left Chill+
(derived from Ledalab deconvolution), 4) the ACC
(x, y, and z) signals from the left Chill+, and 5) the
standard deviation of the ACC magnitude from the
left Chill+. In addition to these signals, an initial set
of responses was provided by the SciPy 1.6.3 ‘find
peaks’ function, using personalized statistics for
minimal response height, minimal response
prominence, and minimal response distance.
During annotation, artifacts were labelled as
‘artifact’ with boundaries as perceived by the
annotator. Additionally, longer noise-like periods
without responses were given a ‘responseless period’
annotation. Then, in the non-artifact segments, EDA
responses were adjusted by evaluation of the
automatic EDA response detection. Any uncertainties
regarding the adjustment of an EDA response were
marked with a ‘doubt’ partition. These ‘doubt’
responses reflected EDA responses that the
annotators could not label with certainty or that did
not comply with the pre-set guidelines.
The resulting annotations were aligned into the
median value if artifact boundaries, between
annotators, differed less than one second. For the
response annotations, the correction window was 0.5
seconds. Subjects that contained more than 90%
artifact or ‘responseless period’ partitions were
removed prior to further analysis (n=17) as these
subjects complicated the comparison of different
state-of-the-art SQIs and SCR detectors. Also, some
SQIs did not provide output for these ‘responseless
periods’ (Gashi et al., 2020). The aligned annotations
were assessed in terms of agreement by calculating
the Cohen’s kappa and the percentage of agreement
per annotator pair in 5-second windows for every
participant and averaging these results afterwards.
2.4 Quality Assessment
A ground-truth signal was created by merging the
artifact annotations for every time point in the
following manner: if all three annotators labelled this
time point as clean, the merged annotation received
‘clean’ (or good), if two or more annotators labelled
this time point as an artifact, the merged annotation
received ‘artifact’, and if only one annotator labelled
this time point as an artifact the merged annotation
received ‘questionable’. This allowed for two
analyses: where questionable was considered as clean
(‘Questionable as good’, QasG) or artifact
(‘Questionable as bad’, QasB), respectively. The
ground truth artifact signal was used to compare
several state-of-the-art quality or well-described
indicators in terms of F1, precision, and recall scores.
More specifically EDAexplorer, as designed by
Taylor et al. (2015), the one made by Kocielnik et al.
(2013) implemented by Smets et al. (2018), the one
designed by Kleckner et al. (2018), and EDArtifact
by Gashi et al. (2020). Because several state-of-the-
art SQIs classify artifacts in 5-second windows
(Gashi et al., 2020; Taylor et al., 2015), all results
were reported in 5-second windows, so they could be
optimally compared. Thus, the SQIs of Kleckner
(2018) et al., Kocielnik et al. (2013), and the ground
truth annotated artifact signal (reported quality per
sample) were resampled to 5 seconds by classifying
the window as ‘artifact’ if at least 10% of the window
was labelled as an artifact.
Bad quality segments, as detected by the SQIs,
were evaluated according to their detection (correct,
incorrect, or missed) regarding characteristics such as
the EDA baseline, the duration, the EDA range, and
the ACC magnitude during the co-occurring
annotated artifact. For this analysis questionable
artifacts were removed. If a SQI indicated at least one
bad quality label within an annotated artifact, the
artifact was labelled as ‘correct’, if not, it got
‘missed’. When a segment was labelled as bad quality
by a SQI, but all three annotators annotated it as good,
it got ‘incorrect’. In case of ‘correct’ and ‘missed’
artifacts, the boundaries of the annotated artifacts (per
sample) were used to compute artifact characteristics
as this was relevant for duration. Otherwise, for
incorrectly detected artifacts, the boundaries of the
artifact, as suggested by the SQI, were used (in a 5-
second window or per sample depending on the SQI).
The three different detection categories were assessed
per characteristic (e.g. EDA baseline) for significant
differences using a Kruskal-Wallis test, followed by
Dunn’s test in case of significant results. Whenever
there were only two categories available, a Mann-
Whitney U test was used.
2.5 Response Assessment
For the creation of the merged response annotated
signal, also the artifact and doubt periods were
considered. For each response that was annotated by
at least one of the annotators, three measures were
examined to determine if this response would be
BIOSIGNALS 2023 - 16th International Conference on Bio-inspired Systems and Signal Processing
188

included in the merged signal: the number of
annotators that marked this timepoint 1) within an
artifact partition, 2) within a doubt partition, and 3) as
‘responseless’. If the sum of the number of marked
responses and the number of non-artifact partitions
(doubt or ‘responseless’) was higher than the number
of artifact partitions, the response was included in the
merged signal.
Several state-of-the-art response detection
algorithms were compared with the annotated ground
truth responses in terms of F1, precision, and recall.
More specifically, the one made by Healey et al.
(2000) implemented by Smets et al. (2018), the
Ledalab response detector made by Benedek and
Kaernbach (2010), the EDAexplorer response
detector by Taylor et al. (2015), and the one from Kim
et al. (2004). The same response detection algorithms
were applied to the phasic signal (computed using
Ledalab with the parameters set to the default values),
combined with the responses of the impulse signal
automatically detected by Ledalab.
Several response characteristics such as the
baseline, rise time (the duration, in seconds, between
the beginning of the response and the maximum of
the response), and amplitude (the difference in µS
between the maximum and minimum of the
response), were compared between correctly
detected, incorrectly detected, and missed responses
for each algorithm using the merged annotations as
ground truth.
3 RESULTS
3.1 Quality Assessment
Annotations of artifacts resulted in an overall
moderate Cohen’s kappa of 0.45 (std: 0.22) and
acceptable agreement of 88.4% (std: 5.7%). The
merged artifact signal (n=28) contains a total of 21
mins of annotated artifacts (>2 annotators, 373
segments), 32 mins of questionable sections (1
annotator, 222 additional segments), and 334 mins of
clean data (0 annotators). Table 1 shows the F1,
precision, and recall scores of the used state-of-the-
art SQIs against the annotated artifacts for QasG and
QasB. The SQIs of Kocielnik et al. and Kleckner et
al. have high precision (~0.75) as they find only a few
subjects with artifacts. Moreover, in those subjects,
these SQIs detect only a few artifacts, which can be
seen from their low recall rate (~0.03), and results in
low F1 scores (~0.03). Taylor et al. (F1: 0.12) seems
to slightly outperform the SQI of Gashi et al. (F1:
0.10) if QasG, whereas Gashi et al. (F1: 0.16)
outperforms Taylor et al. (F1: 0.07) more confidently
if QasB. Generally, the recall rate goes down and the
precision goes up if questionable artefacts are added
(QasA instead of QasG). Thus, the increase of
successful artifact detection (true positives increase,
false positives decrease) is much smaller than the
additional mistakes (true negatives decrease, false
negatives increase) with the smallest effect observed
for the SQI of Gashi et al.
All SQIs miss a substantial number of artifacts
(75% - 99%) of the 373 annotated artifacts used in
this analysis (Table 2). As the SQI of Kleckner et al.
detects only four artifacts correctly, the comparison
of artifact characteristics is mostly insignificant and
irrelevant. The SQI of Gashi et al. misses the least
artifacts (280), though it has a high number of
incorrectly detected artifacts (163), which was
already apparent from the relatively high recall and
low precision of Table 1. Table 2 shows some clear
trends that are present for all SQIs. In general, all
SQIs miss artifacts that are small in range (0.01µS)
and short in duration (~2s), without any significant
differences in ACC magnitude (~1.02g) between the
detection categories. Only for the SQI of Gashi et al.,
the missed (2.1s) and correct (2.4s) artifacts do not
differ significantly regarding duration. The incorrect
Table 1: Quality indicator performance scores compared to annotations (mean ± std).
Per 5s window QasG (n=28) QasB (n=28)
Subjects with
no artifact*
F1 Precision Recall F1 Precision Recall N (%)
Kocielnik 0.05
(±0.09)
0.72
(±0.43)
0.03
(±0.05)
0.03
(±0.06)
0.75
(±0.43)
0.02
(±0.04)
17
(60.7%)
Kleckner 0.03
(±0.16)
0.75
(±0.35)
0.03
(±0.14)
0.03
(±0.15)
1.00
(±0.00)
0.02
(±0.12)
26
(92.9%)
Taylor 0.12
(±0.15)
0.49
(±0.46)
0.09
(±0.13)
0.07
(±0.10)
0.57
(±0.46)
0.04
(±0.08)
0
(0.0%)
Gashi 0.10
(±0.19)
0.19
(±0.30)
0.15
(±0.23)
0.16
(±0.18)
0.39
(±0.32)
0.16
(±0.20)
6
(21.4%)
*
These subjects are similar for QasG and QasB
Annotation-Based Evaluation of Wrist EDA Quality and Response Assessment Techniques
189

Table 2: Comparison of characteristics of artifacts with respect to SQIs (n=28).
Annotations
A. Missed
B. Incorrect
C. Correct
Kleckner
Kocielnik
Taylor
Gashi
Kleckner
Kocielnik
Taylor
Gashi
Kleckner
Kocielnik
Taylor
Gashi
Total number of artifacts
(sum)
373 369 351 351 280 0 9 1 163 4 22 22 93
ACC magnitude (g)
(median ± iqr)
1.02
±0.01
1.02
*a
± 0.01
1.02
± 0.01
1.02
± 0.01
1.02
± 0.02
/
1.03
± 0.02
1.01
1.02
± 0.01
1.00
*a
± 0.00
1.02
± 0.02
1.03
± 0.01
1.02
± 0.01
Baseline of artifacts (µS)
(median ± iqr)
0.79
± 3.12
0.80
*a
± 3.14
0.80
*c
± 3.24
0.73
*a
± 3.10
0.63
*b
± 2.24
/
1.14
*c
± 0.81
1.90
*
3.36
*b
± 4.50
0.05
*a
± 0.00
0.11
*c
± 0.93
2.20
*a
± 3.83
3.32
*b
± 8.01
Duration of artifacts (s)
(median ± iqr)
2.25
± 2.88
2.12
± 2.88
2.00
*b
± 2.56
2.00
*a
± 2.56
2.06
*d
± 3.00
/
0.38
*b
± 0.50
5.00
*
5.00
*d
± 5.00
2.81
± 0.56
3.62
*b
± 3.09
3.00
*a
± 2.59
2.38
*d
± 2.12
Range of artifacts (µS)
(median ± iqr)
0.01
± 0.04
0.01
± 0.04
0.01
*a
± 0.04
0.01
*a
± 0.03
0.01
*b
± 0.02
/
0.04
*
± 0.27
0.72
*
0.20
*
± 0.25
0.01
± 0.01
0.05
*a
± 0.18
0.29
*a
± 0.22
0.08
*b
± 0.17
*
: Significant with p < 0.05 (Kruskal-Wallis),
a
: A↔ C,
b
: A ↔ C, B,
c
: A, B, C,
d
: B ↔ A, C (post-hoc Dunn)
artifacts are significantly longer with a median value
of 5s, caused by the 5s-window defined SQIs since
the boundaries as suggested by the SQI were used (as
explained in section 2.4). For Taylor et al. and Gashi
et al., the missed category has a significantly lower
baseline than correct and incorrect (if present) ones
whereas for other classifiers, the missed category has
a significantly higher baseline (0.80μS) than the
correctly detected artifacts (~0.1μS).
3.2 Response Assessment
Annotations of responses resulted in an overall
moderate Cohen’s kappa of 0.55 (std: 0.21) and good
agreement of 99.1% (std: 0.6%). The merged
response signal contains 2071 annotated responses of
which 309 lay in doubt partitions (n=28). The F1,
precision, and recall scores of several state-of-the-art
response detectors were calculated regarding the
annotated responses and are shown in Table 3.
The best scoring response identifiers are Kim et
al., Ledalab, and Taylor et al. on the phasic signal.
The relatively high F1 score for Ledalab (0.27) comes
from a high recall rate (0.83), whereas the F1 scores
for Taylor et al. and Healey et al. (~0.2) come from
high precision rates (~0.86). For all the response
detectors, the performance on the phasic signal is
slightly better. The F1, recall, and precision scores for
the response detection algorithms are higher than
those for the SQI detection algorithms but remain
rather low.
Table 3: Response detectors performance scores compared
to annotations (mean ± std).
Per sample (n=28) F1 Precision Recall
Ledalab On EDA 0.27
(±0.13)
0.17
(±0.1)
0.83
(±0.19)
On (phasic)
impulse
0.29
(±0.14)
0.18
(±0.11)
0.89
(±0.20)
Taylor On EDA 0.24
(±0.20)
0.90
(±0.22)
0.16
(±0.14)
p
hasic 0.25
(±0.21)
0.87
(±0.23)
0.17
(±0.15)
Kim On EDA 0.29
(±0.19)
0.49
(±0.26)
0.23
(±0.15)
p
hasic 0.32
(±0.20)
0.52
(±0.28)
0.26
(±0.20)
Healey On EDA 0.18
(±0.20)
0.83
(±0.26)
0.12
(±0.14)
p
hasic 0.19
(±0.20)
0.83
(±0.21)
0.12
(±0.14)
Table 4 shows that Ledalab has the highest
number of correctly detected responses (87%)
compared to the other peak detectors (22-37%).
Furthermore, it is the only one that labels more
incorrect responses (9273) than correct ones (1793),
but also the only one that misses fewer responses
(278) than it has correctly found ones. In general, all
the response detectors miss responses that have
significantly smaller amplitudes (~0.01µS), shorter
rise times, and lower baselines than the correctly
BIOSIGNALS 2023 - 16th International Conference on Bio-inspired Systems and Signal Processing
190

Table 4: Comparison of characteristics of response with respect to response detection algorithms (n=28).
Annotations
A. Missed B. Incorrect C. Correct
Ledalab
Taylor
Kim
Healey
Ledalab
Taylor
Kim
Healey
Ledalab
Taylor
Kim
Healey
Total number of
responses (#)
(
sum
)
2071 278 1621 1312 1543 9273 23 654 82 1793 450 759 528
Baseline of
responses (µS)
(median ± iqr)
3.20
± 5.40
2.11
*a
± 4.82
2.78
*b
± 5.06
3.04
*a
± 5.18
2.71
*b
± 4.79
2.62
*a
± 4.55
6.76
*b
± 7.68
1.25
*a
± 3.16
4.88
*b
± 7.74
3.30
*a
± 6.00
3.64
*b
± 7.17
3.33
*a
± 6.47
4.41
*b
± 8.07
Rise time of
responses (s)
(median ± iqr)
1.50
± 1.25
0.88
*a
± 0.88
1.25
*b
± 1.12
1.25
*a
± 1.50
1.38
*c
± 1.25
0.75
*a
± 0.75
1.88
*b
± 1.25
1.25
*a
± 1.12
1.00
*c
± 1.12
1.62
*a
± 1.25
2.12
*b
± 1.00
1.75
*a
± 0.75
1.88
*c
± 1.12
Amplitude of
responses (µS)
(
median ± i
q
r
)
0.02
± 0.09
0.00
*a
± 0.02
0.01
*b
± 0.04
0.01
*a
± 0.03
0.01
*a
± 0.03
0.00
*a
± 0.01
0.24
*b
± 0.23
0.01
*a
± 0.07
0.10
*a
± 0.24
0.03
*a
± 0.11
0.15
*b
± 0.18
0.08
*a
± 0.17
0.15
*a
± 0.18
*
: Significant with p < 0.05 (Kruskal-Wallis),
a
: A, B, C,
b
: A ↔ C, B,
c
: C ↔ A, B (post-hoc Dunn)
identified responses (~3.5µS). The trends for the
incorrect category are less generalizable. Taylor et al.
detects only a few incorrect responses (23), which did
not differ significantly from the correctly detected
responses (450) for all response characteristics.
Ledalab and Kim et al., on the contrary, detect larger
amounts of incorrect responses, which are
significantly different from both the missed and
correctly detected responses for all response
characteristics and have significantly shorter rise
times. However, in Ledalab, the incorrect responses
are further characterized by low amplitudes (0.00µS)
and an intermediate baseline (2.62µS), whereas in
Kim et al., they are characterized by intermediate
amplitudes (0.01µS) and low baselines (1.25µS).
Lastly, the incorrect responses of Healey et al. have
high baselines comparable (4.88µS) to the correct
responses (4.41µS), short rise times (1s) comparable
to the missed responses (1.38s), and intermediate
amplitudes (0.10µS), different from both the missed
(0.01µS) and the correct responses (0.15µS).
4 DISCUSSION
In this study, the performance of several open-source
or well-described state-of-the-art SQIs and response
detectors on EDA was evaluated using manually
annotated data from 28 persons (final sample size
defined as explained at the end of section 2.3).
Generally, poor performances were found. Several
possible explanations and implications for future
pipelines will be discussed below.
The average Cohen’s kappa between quality
annotations of the three annotators (0.45) is lower
than reported in Taylor et al. (0.55, 2 annotators,
questionable epochs as third class, annotators were
allowed to skip epochs, 17% of epochs skipped),
Gashi et al. (0.84, 2 annotators, questionable epochs
relabelled as mutually agreed), and Kleckner et al.
(0.87, 5 annotators, the confidence level was ignored
when making ground-truth). The agreement between
the annotators (88%) is higher than in Taylor et al.
(81%) but lower than in Gashi et al. (97%), and
Kleckner et al. (98%). In this work, questionable or
low confidence epochs were not reannotated, ignored,
or skipped, which may contribute to the relatively low
Cohen’s kappa. Annotations of responses resulted in
an overall moderate Cohen’s kappa of 0.55 and a
good agreement of 99.1%. The used state-of-the-art
response detectors do not report any measures
regarding validation against (manual) annotations.
The low observed performance for all the SQIs,
all trained on dry electrode wrist EDA, differs
substantially from the originally reported ones
(Kleckner et al.: 92% accuracy, Gashi et al.: F1 of
97%, Taylor et al. 96% accuracy). There are multiple
possible explanations for this discrepancy. First, any
distortion of the signal was annotated independently
from the length or range, which resulted in a lot of
short and small artifacts (Table 2). On the contrary,
Gashi et al. and Taylor et al. worked with 5-second
epochs (of which the reason is not explained).
Second, there was a high imbalance between clean
(366 mins) and artifact annotations (21 mins, 5%),
which is partially caused by the seated set-up of the
trial (in Taylor et al.: 39%, Kleckner et al.: 21%,
Gashi et al.: unknown). Kleckner et al. reported
results for the clean class as the positive case which
positively affects their accuracy, in contrary to this
Annotation-Based Evaluation of Wrist EDA Quality and Response Assessment Techniques
191

work. Finally, the state-of-the-art algorithms were not
optimized or retrained for the dataset or the device
because the goal was to compare the performance of
the original algorithms on new independent data.
Gashi et al. did retrain Taylor et al. on their own data,
which increased the F1 score from 25% to 93% and
the accuracy from 46% to 95%. This poor
generalizability was explained by Gashi et al. by the
lack of ambulatory data in the training phase of
Taylor et al. Nevertheless, Gashi et al. did not test the
transferability of their own model to other datasets
(controlled nor ambulatory). In this study, we show
that even models trained on ambulatory data can
show poor performance. Possible reasons for this,
besides the original set-up, might be the large effect
of personal variables (e.g., age, gender), contextual
variables (e.g., humidity), and the used device
(Boucsein et al., 2012). The high variability within
EDA precludes the use of fixed thresholds, e.g., on
the maximum or minimum slope, which are present
in all the state-of-the-art SQIs. Possible solutions
involve retraining the algorithm for the specific
dataset or the formulation of specific restrictions on
compatible devices, EDA ranges, or environmental
conditions for using the SQIs. Only Kleckner et al.
(2018) report that their algorithm should be adjusted
when applied to another study design or device.
Generally, all response detection algorithms
perform poorly in comparison to the annotations.
Taylor et al. and Healey et al. show good agreement,
but low recall compared to the annotations. Both
methods struggle with the detection of low amplitude
peaks within low baseline signals. An explanation
might be the default restrictions on the peak
amplitude of these methods. In literature, the minimal
amplitude for a response is defined as 0.1 µS
(Dawson et al., 2017) or 0.05 µS (Boucsein, 2012),
mostly based on the finger or palmar EDA, though
wrist EDA is known to give smaller responses up to
0.01µS (van Dooren et al., 2012). Ledalab is the only
method that detected more responses than were
annotated. This tendency to over-detect has been
reported before (Lutin et al., 2021). The incorrect
responses are especially characterized by their low
amplitude which suggests that the performance could
be improved by applying an additional restriction.
The different response detection algorithms were
trained on EDA measured on the wrist (Taylor et al.),
on two fingers (Benedek & Kaernbach and Kim et al.),
on the palm (Healey et al.), or the foot (Healey et al.).
Although no threshold adaptations were implemented
to adapt the algorithms to wrist EDA, the response
detectors of Kim et al. and Benedek & Kaernbach
performed better than the one of Taylor et al.
This study was limited in terms of the relatively
small sample size of the used database and the
homogeneous resting conditions during the trial. In
future work, researchers should include clear
guidelines regarding algorithm transfer. Also, the
combination of SQIs with a response detector should
be investigated.
5 CONCLUSIONS
The performance scores of several open-source state-
of-the-art EDA SQIs and response detectors were
investigated using manually annotated data as ground
truth. Generally, low performance was observed for
the quality indicators and response detectors. The
quality indicator of Gashi et al. gave the highest F1
score of 16% for QasB whereas the one by Taylor et
al. gave the highest F1 score of 12% for QasG. The
response detectors gave slightly higher performance
on the phasic signal than on the EDA, with Kim et al.
having the highest F1 score of 32%. Retraining the
algorithms will most likely resolve the low-
performance scores and is advised when applying
state-of-the-art SQIs to a new set-up or device.
Generally, it is noted that the applied open-source
response detectors lack validation, therefore manual
validation or retraining of these algorithms is advised.
ACKNOWLEDGEMENTS
The authors would like to thank H. Boers, J. Bax, J.
Buil, B. Grundlehner, L. Micaroni, R. G. van der
Westen, E. Vloedgraven, and C. Zax for data
collection. E. Lutin acknowledges a Ph.D. fellowship
from the Research Foundation Flanders (1SB4719N)
and OnePlanet Research Center acknowledges
financial support from the Province of Gelderland.
This project has received funding from the European
Union’s Horizon 2020 programme (777084). This
publication reflects only the authors' view and the
European Commission is not responsible for any use
that may be made of the information it contains.
REFERENCES
Benedek, M., & Kaernbach, C. (2010). A continuous
measure of phasic electrodermal activity. Journal of
Neuroscience Methods, 190(1), 80–91. https://doi.org/
10.1016/j.jneumeth.2010.04.028
Boucsein, W. (2012). Methods of electrodermal
recording. In W. Boucsein Electrodermal Activity
BIOSIGNALS 2023 - 16th International Conference on Bio-inspired Systems and Signal Processing
192
(2nd ed.) (pp. 87-258). Springer US.
https://doi.org/10.1007/978-1-4614-1126-0
Dawson, M. E., Schell, A. M., & Filion, D. L. (2017). The
electrodermal system. In J. T. Cacioppo, L. G.
Tassinary, G. Berntson (Eds.) Handbook of
psychophysiology (pp. 217-243). Cambridge
University Press.
Doberenz, S., Roth, W. T., Wollburg, E., Maslowski, N.
I., & Kim, S. (2011). Methodological considerations
in ambulatory skin conductance monitoring.
International Journal of Psychophysiology, 80(2),
87–95.
https://doi.org/10.1016/j.ijpsycho.2011.02.002
Fedjajevs, A., Groenendaal, W., Agell, C., & Hermeling,
E. (2020). Platform for analysis and labeling of
medical time series. Sensors (Switzerland), 20(24), 1–
14. https://doi.org/10.3390/s20247302
Gashi, S., DI Lascio, E., Stancu, B., Swain, V. Das,
Mishra, V., Gjoreski, M., & Santini, S. (2020).
Detection of Artifacts in Ambulatory Electrodermal
Activity Data. ACM on Interactive, Mobile, Wearable
and Ubiquitous Technologies - Proceedings,
https://doi.org/10.1145/33 97316
Greco, A., Valenza, G., Lanata, A., Scilingo, E. P., & Citi,
L. (2016). CvxEDA: A convex optimization approach
to electrodermal activity processing. IEEE
Transactions on Biomedical Engineering, 63(4), 797–
804. https://doi.org/10.1109/TBME.2015.2474131
Healey, J. A., Picard, R. W., Smith, A. C., & Healey, J. A.
(2000). Wearable and automotive systems for affect
recognition from physiology. Massachusetts Institute
of Technology.
Kelsey, M., Akcakaya, M., Kleckner, I. R., Palumbo, R.
V., Barrett, L. F., Quigley, K. S., & Goodwin, M. S.
(2018). Applications of sparse recovery and
dictionary learning to enhance analysis of ambulatory
electrodermal activity data. Biomedical Signal
Processing and Control, 40, 58–70.
https://doi.org/10.1016/j.bspc. 2017.08.024
Kim, K. H., Bang, S. W., & Kim, S. R. (2004). Emotion
recognition system using short-term monitoring of
physiological signals. Medical and Biological
Engineering and Computing, 42(3), 419–427.
https://doi.org/10.1007/BF02344719
Kleckner, I. R., Jones, R. M., Wilder-Smith, O.,
Wormwood, J. B., Akcakaya, M., Quigley, K. S.,
Lord, C., & Goodwin, M. S. (2018). Simple,
transparent, and flexible automated quality
assessment procedures for ambulatory electrodermal
activity data. IEEE Transactions on Biomedical
Engineering, 65(7), 1460–1467.
https://doi.org/10.1109/TBME.2017.2758643
Kocielnik, R., Sidorova, N., Maggi, F. M., Ouwerkerk,
M., & Westerink, J. H. D. M. (2013). Smart
technologies for long-term stress monitoring at work.
2013 IEEE International Symposium on Computer-
Based Medical Systems - Proceedings,
https://doi.org/10.1109/CBMS. 2013.6627764
Lutin, E., Hashimoto, R., de Raedt, W., & van Hoof, C.
(2021). Feature extraction for stress detection in
electrodermal activity. 2021 Bio-Inspired Systems and
Signal Processing; Part of the 14th International
Joint Conference on Biomedical Engineering Systems
and Technologies, BIOSTEC 2021 - Proceedings,
https://doi.org/10.5220/0010244601770185
Makowski, D., Pham, T., Lau, Z. J., Brammer, J. C.,
Lespinasse, F., Pham, H., Schölzel, C., & Chen, S. H.
A. (2021). NeuroKit2: A Python toolbox for
neurophysiological signal processing. Behavior
Research Methods, 53(4), 1689–1696. https://doi.org/
10.3758/S13428-020-01516-Y
Shukla, J., Barreda-Ángeles, M., Oliver, J., & Puig, D.
(2018). Efficient wavelet-based artifact removal for
electrodermal activity in real-world applications.
Biomedical Signal Processing and Control, 42, 45–
52. https://doi.org/10.1016/j.bspc.2018.01.009
Smets, E., Rios Velazquez, E., Schiavone, G., Chakroun,
I., D’Hondt, E., De Raedt, W., Cornelis, J., Janssens,
O., Van Hoecke, S., Claes, S., Van Diest, I., & Van
Hoof, C. (2018). Large-scale wearable data reveal
digital phenotypes for daily-life stress detection. Npj
Digital Medicine, 1(1), 1–10. https://doi.org/
10.1038/s41746-018-0074-9
Taylor, S., Jaques, N., Chen, W., Fedor, S., Sano, A., &
Picard, R. (2015). Automatic identification of artifacts
in electrodermal activity data. 2015 IEEE Engineering
in Medicine and Biology Society - Proceedings,
https://doi.org/10.1109/EMBC.2015.7318762
van Dooren, M., de Vries, J. J. G. G. J., & Janssen, J. H.
(2012). Emotional sweating across the body:
comparing 16 different skin conductance
measurement locations. Physiology and Behavior,
106(2), 298–304. https://doi.org/10.1016/j.physbeh.
2012.01.020
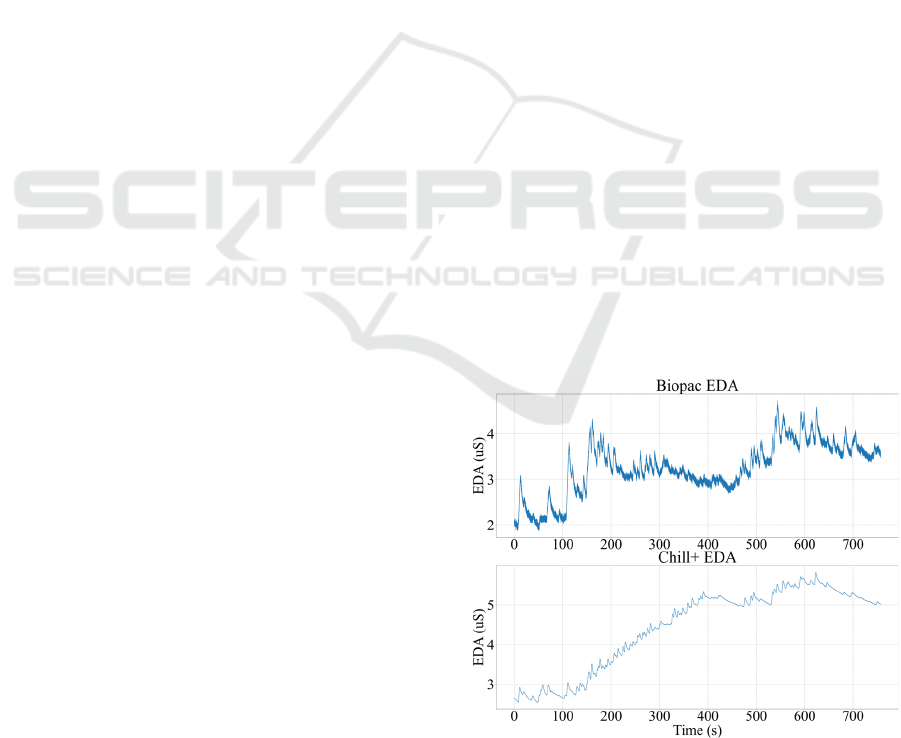
APPENDIX
Figure A.1: Plot of EDA from participant s_320.
Annotation-Based Evaluation of Wrist EDA Quality and Response Assessment Techniques
193

Table A.1: Overview of the trial procedure.
Trial procedure Description
1. Collection of
demographics
Age, sex, weight, length, and skin
colour
2. Collection of
questionnaires
Ten Item Personality index, Personal
Stress Scale
3. Application
of sensors
Chill+
1,w
(EDA, ACC, PPG, Temp,
Gyro), Biopac MP160 (ECG
c
, PPG
f
,
EDA
f
, Temp.
w
), EOG
1,e
, and EMG
2,e
4. Completion
of tests
Math, auditive stress, and cold water
(0°C) pain task in random order with
rest periods in between and VAS score
re
p
ortin
g
at fixed moments
1
: both left and right,
2
: randomly left or right
Attached to
w
: wrist,
c
: chest,
f
: finger,
e
: eye
BIOSIGNALS 2023 - 16th International Conference on Bio-inspired Systems and Signal Processing
194
