
Impact of Vehicle Speed on Traffic Signs Missed by Drivers
Farzan Heidari and Michael A. Bauer
Department of Computer Science, The University of Western Ontario, London, ON, N6A-5B7, Canada
Keywords:
Traffic Object Detection, Vehicle Speed, Driver’s Visual Attention Area.
Abstract:
A driver’s recognition of traffic signs while driving is a pivotal indicator of a driver’s attention to critical
environmental information and can be a key element in Advanced Driver Assistance Systems (ADAS). In this
study, we look at the impact of driving speed on a driver’s attention to traffic signs by considering signs missed.
We adopt a very strict definition of "missing" in this work where a sign is considered "missed" if it does not fall
under the gaze of a driver. We employ an accurate algorithm to detect traffic sign objects and then estimate the
driver’s visual attention area. By intersecting this area with objects identified as traffic signs, we can estimate
the number of missed traffic sign objects while driving at different ranges of speeds. The experimental results
show that the vehicle speed has a negative impact on drivers missing or seeing traffic sign objects.
1 INTRODUCTION
Advanced Driver Assistance Systems (ADAS) have
been widely used by different vehicle manufacturers
to try to provide enhanced environments for the safety
of drivers in different driving conditions. Evidence
has demonstrated that a considerable number of traf-
fic deaths, more than 20,000 deaths per year, can be
prevented by ADASs (National Center for Statistics
and Analysis, 2019). To achieve this goal, vehicles
must be equipped with different sensors to be able to
accurately determine the objects around the vehicle in
order to use this information to try to avoid dangerous
situations (Calvert et al., 2017).
Traffic sign detection systems can play a critical
role in improving the perception of ADASs. These
systems attempt to accurately as possible localize and
recognize traffic sign objects in different traffic envi-
ronments. Coupling this with the ability to identify
a driver’s visual attention area can provide an ADAS
with the ability to estimate which detected objects are
possibly seen or missed by the driver. Hence, when a
driver does not look at a sign on the road, the ADAS
system can warn the driver or even take necessary ac-
tions. Since vehicle speed can affect many aspects of
driving, it can also affect a driver’s attention to the
objects in the environment. Therefore, understand-
ing the impact of speed on drivers’ attention to traffic
signs can help to design a system to improve the reli-
ability and efficiency of ADAS.
In this study, we employ a real-time object
detector, YOLOV4, as a single-stage convolution
neural network for our object detection method
(Bochkovskiy et al., 2020). We then project the
driver’s gaze direction to the stereoscopic system pro-
posed by (Kowsari et al., 2014) and estimate the
driver’s visual attention area by utilizing the driver’s
attentional gaze cone. We intersect the traffic sign
objects and the driver’s visual attention area to de-
fine missed traffic sign objects. In addition, we
investigate the relationship between a driver’s pre-
attentive/attentive fixations on traffic signs and vehi-
cle speed. During pre-attentive fixations, drivers ex-
plore the surroundings to discover something, while
an attentive fixation means that a driver has focused
on a specific object. Pre-attentive fixations usually
take 150 ms to 250 ms, and attentive fixations take
longer than 250 ms (Bär et al., 2013).
The primary contribution of this study is to elu-
cidate the impact of vehicle speed on missed traf-
fic signs. We also analyze the pre-attentive/attentive
drivers’ fixations on the traffic signs at different vehi-
cle speeds in order to provide more information on the
relationship between vehicle dynamics and driver at-
tention to traffic signs. We employ an accurate object
detector to find traffic sign objects on the road, assign
an ID to each, and use the visual driver’s attentional
area to find missed traffic signs. The proposed method
is advantageous in ADAS systems it makes it possible
to identify traffic sign objects missed by drivers.
The rest of the article is structured as follows. In
section 2, we review the related literature. In section
3, the proposed method is presented. The analysis
of experimental results is explained in Section 4 and
Section 5 summarizes this paper and suggests future
work.
512
Heidari, F. and Bauer, M.
Impact of Vehicle Speed on Traffic Signs Missed by Drivers.
DOI: 10.5220/0011639700003417
In Proceedings of the 18th International Joint Conference on Computer Vision, Imaging and Computer Graphics Theory and Applications (VISIGRAPP 2023) - Volume 5: VISAPP, pages
512-519
ISBN: 978-989-758-634-7; ISSN: 2184-4321
Copyright
c
2023 by SCITEPRESS – Science and Technology Publications, Lda. Under CC license (CC BY-NC-ND 4.0)

2 RELATED WORK
Traffic object detection algorithms proposed in recent
years can be mainly classified as traditional and deep
learning (Gupta et al., 2021). We provide a summary
of the literature focusing on detecting the traffic signs
and driver’s gaze in order to identify seen or missed
traffic signs.
Traditional methods of traffic sign object detec-
tion and classification are primarily based on feature
extraction. Shao et al. (Shao et al., 2018) developed
an algorithm based on wavelets to detect traffic signs
objects. Histogram of Oriented Gradient (HOG) fea-
tures and Support Vector Machines (SVM) have been
widely used to detect traffic sign objects (Xing et al.,
2016; Salhi et al., 2017). Other approaches made use
of Local Binary Patterns (LBP) (Acharya and Nanda,
2021; Wang et al., 2009) and Adaboost (Freund and
Schapire, 1997; Lin and Wang, 2012) to detect mean-
ingful traffic sign objects. The main disadvantage of
these feature extraction-based algorithms is that they
are sensitive to lighting, shadows, obstacles, rain, and
snow in real driving situations.
In the last few years, Deep Neural Networks
(DNNs), in particular Convolutional Neural Networks
(CNN), have developed into the leading algorithms
in object detection with outstanding performance
(Sharma and Singh, 2017). Generally, Deep Neu-
ral Networks (DNN) object detectors are partitioned
into single-stage and two-stage algorithms (Liu et al.,
2020). Two-stage classifiers first generate category-
independent Regions of Interest (RoI) from images
and extract features from these regions. Then a neural
network classifier is used to put them into the different
object classes. Among the two-stage approaches, we
find Fast R-CNN (Girshick, 2015; Wang et al., 2017)
and Faster R-CNN (Ren et al., 2015; Pon et al., 2018)
are popular.
On the other hand, single-stage detectors are
regression-based algorithms that directly extract fea-
tures and predict class probabilities and locations
from images with a single network. Since the clas-
sification is performed in a single feed-forward net-
work, single-stage detectors usually classify faster
than two-stage detectors (Liu et al., 2020). One-stage
approaches mainly include Single Shot Multibox De-
tector (SSD) (Liu et al., 2016) and You Only Look
Once (YOLO) algorithms (Bochkovskiy et al., 2020).
You et al. (You et al., 2020) adopt a multiscale fea-
ture detection technique that enhanced the detection
for small targets. Also, a multi-object detection al-
gorithm based on depth learning could classify per-
sons, cars, and cyclists on an improved SSD network
(Wang et al., 2018). Different versions of YOLO are
broadly used methods based on CNN networks that
show remarkable results in (Liu et al., 2018; Zhang
et al., 2020) to detect traffic sign objects in real-time.
In the field of the eye-mind, there is a strong as-
sociation between what the driver is gazing at and
what the driver’s mind is engaged with (Just and
Carpenter, 1980; Rucci et al., 2016). Kowsari et
al. (Kowsari et al., 2014) developed a unique cross-
calibration method to project the 3D driver’s gaze
from the reference frame of an eye-gaze tracker sys-
tem, mounted on the vehicle’s dashboard, onto the
reference frame of a forward stereo vision system, lo-
cated on the roof of the vehicle. To analyze the ro-
bustness of various approaches that connect traffic ob-
jects to the driver’s gaze, different types of gaze track-
ers calibrated against other sensors have been stud-
ied (Schwehr et al., 2019). Shripour et al. (Shirpour
et al., 2020) proposed a probabilistic model, a Gaus-
sian Process Model (GPR), employing driver head
pose to estimate the most probable gaze direction on
the forward stereo vision system. This method pro-
vided a confidence area of where the driver could be
looking.
Zabihi et al. (Zabihi et al., 2017) proposed a
vision-based framework to detect and recognize traf-
fic sign objects inside of the driver’s visual attention
that utilized HoG as features for detection, SVM as
a classifier, and Scale Invariant Feature Transforms
(SIFT) to recognize traffic signs. Shirpour et al.
(Shirpour et al., 2021b) introduced an approach based
on Multi-Scale HOG-SVM and a Faster R-CNN to
detect traffic signs and ResNet-101 to recognize them.
However, these methods did not include any of ob-
jects in consecutive frames to determine how many
are seen or missed by drivers.
The study of drivers’ behavior is crucial to im-
prove the reliability of active vehicle safety systems.
Speed is a critical factor in driving and understanding
the effect of norms, attitudes and habits of drivers is
important (Warner and Åberg, 2006; De Pelsmacker
and Janssens, 2007). Eboli et al. (Eboli et al., 2017)
found an explanation of the latent construct describ-
ing driving style by using speed and acceleration as
indicators of driving behaviour. Using a driving sim-
ulator, Bowden et al. (Bowden et al., 2017) investi-
gated the effect of speed on a driver’s perception of
the road and detection of peripheral objects. They
showed that stricter speed enforcement resulted in in-
creased subjective workload and therefore decreased
detection of peripheral objects. Shirpour (Shirpour
et al., 2021a) investigated driver gaze features and
road vanishing points considering the vehicle speed
in a naturalistic data set.
We make use of YOLO-V4 as an accurate and
Impact of Vehicle Speed on Traffic Signs Missed by Drivers
513
real-time object detector. We determine missed traf-
fic sign objects surrounding the vehicle environment
based on the driver’s visual attention for different
ranges of vehicle speed. We also analyze the driver’s
pre-attentive and attentive fixations on traffic sign ob-
jects for these speed ranges as well.
3 PROPOSED METHOD
The proposed method determines the missed traffic
objects considering vehicle speed and eye fixation,
and consists of three main steps. First, we use a ro-
bust and precise approach for deriving 3D Point-of-
Gaze and driver’s visual attention in absolute coordi-
nates expressed in the frame of reference of the ve-
hicle. Next, we provide details about our method to
detect traffic sign objects. Following this, a technique
is proposed to count missed sign objects and deter-
mine driver’s pre-attentive and attentive fixations on
traffic sign objects and group them by categories of
vehicle speeds.
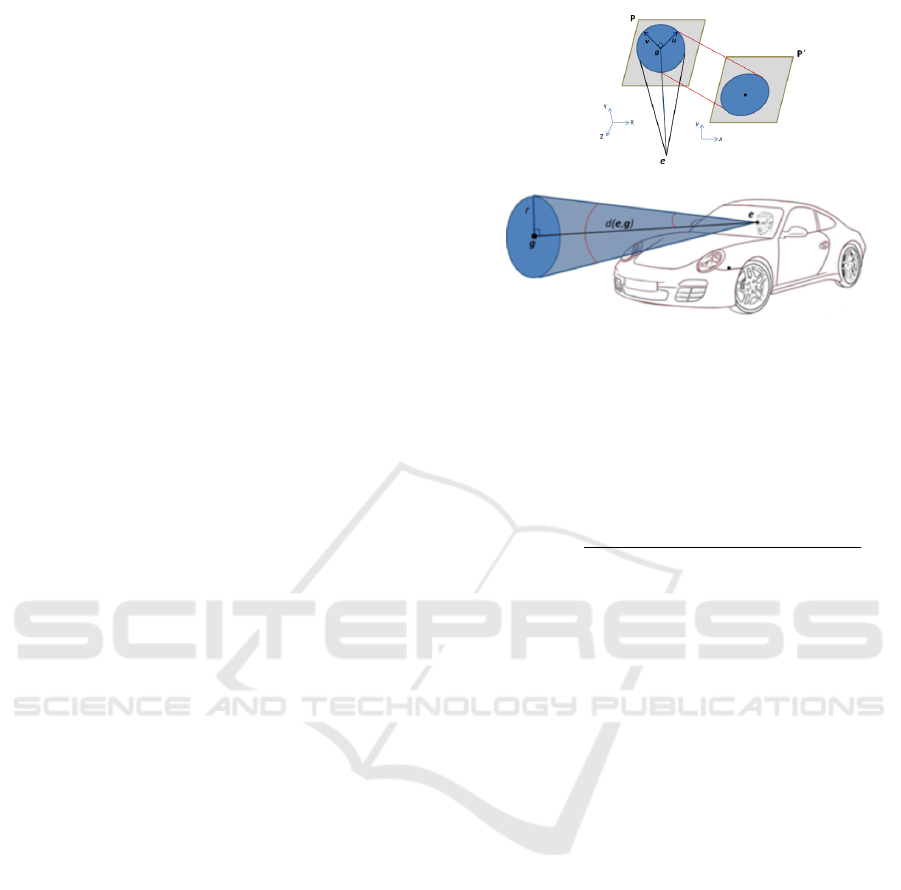
3.1 Driver Visual Attention
To obtain the 3D Point-of-Gaze (PoG) in absolute
coordinates expressed in the vehicle frame of refer-
ence, we employ a robust and accurate technique for
the cross-calibration of 3D Line-of-Gaze (LoG) with
stereoscopic vision systems that has been proposed
in (Kowsari et al., 2014). Next, the intersection of
the plane perpendicular at the 3D PoG along the 3D
LoG of the driver makes the driver’s attentional gaze
cone; this is illustrated in Figure 1. The angular open-
ing of the cone defines a circle within the 3D space,
which represents the driver’s visual attention. More-
over, when the eye fixates on a 3D Point-of-Gaze
(PoG) within the foveal vision, objects can be consid-
ered sharp and play a pivotal role in human activities
when visual details are of primary importance (Bär
et al., 2013). Therefore, we use the foveal angular
opening in this work, and if this area does not inter-
sect with an object while driving, we consider that the
driver misses this object.
The first step of our procedure is calculating the
radius of the circular attentional gaze area by the fol-
lowing formula:
r = tan(θ)d(e, g) (1)
where e = (e
x
, e
y
, e
z
) is the eye position estimated
by the remote gaze tracker and transformed into the
frame of the forward stereo scene system and g =
(g
x
, g
y
, g
z
) is the 3D PoG transformed into the frame
Figure 1: A depiction of the driver’s attentional gaze cone
and the re-projection of the 3D attentional circle onto the
image plane of the forward stereo scene system.
of the forward stereo scene system. The transforma-
tion matrix between the remote gaze tracker and the
stereoscopic systems is calculated based on (Kowsari
et al., 2014). θ is half of the angular opening, and d is
the Euclidean distance between e and g, given by
d(e, g) =
q
(e
x
− g
x
)
2
+ (e
y
− g
y
)
2
+ (e
z
− g
z
)
2
(2)
Then, we project the defined circle of the 3D plane
perpendicular to the LoG on the image plane of the
forward stereo scene system. The parametrically 3D
circle formula is:
(X, Y, Z) = g +r(cosφu + sinφv) (3)
where u = (u
x
, u
y
, u
z
) and v= (v
x
, v
y
, v
z
) are the
coordinates of two perpendicular vectors within the
plane perpendicular to the LoG, and φ is the angles
with values φ ∈ [0, 2π]. Using perspective projection
and applying the intrinsic calibration matrix of the
forward stereo camera, we can place it on the stereo
imaging plane. More details and equations are given
in (Kowsari et al., 2014) and (Zabihi et al., 2014).
3.2 Traffic Object Detection
We require an object detection algorithm to de-
tect critical on-road objects. We used YoloV4
(Bochkovskiy et al., 2020), a robust and accurate ob-
ject detection algorithm, to find the traffic objects on
the road. This algorithm belongs to the group of One-
Stage detectors that only look at an image once and
detect objects on the image in a single forward prop-
agation through its neural network. These One-Stage
detectors do classification and localization at the same
time, and as a result, they are suitable for real-time
ADAS applications (
´
Corovi
´
c et al., 2018). An ex-
ample of the result of image detection in our case is
shown in Figure 2.
VISAPP 2023 - 18th International Conference on Computer Vision Theory and Applications
514

Figure 2: Example result of our image detection algorithm.
The backbone of the YOLO algorithms extracts
the features; CSPDarknet53 (Wang et al., 2020) is
used as the base of the backbone. The convolution
architecture is a modification of DenseNet (Huang
et al., 2017). This modified version sends a copy of
the feature map from the base layer to the following
layer. Boosting backpropagation, diminishing gradi-
ent vanishing problems, fewer network parameters,
and improved learning are the pros of utilizing this
architecture. This revised version employs the cross-
stage partial connection which can reduce the compu-
tational bottleneck of DenseNet.
The next part of YOLO is the neck with extra
layers between the backbone and the head to ex-
tract different feature maps from different stages of
the backbone. This includes Path Aggregation Net-
works (PANets) and Spatial Pyramid Pooling (SPP).
The former aggregates the features, and the latter en-
hances the receptive field and sorts out the most sig-
nificant features from the backbone.
The head part of the algorithm detects the specific
objects in the images. As with the previous version
of YOLOV4, YOLOV3 (Redmon and Farhadi, 2018),
anchor-based steps are performed in the head section.
YOLOV4 also utilizes new techniques, such as Bag of
Freebies (BoF) (Zhang et al., 2019) and Bag of Spe-
cials (BoS) (Bochkovskiy et al., 2020), to enhance al-
gorithm performance. Bag of Freebies (BoF) is com-
posed of methods that increase the accuracy during
training without adding much inference time; these
include data augmentation, random cropping, shad-
owing, dropout, and complete IoU loss (CIoU), to
name a few, are some prevalent techniques. Addition-
ally, Bag of Specials (BoS) using an attention module
(Squeeze-and-Excitation and Spatial Attention Mod-
ule), enlarges the receptive field of the model, and
heightens feature integration power that can remark-
ably improve the accuracy of the results. Also, Bag of
Specials (BoS) includes mesh activation, DioU-NMS,
modified path aggregation networks, etc.
3.3 Finding Seen and Missed Traffic
Sign Objects
Based on the results of the processing described in
the previous stages, we have the Point of Gaze (PoG)
and the related attention area of the driver. After
training YOLOV4, our network can detect sign ob-
jects. Hence, we have gaze information and traffic
sign objects for all frames - information needed to
count missed traffic sign objects. The steps have been
shown in Figure 3.
To improve the reliability of our recognition of
traffic sign objects, we consider an object to be a sign
object when it is detected in consecutive frames. To
determine unique traffic sign objects that fall under
the driver’s gaze while driving, we assign unique IDs
to the traffic sign objects in consecutive frames. A
traffic sign object gets an ID based on the center of its
location when it is detected, and based on this infor-
mation when compared to other possible traffic signs,
this ID will be employed in the next frames. As a re-
sult, each unique traffic sign object gets a unique ID.
Hence, we consider a traffic sign object as a missed
traffic sign object if the driver’s visual attention area
does not intersect with the traffic sign object in the
sequence of frames containing that object.
Eye fixation falls into pre-attentive and attentive
fixations categories. During pre-attentive fixations,
the driver explores the surroundings to discover cru-
cial objects. This type of eye fixation usually takes
150 ms to 250 ms. On the other hand, attentive fixa-
tions refer to a situation when a driver focuses on and
realizes a specific object. When eye fixations take be-
tween 250 ms and 500 ms, it considers attentive fixa-
tions (Bär et al., 2013).
Considering this information and in order to an-
alyze driver’s attention relative to vehicle dynam-
ics, we can determine how many traffic sign objects
are missed while driving during different ranges of
speeds. We can also consider the pre-attentive and
attentive fixations on traffic sign objects during these
ranges to provide additional insight into a driver’s vi-
sual behavior.
4 EXPERIMENTAL RESULTS
We employed the driver sequences dataset recorded
by Beauchemin et al. (Beauchemin et al., 2010). This
dataset includes OBD II CAN-BUS channel informa-
tion, a remote gaze tracker with two cameras pointed
to the driver’s face, and two front-facing calibrated
Impact of Vehicle Speed on Traffic Signs Missed by Drivers
515
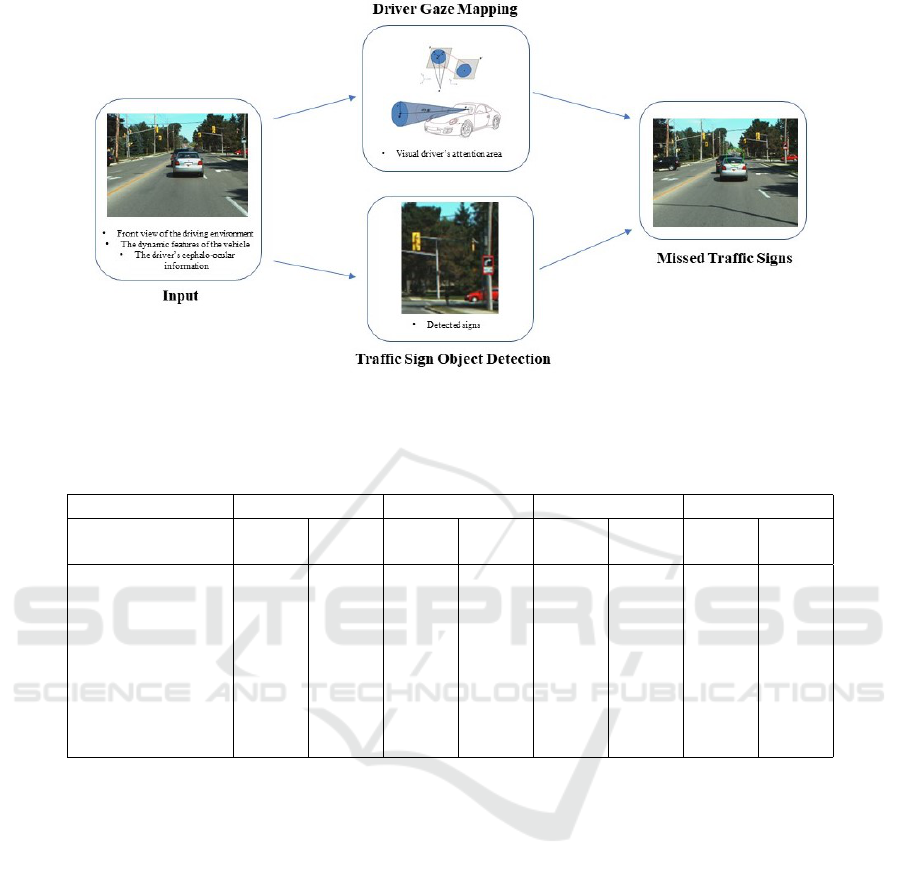
Figure 3: Steps of our approach to finding missed traffic signs. Inputs include front view of the driving environment, the
dynamic features of the vehicle, the driver’s cephalo-ocular information.
Table 1: The number of missed and total number of traffic signs in each speed range for sequences 8, 9, 13, and 15 (speed is
km/h).
Sequence number Sequence8 Sequence9 Sequence13 Sequence15
Speed Range
(km/h)
Missed
Signs
All
Signs
Missed
Signs
All
Signs
Missed
Signs
All
Signs
Missed
Signs
All
Signs
0 to 10 16 30 15 28 10 16 13 24
10 to 20 13 18 12 16 13 14 4 7
20 to 30 15 20 18 22 13 18 8 13
30 to 40 13 21 22 30 16 23 15 21
40 to 50 15 25 23 28 14 23 10 20
50 to 60 32 49 26 29 38 47 37 60
60 to 70 20 28 41 47 29 45 16 37
70 to 80 11 24 6 14 20 26 4 5
stereo cameras attached to the vehicle roof. The
dataset consists of sixteen different drivers on a pre-
determined 28.5 kilometres route in London, Ontario,
Canada. The drives covered various environmen-
tal conditions, such as shaded portions, cloudy and
sunny weather. We randomly selected four drivers for
our study and examined approximately 50000 frames
(about 28 minutes) for each roughly corresponding
to the same segment of the route in each sequence.
We divided the range of speed into steps of 10 km/h,
which seemed large enough to see effects and not too
large as to obscure them.
We provide results related to the driver’s attention
to traffic sign objects in different speed ranges. Table
1 shows the results of analyzing four different drivers.
It shows how many times the driver’s visual attention
missed the traffic sign objects in the different ranges
of speed for drivers (sequences) 8, 9, 13, and 15, re-
spectively. Using the ID assigned to each unique sign
detected, we can determine for each frame whether
the driver’s visual attention intersects with the traf-
fic sign object or not. If the driver’s visual atten-
tion did not have any intersection with that traffic sign
(same ID) in the consecutive frames, it is counted as
a missed traffic sign. The Missed Signs columns in
this table show the number of unique, as determined
by IDs, traffic sign objects that were not hit by the
driver’s visual attention during driving in each speed
range. The All Signs column reports the total number
of traffic sign objects in different speed ranges. Table
2 shows the percent of missed traffic sign objects to
the total traffic sign objects for each of the different
speed ranges. The last row of Table 2 provides the
percent of missed traffic sign objects to total traffic
sign objects regardless of their speed.
We flagged a traffic sign object as a pre-attentive
fixation if the driver’s visual attention intersected with
the traffic sign object lasted from 150 ms to 250 ms
in consecutive frames, approximately 5 to 7 frames.
When the duration of the intersection exceeded 250
VISAPP 2023 - 18th International Conference on Computer Vision Theory and Applications
516

Table 2: The percentage of missed traffic signs to total number of traffic signs for each speed range. The last row shows the
percent of all traffic signs missed by each driver regardless of their speed.
Speed Range (km/h) Sequence8 Sequence9 Sequence13 Sequence15
0 to 10 53.33 53.57 62.50 54.16
10 to 20 72.22 75.00 92.85 57.14
20 to 30 75.00 81.81 72.22 61.53
30 to 40 61.90 73.33 69.56 71.42
40 to 50 60.00 82.14 60.86 50.00
50 to 60 65.30 89.65 80.85 61.66
60 to 70 71.42 87.23 64.44 43.24
70 to 80 45.83 42.85 76.92 80.00
All ranges 63.30 76.16 72.16 57.21
Table 3: Number of eye pre-attentive, attentive fixations on traffic signs for different speed ranges.
Sequence number Sequence8 Sequence9 Sequence13 Sequence15
Speed Range
(km/h)
pre-
attentive
fixations
attentive
fixations
pre-
attentive
fixations
attentive
fixations
pre-
attentive
fixations
attentive
fixations
pre-
attentive
fixations
attentive
fixations
0 to 10 7 5 4 6 3 3 2 0
10 to 20 3 0 2 2 1 0 0 0
20 to 30 1 1 0 1 1 1 0 0
30 to 40 1 1 1 0 3 1 1 1
40 to 50 1 2 0 0 1 3 2 1
50 to 60 5 3 1 0 2 1 2 0
60 to 70 2 2 1 1 0 1 2 1
70 to 80 3 3 1 2 1 2 0 0
ms (8 frames), we counted it as an attentive fixation.
These time slots for pre-attentive and attentive fixa-
tions are generally accepted in the field and are taken
from previous research by Bär et al.(Bär et al., 2013).
Table 3 shows pre-attentive and attentive fixations for
sequences 8, 9, 13, and 15, respectively. A traffic sign
object in a timeframe might intersect as attentive fixa-
tions and intersect as pre-attentive fixations in another
timeframe. In this situation, we have counted one pre-
attentive fixation and one attentive fixation.
The results show that there are differences among
the drivers. Table 1 shows the number of missed traf-
fic sign objects. As might be expected, when the ve-
hicle speed is lower, drivers tend to pay more atten-
tion to signs, likely because drivers have more time to
check their surroundings and are less concerned about
checking the front of the car and other important road
elements during driving.
The last row of Table 2 shows the percentage of
missed traffic signs to all signs in all speed ranges
during driving. These results show, for sequences 8,
9, 13, and 15, the percentage of the traffic signs that
have been missed by the drivers during their drives
are 63.30, 76.16, 72.16, and 57.21, respectively. In
sequence 15, the driver missed the fewest traffic sign
objects, while in sequence 9, the driver missed the
most traffic sign objects compared to other drivers.
These differences show that drivers have different be-
haviors when checking on traffic sign objects. Many
factors, such as a driver’s awareness of the surround-
ings and traffic signs, road traffic, weather conditions,
driver distraction, can be reasons for a driver to miss
traffic signs while driving.
In regards to driver pre-attentive and attentive fix-
ations (shown in Table 3 for different speed ranges),
some drivers tended to focus more on signs, i.e., their
gaze tended to stay on a sign for a longer period, while
others paid less attention. The driver in sequence 15
had the lowest number of pre-attentive and attentive
fixations during driving while the driver in sequence
8 had the highest number of pre-attentive and atten-
tive fixations. Our results also indicate that drivers
tend to fixate on traffic signs, either as pre-attentive or
attentive fixations, more often when driving at slower
speeds than at higher speed ranges. This could be be-
cause drivers are trying to read signs at lower speeds
while at higher speeds are more focused on other as-
pects of the environment, such as the road, vehicles
in front, etc. A subsequent study examining a broader
range of objects that a driver has gazed upon could
shed some light on this question.
Impact of Vehicle Speed on Traffic Signs Missed by Drivers
517

5 CONCLUSION
In this study, we investigated the effect of vehicle dy-
namics on driver attention to traffic signs and miss-
ing traffic signs during driving. Utilizing an accurate
object detector algorithm, YOLO-V4, and an accu-
rate algorithm to map the driver’s gaze to the for-
ward stereoscopic system, we calculated the inter-
section of the driver’s visual attention area and traf-
fic signs. We determine the number of missed traf-
fic signs, number of pre-attentive and attentive fixa-
tions at various speed ranges. The results indicate that
fewer traffic signs are missed at lower speeds and that
there are more pre-attention and attentive fixations at
lower speeds. The results also indicate that different
drivers have different behaviors regarding checking
traffic signs during driving. In future work, we will
look to employ our method on a larger and more di-
verse dataset. We would look to explore the potential
impact of environmental factors, e.g. day/night, fog,
harsh sunlight, rain, snow, etc. We also plan to inves-
tigate combining our method in fusion with data from
other sensors to improve the accuracy. Analyzing the
effect of characteristics of signs, e.g. shape, color, and
orientation, in missing traffic signs is another inter-
esting topic that can be investigated to provide more
information on this subject.
In considering the implications for ADAS, we
note that not all signs are equally important, e.g. a
stop sign is probably more important than a parking
sign. Thus we may want to focus on "critical" signs,
which may be dependent on the driving context. We
would like to implement our method in an equipped
car to be used an actual driving situations where we
can determine whether a driver misses a critical traf-
fic sign, such as a stop sign, and possibly warning the
driver.
REFERENCES
Acharya, S. and Nanda, P. K. (2021). Adjacent lbp and ltp
based background modeling with mixed-mode learn-
ing for foreground detection. Pattern Analysis and Ap-
plications, 24(3):1047–1074.
Bär, T., Linke, D., Nienhüser, D., and Zöllner, J. M. (2013).
Seen and missed traffic objects: A traffic object-
specific awareness estimation. In 2013 IEEE Intel-
ligent Vehicles Symposium (IV), pages 31–36. IEEE.
Beauchemin, S., Bauer, M., Laurendeau, D., Kowsari, T.,
Cho, J., Hunter, M., and McCarthy, O. (2010). Road-
lab: An in-vehicle laboratory for developing cognitive
cars. In Proc. 23rd Int. Conf. CAINE.
Bochkovskiy, A., Wang, C.-Y., and Liao, H.-Y. M. (2020).
Yolov4: Optimal speed and accuracy of object detec-
tion. arXiv preprint arXiv:2004.10934.
Bowden, V. K., Loft, S., Tatasciore, M., and Visser, T. A.
(2017). Lowering thresholds for speed limit enforce-
ment impairs peripheral object detection and increases
driver subjective workload. Accident Analysis & Pre-
vention, 98:118–122.
Calvert, S., Schakel, W., and Van Lint, J. (2017). Will auto-
mated vehicles negatively impact traffic flow? Journal
of advanced transportation, 2017.
´
Corovi
´
c, A., Ili
´
c, V., Ðuri
´
c, S., Marijan, M., and Pavkovi
´
c,
B. (2018). The real-time detection of traffic partici-
pants using yolo algorithm. In 2018 26th Telecommu-
nications Forum (TELFOR), pages 1–4. IEEE.
De Pelsmacker, P. and Janssens, W. (2007). The effect
of norms, attitudes and habits on speeding behavior:
Scale development and model building and estima-
tion. Accident Analysis & Prevention, 39(1):6–15.
Eboli, L., Mazzulla, G., and Pungillo, G. (2017). How
drivers’ characteristics can affect driving style. Trans-
portation research procedia, 27:945–952.
Freund, Y. and Schapire, R. E. (1997). A decision-theoretic
generalization of on-line learning and an application
to boosting. Journal of computer and system sciences,
55(1):119–139.
Girshick, R. (2015). Fast r-cnn. In Proceedings of the IEEE
international conference on computer vision, pages
1440–1448.
Gupta, A., Anpalagan, A., Guan, L., and Khwaja, A. S.
(2021). Deep learning for object detection and scene
perception in self-driving cars: Survey, challenges,
and open issues. Array, 10:100057.
Huang, G., Liu, Z., Van Der Maaten, L., and Weinberger,
K. Q. (2017). Densely connected convolutional net-
works. In Proceedings of the IEEE conference on
computer vision and pattern recognition, pages 4700–
4708.
Just, M. A. and Carpenter, P. A. (1980). A theory of reading:
from eye fixations to comprehension. Psychological
review, 87(4):329.
Kowsari, T., Beauchemin, S. S., Bauer, M. A., Lauren-
deau, D., and Teasdale, N. (2014). Multi-depth cross-
calibration of remote eye gaze trackers and stereo-
scopic scene systems. In 2014 IEEE Intelligent
Vehicles Symposium Proceedings, pages 1245–1250.
IEEE.
Lin, C.-C. and Wang, M.-S. (2012). Road sign recognition
with fuzzy adaptive pre-processing models. Sensors,
12(5):6415–6433.
Liu, C., Tao, Y., Liang, J., Li, K., and Chen, Y. (2018). Ob-
ject detection based on yolo network. In 2018 IEEE
4th Information Technology and Mechatronics Engi-
neering Conference (ITOEC), pages 799–803. IEEE.
Liu, L., Ouyang, W., Wang, X., Fieguth, P., Chen, J., Liu,
X., and Pietikäinen, M. (2020). Deep learning for
generic object detection: A survey. International jour-
nal of computer vision, 128(2):261–318.
Liu, W., Anguelov, D., Erhan, D., Szegedy, C., Reed, S.,
Fu, C.-Y., and Berg, A. C. (2016). Ssd: Single shot
multibox detector. In European conference on com-
puter vision, pages 21–37. Springer.
VISAPP 2023 - 18th International Conference on Computer Vision Theory and Applications
518

National Center for Statistics and Analysis (2019). 2018
fatal motor vehicle crashes: Overview. Traffic Safety
Facts Research Note. Report No. DOT HS 812 826.
Pon, A., Adrienko, O., Harakeh, A., and Waslander, S. L.
(2018). A hierarchical deep architecture and mini-
batch selection method for joint traffic sign and light
detection. In 2018 15th Conference on Computer and
Robot Vision (CRV), pages 102–109. IEEE.
Redmon, J. and Farhadi, A. (2018). Yolov3: An incremental
improvement. arXiv preprint arXiv:1804.02767.
Ren, S., He, K., Girshick, R., and Sun, J. (2015). Faster
r-cnn: Towards real-time object detection with region
proposal networks. Advances in neural information
processing systems, 28.
Rucci, M., McGraw, P. V., and Krauzlis, R. J. (2016). Fixa-
tional eye movements and perception. Vision research,
100(118):1–4.
Salhi, A., Minaoui, B., Fakir, M., Chakib, H., and Grimech,
H. (2017). Traffic signs recognition using hp and hog
descriptors combined to mlp and svm classifiers. Traf-
fic, 8(11):526–530.
Schwehr, J., Knaust, M., and Willert, V. (2019). How to
evaluate object-of-fixation detection. In 2019 IEEE
Intelligent Vehicles Symposium (IV), pages 570–577.
Shao, F., Wang, X., Meng, F., Rui, T., Wang, D., and Tang,
J. (2018). Real-time traffic sign detection and recog-
nition method based on simplified gabor wavelets and
cnns. Sensors, 18(10):3192.
Sharma, P. and Singh, A. (2017). Era of deep neural net-
works: A review. In 2017 8th International Confer-
ence on Computing, Communication and Networking
Technologies (ICCCNT), pages 1–5. IEEE.
Shirpour, M., Beauchemin, S. S., and Bauer, M. A. (2020).
A probabilistic model for visual driver gaze approx-
imation from head pose estimation. In 2020 IEEE
3rd Connected and Automated Vehicles Symposium
(CAVS), pages 1–6.
Shirpour, M., Beauchemin, S. S., and Bauer, M. A. (2021a).
What does visual gaze attend to during driving? In
VEHITS, pages 465–470.
Shirpour, M., Khairdoost, N., Bauer, M., and Beauchemin,
S. (2021b). Traffic object detection and recognition
based on the attentional visual field of drivers. IEEE
Transactions on Intelligent Vehicles, pages 1–1.
Wang, C.-Y., Liao, H.-Y. M., Wu, Y.-H., Chen, P.-Y., Hsieh,
J.-W., and Yeh, I.-H. (2020). Cspnet: A new backbone
that can enhance learning capability of cnn. In Pro-
ceedings of the IEEE/CVF conference on computer
vision and pattern recognition workshops, pages 390–
391.
Wang, X., Han, T. X., and Yan, S. (2009). An hog-lbp hu-
man detector with partial occlusion handling. In 2009
IEEE 12th international conference on computer vi-
sion, pages 32–39. IEEE.
Wang, X., Hua, X., Xiao, F., Li, Y., Hu, X., and Sun, P.
(2018). Multi-object detection in traffic scenes based
on improved ssd. Electronics, 7(11):302.
Wang, X., Shrivastava, A., and Gupta, A. (2017). A-fast-
rcnn: Hard positive generation via adversary for ob-
ject detection. In Proceedings of the IEEE conference
on computer vision and pattern recognition, pages
2606–2615.
Warner, H. W. and Åberg, L. (2006). Drivers’ decision to
speed: A study inspired by the theory of planned be-
havior. Transportation Research Part F: Traffic Psy-
chology and Behaviour, 9(6):427–433.
Xing, M., Chunyang, M., Yan, W., Xiaolong, W., and Xue-
tao, C. (2016). Traffic sign detection and recogni-
tion using color standardization and zernike moments.
In 2016 Chinese Control and Decision Conference
(CCDC), pages 5195–5198. IEEE.
You, S., Bi, Q., Ji, Y., Liu, S., Feng, Y., and Wu, F. (2020).
Traffic sign detection method based on improved ssd.
Information, 11(10):475.
Zabihi, S., Beauchemin, S. S., De Medeiros, E., and Bauer,
M. A. (2014). Frame-rate vehicle detection within the
attentional visual area of drivers. In 2014 IEEE Intel-
ligent Vehicles Symposium Proceedings, pages 146–
150. IEEE.
Zabihi, S., Zabihi, S., Beauchemin, S. S., and Bauer, M. A.
(2017). Detection and recognition of traffic signs in-
side the attentional visual field of drivers. In 2017
IEEE Intelligent Vehicles Symposium (IV), pages 583–
588. IEEE.
Zhang, H., Qin, L., Li, J., Guo, Y., Zhou, Y., Zhang, J., and
Xu, Z. (2020). Real-time detection method for small
traffic signs based on yolov3. IEEE Access, 8:64145–
64156.
Zhang, Z., He, T., Zhang, H., Zhang, Z., Xie, J., and Li, M.
(2019). Bag of freebies for training object detection
neural networks. arXiv preprint arXiv:1902.04103.
Impact of Vehicle Speed on Traffic Signs Missed by Drivers
519
