
Recommender System for Alarm Thresholds in Medical Patient Monitors
Denise Schmidt
a
, Jonas Chromik
b
and Bert Arnrich
c
Hasso Plattner Institute, University of Potsdam, Germany
Keywords:
Intensive Care Unit, Patient Monitor Alarm, Alarm Fatigue, Threshold Alarm, Threshold Forecasting,
CatBoost, SHAP, MIMIC-IV.
Abstract:
Intensive care unit staff relies on patient monitors to identify critical conditions. The monitors trigger alarms
as soon as the patient’s vital parameters deviate from predefined threshold ranges. However, these ranges
are usually not adapted to the individual patient. High numbers of false alarms burden clinical staff and
pose a major risk to patient safety. We propose a recommender system for threshold values to enable a
patient-centered monitoring system. This can reduce false alarms caused by default monitoring settings. We
employ CatBoost – a gradient boosting algorithm – to predict blood pressure and heart rate thresholds. We
use SHAP values to evaluate the importance of different patient characteristics, diagnoses, or medications.
Several patient characteristics show an impact on the model output: Diagnoses, first care unit, vital parameter
measurements, and the amount of general anaesthetics are the most important features in all threshold models.
The recommendations of our system deviate from the actual thresholds by approximately 3.5 bpm for the heart
rate and 4.9 mmHg for the blood pressure thresholds. Blood pressure thresholds have a higher variance which
leads to larger errors. However, the underlying data is not very patient-centered and we require better alarm
data to further improve threshold recommendation.
1 INTRODUCTION
In the intensive care unit (ICU), patient monitors alert
medical staff through audiovisual alarms when the pa-
tient’s vital parameters are outside a healthy range.
These alarms – called threshold alarms – manifest
the most common type of alarms (Drew et al., 2014).
However, most of these alarms are not actionable –
they have no medical consequence (Schmid et al.,
2011; Sendelbach and Funk, 2013). One reason for
this is that the healthy range for vital parameters is
often defined by default values which are not patient-
specific. Medical staff adjusts thresholds manually
at their own discretion often lacking good standards
(Chambrin, 2001). Manually adjusting thresholds re-
quires time and an accurate assessment of the pa-
tient’s current situation.
We try to find out how to automatically recom-
mend patient-specific thresholds rather than relying
on default values. Similar research uses supervised
machine learning to predict clinical outcomes and
therapy characteristics: the duration of mechanical
a
https://orcid.org/0000-0002-6299-0738
b
https://orcid.org/0000-0002-5709-4381
c
https://orcid.org/0000-0001-8380-7667
ventilation (Pelter et al., 2020), opioid prescriptions
(Suba et al., 2019), mortality (Gonz
´
alez-N
´
ovoa et al.,
2021), or sepsis (Zhao et al., 2020).
In this paper, we develop a recommender system
for automated heart rate and blood pressure alarm
thresholds. We create patient-centered features and
implement a tree-based supervised machine learning
model. We evaluate the feature importance for each
model, thereby creating an explainable artificial intel-
ligence. The overall approach aims to be as generic
as possible, so that it can be transferred to other vital
parameters.
2 MATERIALS
We use semantic networks, machine learning con-
cepts, SHAP values, and the database MIMIC-IV. We
use SNOMED-CT and ICD-10 to enrich the MIMIC-
IV data with additional medical information. For the
machine learning concepts, we focus on the gradient
boosting algorithm CatBoost. We then evaluate each
feature with SHAP values.
74
Schmidt, D., Chromik, J. and Arnrich, B.
Recommender System for Alarm Thresholds in Medical Patient Monitors.
DOI: 10.5220/0011637500003414
In Proceedings of the 16th International Joint Conference on Biomedical Engineering Systems and Technologies (BIOSTEC 2023) - Volume 5: HEALTHINF, pages 74-85
ISBN: 978-989-758-631-6; ISSN: 2184-4305
Copyright
c
2023 by SCITEPRESS – Science and Technology Publications, Lda. Under CC license (CC BY-NC-ND 4.0)

MIMIC-IV. In March 2021, the MIT Laboratory
for Computational Physiology published the MIMIC-
IV database – the fourth version of its clinical
database MIMIC (Johnson et al., 2021). MIMIC-IV
is a single-centre database of de-identified health data
from patients admitted to the intensive care units at
the Beth Israel Deaconess Medical Center in Boston
(Torres, 2022). MIMIC-IV incorporates patient data
from 2008 to 2019 and focuses on data from MetaVi-
sion bedside monitors. MIMIC-IV has six modules:
Core, hosp, ICU, ED, CXR, and Note. But we are
only interested in the first three as these contain data
specific to intensive care unit stays. This leaves us
with 28 tables that provide a good grasp of the events
at the respective intensive care units throughout the
eleven years.
SNOMED CT. We use the Clinical Terms sec-
tion of the Systematized Nomenclature of Medicine
(SNOMED CT) to group the substances included in
MIMIC-IV according to their effect class. We only
consider medications that influence heart rate or blood
pressure. The development of SNOMED started in
1965 under the name of Systemized Nomenclature of
Pathology (SNOP). The College of American Pathol-
ogists (CAP) published the nomenclature to describe
morphology and anatomy. SNOP has been steadily
expanded and spread internationally. SNOMED CT
was created in 2002 by standardizing several previous
variants and is now used in over 50 countries (NIH,
2022).
ICD-10. Diagnoses recorded in MIMIC-IV are
coded using the International Statistical Classification
of Diseases and Related Health Problems (ICD). The
World Health Organization (WHO) publishes the ICD
and continues to develop it (WHO, 2022). It is the
international standard for the classification and uni-
form naming of diseases. We use ICD chapters to
group similar individual diagnoses together, thus cre-
ating new features.
CatBoost. Categorical Boosting (CatBoost) is an
open-source algorithm announced in 2017 by the
company Yandex (CatBoost, 2017). Like many
other popular gradient boosting algorithms, CatBoost
builds on binary, symmetric decision trees as base
predictors (Prokhorenkova et al., 2017). As opposed
to other gradient boosting algorithms like XGBoost
(Chen and Guestrin, 2016) or LightGBM (Ke et al.,
2017), CatBoost can cope with categorical features
during the training process and does not require pre-
vious feature encoding. Besides the advantage of cat-
egorical features, CatBoost outperforms comparable
algorithms in several other studies (Zhao et al., 2020)
(Kong et al., 2020) (Yu et al., 2020) and shows a
faster learning speed for GPU and CPU implemen-
tation (Dorogush et al., 2018). CatBoost’s ordered
boosting differs from other gradient boosting algo-
rithms by using and new schema to calculate the leaf
values of a decision tree. This new schema aims to
further reduce over-fitting. Classic boosting calcu-
lates the average of all gradients within a leaf to pro-
vide a prediction value. Thereby it considers all ob-
jects within the training dataset at once, leaking in-
formation about later appearing objects. CatBoost
prevents that leakage by creating models that were
trained only on previous records within the training
set.
SHAP. Shapley Additive Explanation (SHAP) val-
ues are based on Shapley values established in 1953
by Lyod Shapley (Shapley, 1953). Initially, Shapley
values originated from game theory. They explain the
contribution of a single player within a coalition to
an output. Lundberg and Lee applied this concept to
explain machine learning models and published the
SHAP algorithm in 2017 (Lundberg and Lee, 2017).
They replaced the idea of the player with a feature to
answer the question of how much an individual fea-
ture contributes to the output of a model. SHAP val-
ues are model agnostic and can be used on every kind
of machine learning model. Lundberg and Lee pro-
vide several specific explainers for different models.
3 METHODS
To create a threshold recommender system based on
the MIMIC-IV data, we follow the approach for data
science projects by McIlwraith (McIlwraith et al.,
2016). The process is adapted for machine learning
and based on the steps of Fry (Fry, 2004).
The first step is to acquire the data. In this project,
MIMIC-IV serves as the main data source, enriched
by additional external data such as SNOMED CT. In
the next step, the collected data needs to be parsed
and cleaned. We discuss the application of this step
in more detail in the following paragraphs on static
and transactional patient data. We explore and ex-
amine the cleaned data to gain initial insights and we
prepare machine learning models by extracting fea-
tures from the data. In this step of the process, it is
advantageous to rely on existing domain knowledge
to bring already-known information into the data. In
this project, this is achieved by using SNOMED CT to
map very low-level substance information to medica-
tion classes. After feature engineering, we create and
Recommender System for Alarm Thresholds in Medical Patient Monitors
75
train several CatBoost models which we outline in the
paragraph on the automation of thresholds. The last
step of the process is evaluating the models. We ap-
ply the mean absolute error and SHAP values for the
model evaluation. In the following, we briefly out-
line the steps taken to parse and clean the data, create
additional features and configure the models.
Static Patient Data. Static patient data are all
patient-related data that do not change during the
stay at the intensive care unit. These information
are to be found in the MIMIC-IV tables patients,
admissions, diagnoses icd, d diagnoses icd,
and icustays. We focus on the following attributes:
gender, ethnicity, age at intime, and the three ICD
codes with the highest priority. The age at intime and
the ICD codes require additional transformations. We
pivot the diagnoses data in order to retrieve one set of
features per stay. The attribute selection is based on
factors known to influence heart rate and blood pres-
sure. Other characteristics like the body mass index
or the history of smoking would have been desirable
but are not accessible via MIMIC-IV.
Transactional Patient Data. With transactional
data, we refer to the vital parameter measurements
and threshold settings which change throughout the
stay. This data is stored in MIMIC-IV’s chartevents
table. We first filter the data set to retain only data
items related to heart rate (HR) or non-invasively
measured systolic blood pressure (NBPs) events. Af-
terwards, we remove measurements and thresholds
which fall outside clinically valid ranges (Table 1).
Finally, we exclude all stays that do not have at least
one pair of thresholds (low and high) and one mea-
surement for both parameters (HR and NBPs).
Table 1: Valid ranges used for cleaning of values. Adapted
from (Harutyunyan et al., 2019).
Vital Parameter Lower Limit Upper Limit
HR 0 350
NBPs 0 375
From the cleaned data, we create additional fea-
tures. First, we extract the vital parameter measure-
ments that occurred between the threshold adjust-
ments. We calculate several descriptive measures like
the minimum vital parameter measured within this pe-
riod or the measurement closest to the threshold set-
ting. Also, we extract the time that passed since the
patient was administered to the unit, as well as the
hour of the day in which the threshold was changed.
This characteristic is used for the analysis of the cir-
cadian rhythm.
Data Enrichment with SNOMED-CT. The
MIMIC-IV inputevents table — which contains
the administered medication — has more than nine
million records of 325 substances. In our model,
we only incorporate substances that influence HR or
NBPs. To do so, we classify the 325 substances into
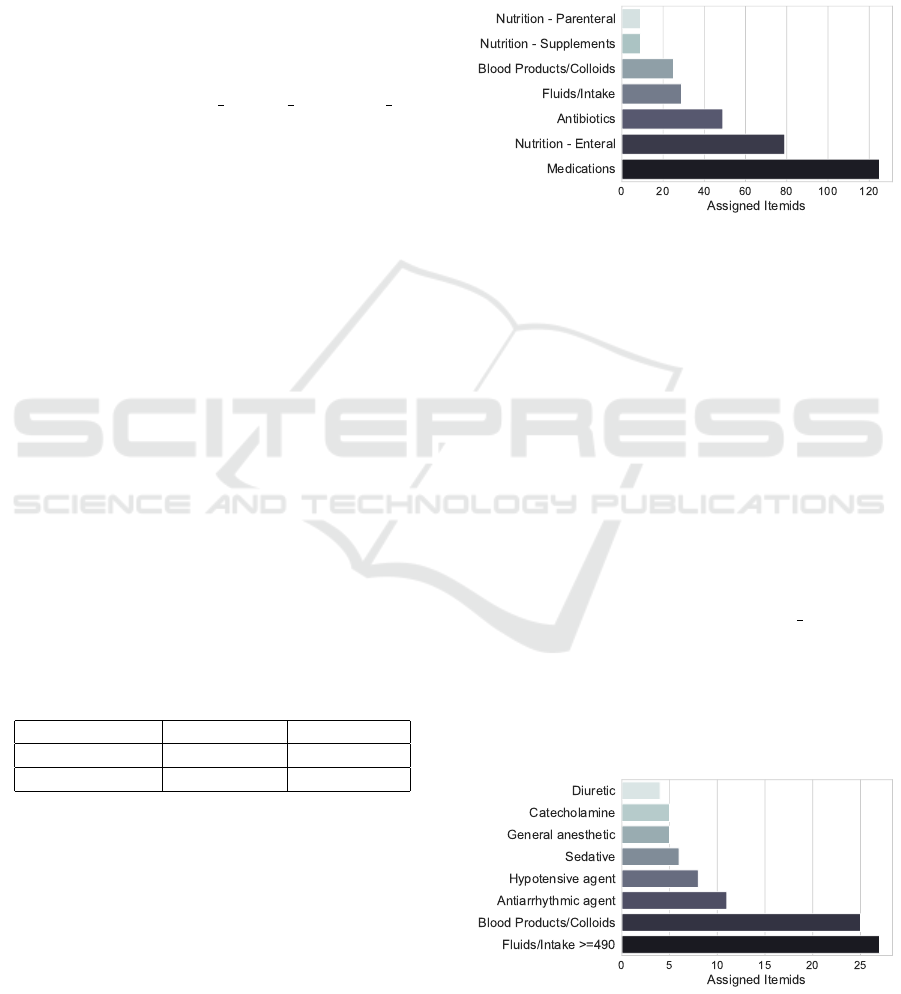
medication groups. MIMIC-IV maintains a category
attribute for each substance (Figure 1).
Figure 1: Number of MIMIC-IV substances stratified by the
category maintained in MIMIC-IV.
We exclude nutrition and antibiotics as they
should not influence HR and NBPs. Fluids and intake
influence the body volume and we include those with
an amount larger than 490mL: 500mL are commonly
administered and we allow for a 10mL error mar-
gin. Substances in the medications category do not
allow for further insights. Thus, we extract relevant
substances by incorporating SNOMED CT data. We
extract all substances referring to the SNOMED CT
concepts catecholamine, hypotensive agents, seda-
tives, diuretics, antiarrhythmic agents, and gen-
eral anaesthetic from the SNOMED CT browser
(SNOMED International, 2022). We then join the ex-
tracted SNOMED CT data to the inputevents table
via the substance description from the d items table
and the Fully Specified Name. 39 of the 120 sub-
stances categorized as medication match a SNOMED
CT parent. Implementing those steps reduces the ini-
tial number of 325 unique substances to 91 that are
incorporated in further analysis. The distribution by
medication category is shown in (Figure 2).
Figure 2: Number of MIMIC-IV substances stratified by the
medication category (MIMIC or SNOMED).
HEALTHINF 2023 - 16th International Conference on Health Informatics
76

We extend the transactional data with the data for
these substances. For each threshold update, we pro-
vide the answers to the following questions in form of
features:
• How many minutes passed since the patient last
received medication of this class?
• Which medication amount was administered for
the substance of the class that had last been given?
• Which medication rate was administered for the
substance of the class that had last been given?
Data Enrichment with ICD-10. The first three di-
agnosis codes maintained across all MIMIC-IV ad-
missions contain 8,471 unique ICD codes. But the
codes stem from different ICD versions: 47% use ver-
sion 9 and 53% use version 10. Thus, we first need
to transform all the diagnosis codes to one ICD ver-
sion – we choose ICD-10. An insight from this is that
both ICD-9 code 008.01 and ICD-10 code A04.0 refer
to the same infection (enteropathogenic Escherichia
coli) and thus, influence the alarm thresholds in the
same way (an increased high HR threshold). We har-
monize the ICD versions using the General Equiva-
lence Mappings provided by the National Bureau of
Economic Research (NBER, 2022). Afterwards, we
enrich the ICD-10 codes with their respective ICD
chapters as a supplement feature to the individual dis-
ease codes.
Automation of Thresholds. Within this project, we
focus on creating a recommender system for HR and
NBPs thresholds. However, the approach is designed
to be generic, so that it can be transferred to other vital
parameters. Our goal is not only to predict thresholds
correctly but also to create explainable models. We
want to understand a feature’s impact and identify the
model with the best results. This can help identify
suitable features in other data sets as well. To do so,
we iteratively increase the pool of features to train and
evaluate the model. We use the mean absolute error
to evaluate the model performance and SHAP values
to examine the feature impact. We create four model
configurations:
1. Static features
2. Static and dynamic features
3. Static, dynamic and structural features
4. Static, dynamic and structural features with previ-
ous feature selection
The dynamic features refer to transactional and med-
ication features. Structural features refer to organisa-
tional aspect of the hospital, like the first care unit.
This reveals underlying structural information about
the hospital environment in which the thresholds were
set. Each configuration is applied for each threshold
type (HR low, HR high, NBPs low, NBPs high).
For each model, we perform hyperparameter tun-
ing for the number of iterations, learning rate, and
bootstrap type by using a grid search. Before train-
ing, we perform a Spearman correlation analysis for
the features to exclude highly correlated features.
Missing Values. For the static features, there are no
missing data except for 11% of the stays that do not
have a second or third diagnosis. We replace these
missing values with -1. For missing medications, we
use a small number (-1) to code missing rate and
amount and a large number (i.e. 1,000,000) to code
missing time since administration. These default val-
ues help with the SHAP evaluation: A small number
(-1) for rate and amount means no medication and a
large number for the time since administration means
a long time – ideally forever – since the last medica-
tion was given.
4 RESULTS
In this section, we present the performance of the vari-
ous CatBoost models trained on the transformed data.
We also identify the most influential patient character-
istics. We first give a brief overview of the data after
data cleaning and feature engineering.
4.1 Data
Table 2 contains the number of rows resulting from
the data transformation steps described in section 3.
These refer to 75,841 ICU stays for the HR thresholds
and 72,094 ICU stays for the NBPs thresholds.
The distributions of the HR events in Figure 3
show two dominant threshold values per threshold
type. These are 50 and 60 bpm for the low and 120
and 130 bpm for the high threshold. The high thresh-
olds vary more than the low thresholds.
In contrast to the HR thresholds, the NBPs thresh-
olds show only one main value (Figure 4). This is 90
mmHg for the low threshold and 160 mmHg for the
high threshold. The variance and thus the number of
outliers is higher than for the HR thresholds.
4.2 Threshold Automation
The CatBoost algorithm does not require any fur-
ther data transformation. The algorithm can cope
Recommender System for Alarm Thresholds in Medical Patient Monitors
77
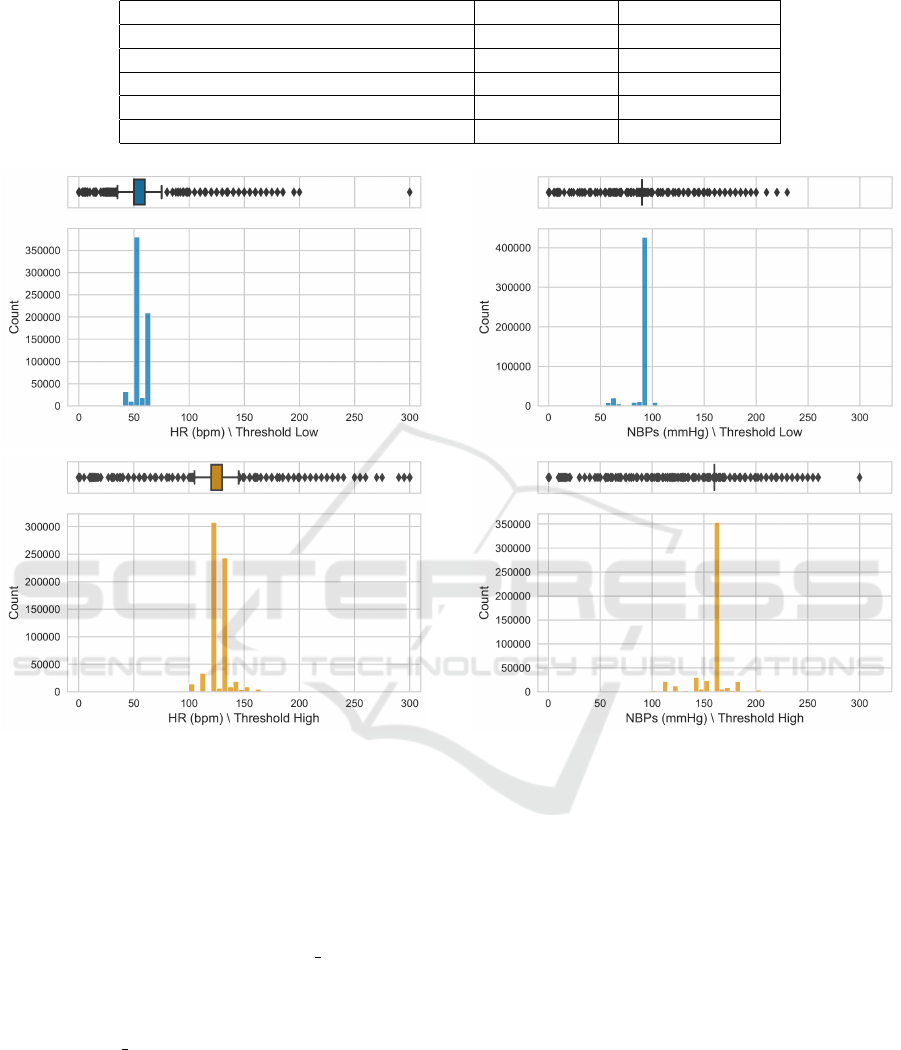
Table 2: Overview of observation counts for HR and NBPs events.
HR (No. rows) NBPs (No. rows)
Original (All) 8,111,589 5,279,925
After Value Range Cleaning (All) 8,110,973 5,279,337
After Inclusion Criteria (Measurements) 6,793,230 4,255,749
After Inclusion Criteria (Threshold Low) 656,188 498,889
After Inclusion Criteria (Threshold High) 656,605 499,195
Figure 3: Distribution of the HR threshold after cleaning.
with categorical variables intrinsically. However, we
later calculate the SHAP values to evaluate the fea-
ture impact. As we utilize the beeswarm plots of the
SHAP library (SHAP, 2022), we perform label encod-
ing on the categorical features to enable visual inter-
pretations. Therefore, all following CatBoost models
are trained on label-encoded categorical features. By
adding the respective indices to the cat features at-
tribute of the fit() method, they are still marked as
categorical and not interpreted as continuous features.
Features which we added as categorical features are
marked with a cat suffix in the beeswarm plots.
4.2.1 Low HR Threshold
The MAE for the test data set ranges from 3.91 for
the simplest configuration to 2.95 for the fourth con-
figuration in which we select the ten most important
features. Comparing the best to the worst MAE, a
Figure 4: Distribution of the NBPs threshold after cleaning.
relative improvement of 24.3% can be achieved by
adding dynamic and structural features. Neverthe-
less, the largest relative improvement of 20.2% occurs
when adding the second and third diagnoses in form
of the original ICD code and the respective ICD-10
chapters.
Static Features. For the first configuration, the im-
pact on the model output ranges between -3 and +5
bpm from the base value (Figure 5). High age causes
the lowest predictions but – in general – age at in-
time has a low feature importance. The first diagnoses
chapter is the most important feature, leading to an
impact on the model output of +5 bpm for the highest
prediction values. Based on the colour coding of the
19 chapters, no clear trend can be observed: There is
no distinct relationship between specific chapters and
a lower or higher prediction. However, 90% of the
ICD codes with values above 1.1 bpm stem from ICD-
HEALTHINF 2023 - 16th International Conference on Health Informatics
78
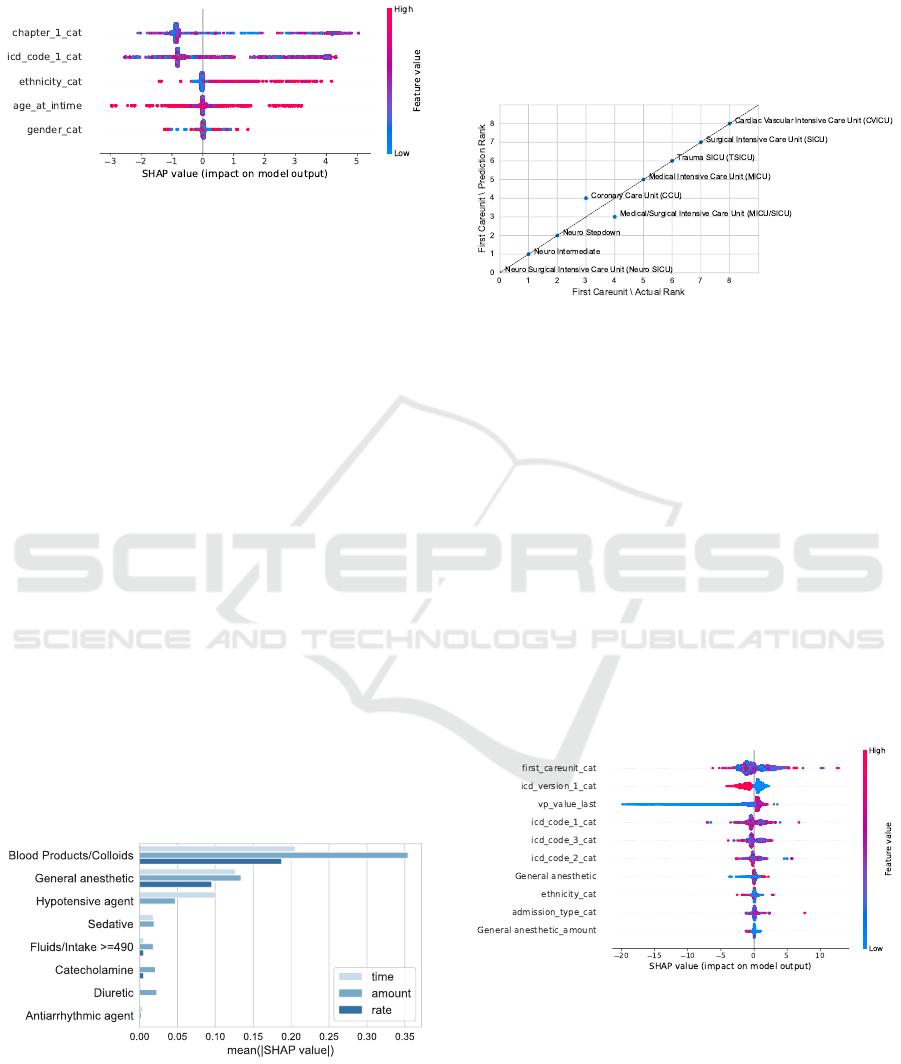
9. This suggests that the ICD version has a higher
impact than the diagnostic similarity of the codes.
Figure 5: SHAP beeswarm plot for the simplest HR Low
model.
For ethnicity, a clearer trend can be observed.
Low-coded ethnicities like white (factorized with 0),
African American (factorized with 1) and unknown
(factorized with 2) tend to range around the expected
prediction value of 51.67 bpm. Higher predictions re-
fer to events of patients with the ethnicity other (fac-
torized with 3), and unable to obtain (factorized with
6). That matches the trend in the actual test data.
Events referring to the ethnicity other or unable to ob-
tain show the highest mean low HR thresholds.
Gender shows the least impact on the predicted
values. The mean SHAP value for males is slightly
above 0, therefore slightly increasing the prediction.
Consequently, females get a slightly lower mean pre-
diction. This is a trend that we not only found in the
predictions but also in the actual data.
Static and Dynamic Features. When adding dy-
namic features, we find that blood products and col-
loids are the most influential medications regarding
all three aspects: time of administration, amount, and
rate (Figure 6). General anaesthetics form the second
most important medication category and for hypoten-
sive agents, the time since administration seems to be
the most important characteristic.
Figure 6: Mean absolute SHAP values stratified by medica-
tion category for HR Low.
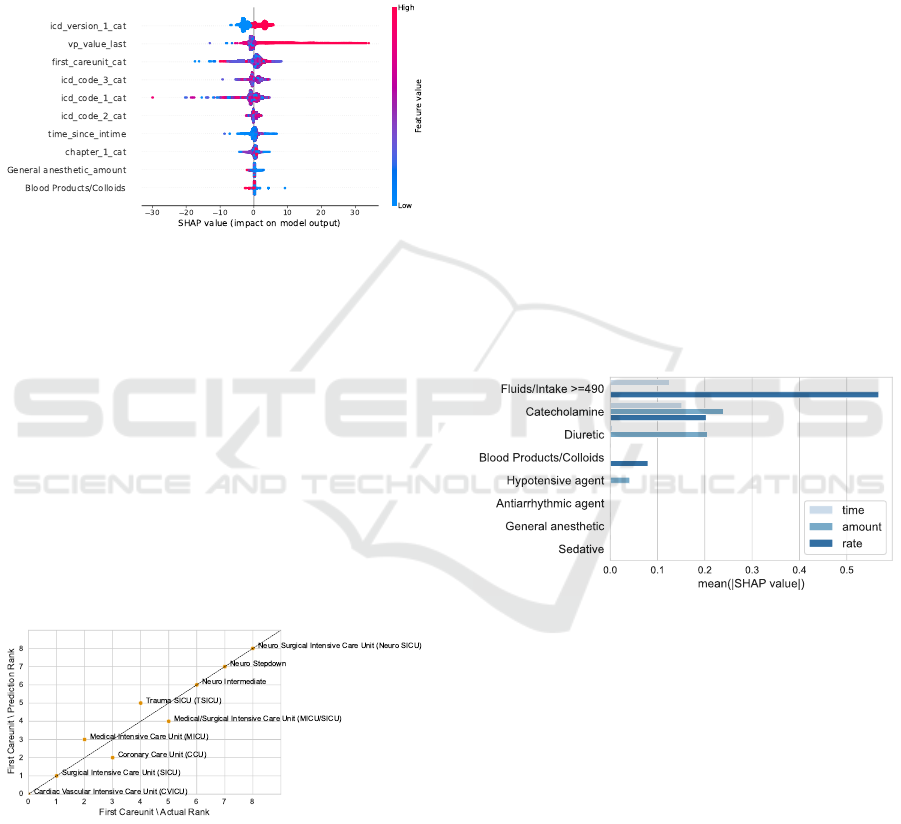
Static, Dynamic, and Structural Features.
Adding structural information changes the feature
importance. Most notably, the first diagnosis is
replaced by the first care unit as the most important
feature. Stays in the neurological ICUs receive
the lowest predictions while stays in the cardiac
vascular ICU receive the highest. This matches the
observations in the actual data as shown in Figure 7.
Figure 7: Relation between the predictions and the actual
low HR thresholds for the first care unit in the third config-
uration. We derive the rank from the mean low threshold
for each category. A low mean refers to a low rank. We
can observe a good match between the predictions and the
actual values.
Feature Selection. When performing a feature se-
lection before the training of the model, all structural
features are selected within the ten most important
features. Ethnicity is the only demographic feature
included. Furthermore, all original ICD codes but no
ICD chapter information are selected. For the dy-
namic features, general anaesthetics is the only rep-
resented medication class, and the last measured vi-
tal parameter is the only time-related feature. Low
threshold predictions can mainly be explained by low
previous HR measurements. The selection is dis-
played in Figure 8.
Figure 8: SHAP beeswarm plot for the low HR model with
previous feature selection. Medication categories without a
suffix refer to the time since amdinsitration.
4.2.2 High HR Threshold
The MAE for the high HR threshold predictions in the
test data set ranges from 4.68 for the simplest config-
uration to 4.01 for the model with the ten most im-
Recommender System for Alarm Thresholds in Medical Patient Monitors
79
portant features. That translates to a maximum im-
provement of 14.32%. As for the low HR threshold,
the largest improvement can be observed when the
second and third diagnoses are added to the model.
However, the MAE only improves by 9.4%, whereas
for the low HR threshold it improved by 20.2%. Com-
paring the distribution of the predicted value to the ac-
tual ones shows that the variance for the predictions is
lower than for the actual data. The distinction of the
peaks at 120 and 130 bpm is also represented in the
predictions.
Static Features. As for the low HR threshold, the
first diagnosis is most important. Figure 9 shows two
clusters: one reducing the threshold and one increas-
ing it. Closer inspection shows that ICD-9 codes lead
to lower predictions and ICD-10 codes lead to higher
predictions. The demographic features ethnicity, age,
and gender show a lower impact on the model output
than for the low HR model. The lowest predictions are
impacted by a low age, showing SHAP values down
to -3.22 bpm from the base value. All events showing
SHAP values below -2 bpm refer to patients between
19 and 33 years at intime.
Figure 9: SHAP beeswarm plot for the simplest HR High
model.
Static and Dynamic Features. Adding the medi-
cation as time since administration features reveals
two dominant trends: Catecholamines, antiarrhyth-
mic agents, sedatives, and hypotensive agents raise
the prediction when administered a short time before
setting the threshold (Figure 10). This matches the
trends in the actual data, in which those categories
displayed the highest high thresholds. Blood prod-
ucts/colloids decrease the threshold prediction by up
to 5 bpm. This also supports the findings from the
data analysis in which stays receiving this medication
showed the lowest high HR threshold. The data anal-
ysis also revealed that stays receiving general anaes-
thetics display lower high HR thresholds. This does
not become evident from the SHAP analysis. When
observing the medication trends for the amount re-
lated features, blood products/colloids and general
anaesthetics show similar trends to the time since
administration. A high amount rather decreases the
prediction. Hypotensive and antiarrhythmic agents
given as amount lead to an impact in both direc-
tions, whereas when given as time, both categories
increased the prediction.
Figure 10: SHAP beeswarm plot for the HR High model
including static and time related medication features.
In general, features given as amount show the
highest mean absolute SHAP values (Figure 11). As
for the low HR models, blood products/colloids and
general anaesthetics are the two most important cate-
gories.
Figure 11: Mean absolute SHAP values stratified by medi-
cation category for HR High.
Static, Dynamic, and Structural Features. The
ICD codes lose importance when we add structural
features. ICD codes coded with ICD version 9 show
a lower prediction than ICD version 10. This needs
to be enriched with information gained during the
correlation analysis. It can relate to different care
units using different thresholds or changed default
values during the acquisition years. The ICD version
already showed a clear split for the low HR threshold,
indicating that the low HR threshold decreased for
ICD version 10, leading to a larger threshold range.
HEALTHINF 2023 - 16th International Conference on Health Informatics
80
Feature Selection. When performing a feature se-
lection and only selecting the ten most important fea-
tures (Figure 12), the ICD codes gain a more promi-
nent role again. General anaesthetics coded as amount
and blood products/colloids coded in minutes since
administration are the only two medication features
represented in this selection. Seven out of the ten
most important features are similar between the low
and the high HR model.
Figure 12: SHAP beeswarm plot for the high HR model
with previous feature selection.
The first care unit again scores high on feature im-
portance. Stays referring to the medical or surgical
ICU are associated with lowering the prediction by
up to -17.47 bpm. Comparing the threshold predic-
tions to the actual ones for the test data set (Figure 13),
the ranks match with four minor swaps. Stays in the
cardiac vascular ICU have the lowest mean thresh-
old prediction of 120.40 bpm. The actual mean for
stays of that first care unit on the test data is slightly
lower with 118.94 bpm, however, also shows the low-
est value. The neurosurgical ICU scores the highest
mean for the predicted as well as the actual thresh-
olds, being 128.88 bpm and 125.93 bpm.
Figure 13: Relation between the predictions and the actual
high HR thresholds for the first care unit in the fourth con-
figuration. We derive the rank from the mean low threshold
for each category. A low mean refers to a low rank. We
can observe a good match between the predictions and the
actual values.
4.2.3 Low NBPs Threshold
Due to the low variance of the low NBPs thresholds,
we will only quickly summarize the main findings
without going into the details of the configurations.
The MAE ranges from 3.35 for the simplest configu-
ration to 3.31 for the fourth configuration, therefore
only showing a maximum improvement of 1.19%.
Due to the prevailing default value of 90 mmHg, there
is a high risk of overfitting in the event of deviat-
ing threshold values. Performing the feature selection
prior to training the model, eight out of ten features
match the selected features of the low HR model, and
six out of ten features match the selected features for
the high HR model, thereby showing a high consis-
tency. Besides the eight identical selected features,
the time since catecholamines were administered as
well as the administered amount are selected as fea-
tures with the highest impact. A short time since cat-
echolamines were administered leads to a deviation
from the base value in both directions. Even though
Fluids coded as rate information are the most impor-
tant feature within the configuration for static and dy-
namic features (Figure 14), they are not selected when
performing the feature selection prior to the training.
Figure 14: Mean absolute SHAP values stratified by medi-
cation category for NBPs Low.
Again visualizing the relation between prediction
and actual data at the example of the first care unit, the
predictions mirror the trend in the actual data (Fig-
ure 15). The lowest SHAP values for the first care
unit refer to stays in the neuro ICU. We performed
the prediction on the test data set which resulted in a
mean threshold prediction of 89.83 mmHg compared
to an actual mean of 89.49 mmHg. Even though the
ranks are mostly aligned between the actual and pre-
dicted threshold, the actual data shows a larger stan-
dard deviation across the first care units. The lowest
mean threshold refers to stays in the medical ICU with
86.61 mmHg whereas the mean prediction for that
care unit is 89.52 mmHg. Similar accounts to the up-
per end of the threshold means with stays on the neuro
stepdown showing the highest mean of 91.62 mmHg.
Recommender System for Alarm Thresholds in Medical Patient Monitors
81
The predictions are closer to the expected value of
89.76 mmHg, showing a mean of 90.07 mmHg.
Figure 15: Relation between the predictions and the actual
low NBPs thresholds for the first care unit in the third con-
figuration. We derive the rank from the mean low threshold
for each category. A low mean refers to a low rank. We
can observe a good match between the predictions and the
actual values.
4.2.4 High NBPs Threshold
The MAE for the test data set ranges from 7.41 for
the first to 6.69 for the fourth configuration, result-
ing in a maximum improvement of 9.85%. The rather
high MAE compared to the other thresholds can be
explained by the higher variance of the data and the
higher amount of outliers. The largest relative MAE
improvement can be achieved by adding the medica-
tion features in form of the time since administration
to the static ones. This is similar to the high HR
model, whereas the low threshold models benefited
more from the amount (HR low) and the rate (NBPs
low) information.
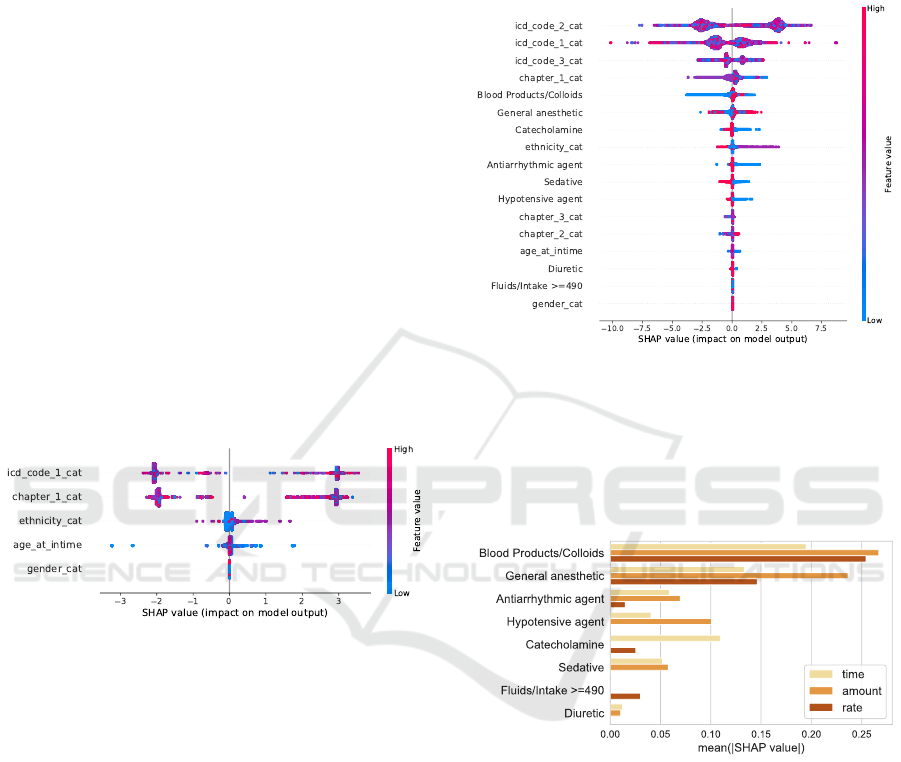
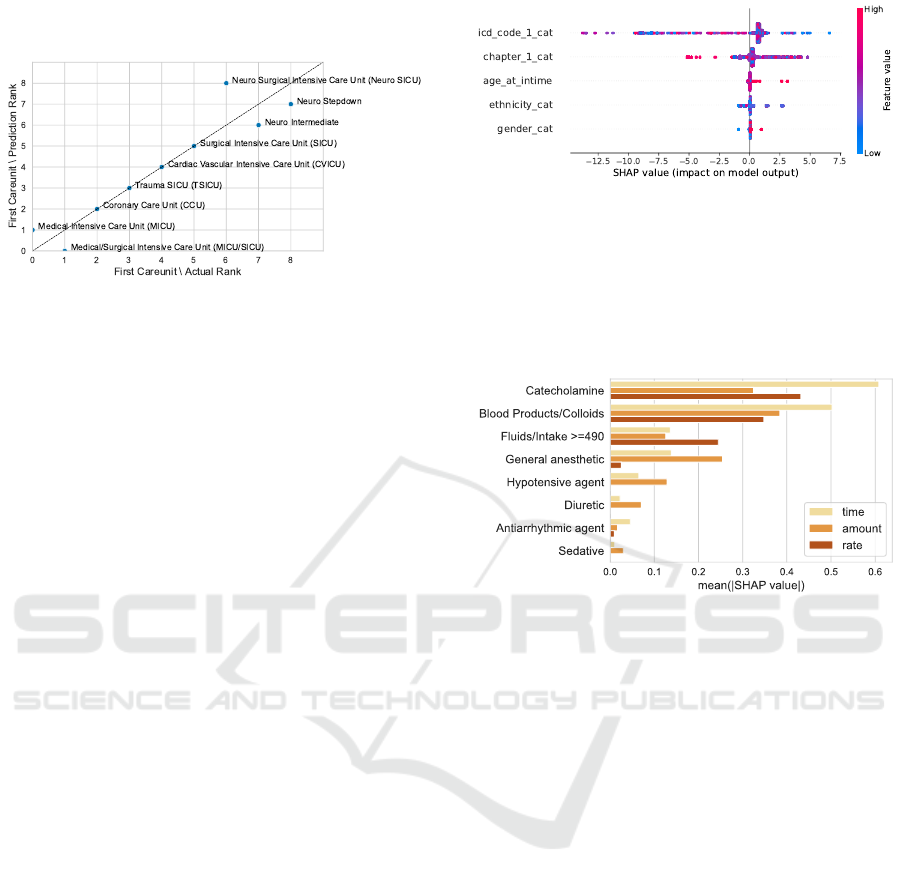
Static Features. As for the high HR model, the ICD
code referring to the first diagnosis has the highest
feature importance, followed by the respective chap-
ter (Figure 16). Whereas ethnicity was the most im-
portant demographic feature for the other models, age
at intime ranks higher in the high NBPs model. A
higher age corresponds to a higher high NBPs thresh-
old for multiple prediction events. Gender shows the
least feature importance. Whereas most predictions
are not impacted by gender. 593 events are associ-
ated with the male gender and a decreased threshold
prediction. 659 events are associated with the female
gender and increase the prediction. That is congru-
ent with the observations made within the actual data,
where males tend to show slightly lower high thresh-
old values than females.
Static and Dynamic Features. Adding medication
features to the high NBPs model, catecholamines
are the most important medication category when
Figure 16: SHAP beeswarm plot for the simplest NBPs
High model.
given as time since administration or rate (Figure 17).
Within the amount model, blood products/colloids
rank higher. Sedatives, antiarrhythmic agents, and di-
uretics show the lowest mean absolute SHAP value
on the model.
Figure 17: Mean absolute SHAP values stratified by medi-
cation category for NBPs High.
A short time since catecholamines were adminis-
tered leads to a reduction of the high NBPs threshold
up to more than 15 mmHg. The same trend can be
observed for a high amount as well as the rate that
was administered. Blood products/ colloids show the
same trend in all three models. This matches the find-
ings from the data analysis in which patients receiving
catecholamine or blood products showed lower high
thresholds. A high last measured vital parameter can
increase the prediction up to 20 mmHg. A high time
since intime rather decrease the prediction, but only
up to 5 mmHg.
Static, Dynamic, and Structural Features.
Adding structural features to the model does not
change the feature impact much. The first care unit
becomes the second most important feature. Stays in
the cardiovascular ICU receive the lowest predictions
(on average 147.98 mmHg) which matches the
underlying data (on average 147.48 mmHg). As for
the high HR threshold, stays on one of the three
neurological ICUs receive the highest predictions –
which mirrors the actual data as well (Figure 18).
However, when comparing the standard deviation
of the actual thresholds to the predicted ones, the
HEALTHINF 2023 - 16th International Conference on Health Informatics
82
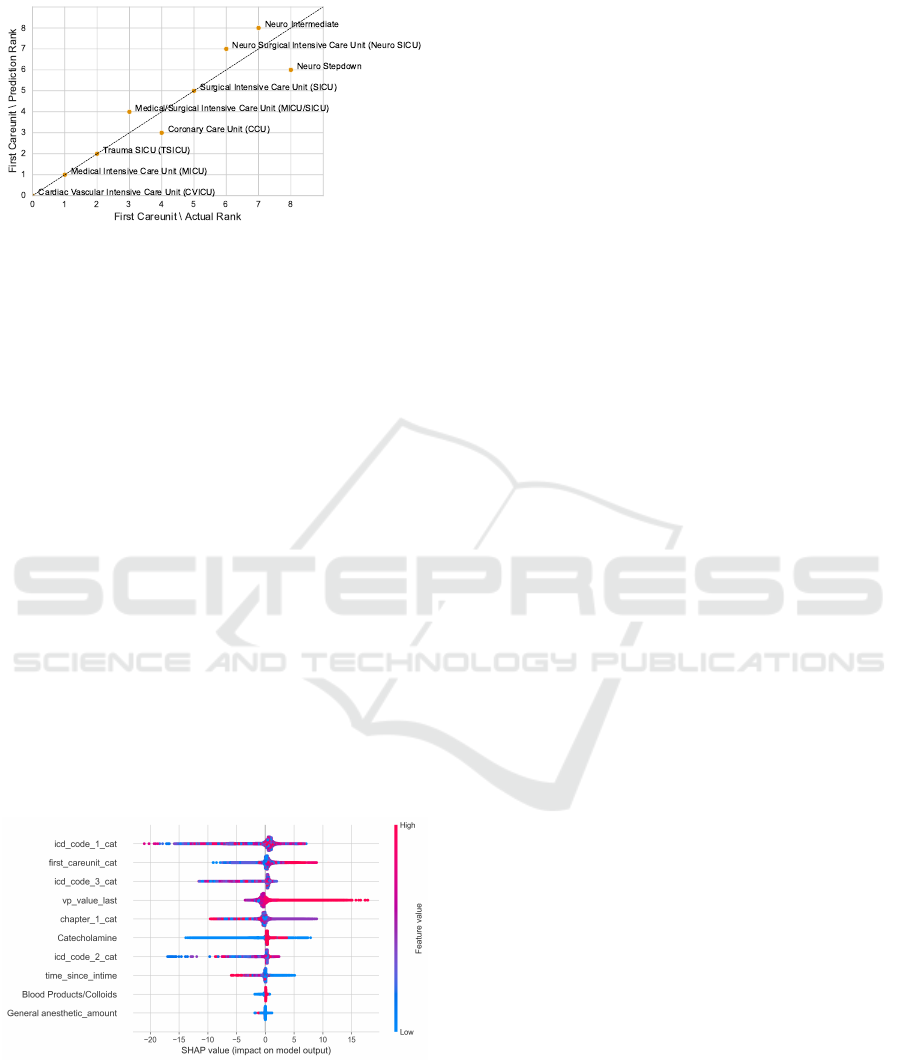
predictions show fewer deviations.
Figure 18: Relation between the predictions and the actual
high NBPs thresholds for the first care unit in the third con-
figuration. We derive the rank from the mean low threshold
for each category. A low mean refers to a low rank. We
can observe a good match between the predictions and the
actual values.
Feature Selection. When performing a feature se-
lection and only selecting the ten most important fea-
tures, the first ICD code scores the highest impact
(Figure 19). Five features appear in the feature se-
lection process of all four models: The first and third
ICD code, the first care unit, the last measured vital
parameter before the threshold setting, as well as the
previously administered amount for general anaes-
thetics. Furthermore, the time since intime, the sec-
ond ICD code, as well as the first ICD chapter, are se-
lected as the ten most important features in three out
of four models, including NBPs high. The time since
blood products/colloids and catecholamine were ad-
ministered are the two remaining features in the se-
lection process for the NBPs high model. Therefore,
the ten most important features of the low HR model
and the high NBPs model are all shared by at least one
other model (Table 3).
Figure 19: SHAP beeswarm plot for the high NBPs model
with previous feature selection.
5 DISCUSSION
By using CatBoost and SHAP values we are able
to present a generic recommender system for alarm
thresholds. In the current practice, default values are
predominantly used to set healthy ranges. Medical
staff must adjust thresholds manually and at their own
discretion, often lacking good standards (Chambrin,
2001). Incorporating recommender systems in clin-
ical practice can provide patient-centred thresholds
and reduce non-actionable alarms.
5.1 Limitations
We divided the limitations into two areas. The first
relates to the data set. The second refers to the bound-
aries of our approach.
Data Quality. Since MIMIC-IV is a single-centre
database, there is a risk of overfitting this patient co-
hort. Thus, this is a retrospective study that should be
supplemented by a prospective study in the future. In
addition, some groups are only represented to a small
extent (for example, the native ethnicity or patients
under 20 years of age), which reduces the general-
isability of these results. In addition, there are data
quality issues in MIMIC-IV that suggest, for exam-
ple, input errors in the threshold value entry and thus
affect the results. We conducted cleaning steps prior
to the analysis but this does not guarantee clinically
valid thresholds. The biggest limitation is the ten-
dency to default thresholds also in MIMIC-IV. There-
fore, the model in particular can only make patient-
centred predictions as far as the data basis allows.
Defined Boundaries. Feature engineering mani-
fests the most relevant boundary of our approach: Our
feature creation process does not consider all possi-
ble relevant influences. Future work could extend the
number of features, for example by adding laboratory
values or patient output (e.g. urine). Also, further
medication classes such as antibiotics or cardiovascu-
lar agents could be included via the MIMIC-IV cate-
gory or the SNOMED CT mapping.
We could not perform an external validation on a
second data set. Other prominent ICU databases such
as eICU CRD (Pollard et al., 2018) or HiRID (Fal-
tys et al., 2021) do not provide alarm thresholds. We
outline a possible approach to incorporate them in the
next section. Lastly, we do not analyze the thresh-
olds in terms of clinically relevant alarms. Ideally, we
knew whether a threshold violation led to a clinically
relevant alarm and focus only on those.
Recommender System for Alarm Thresholds in Medical Patient Monitors
83

Table 3: List of the ten most important features across all four models. There is a high tendency that features important in one
model (e.g. HR Low) are also important in the other models (e.g. HR High and NBPs Low).
Feature HR Low HR High NBPs Low NBPs High
First ICD Code x x x x
Third ICD Code x x x x
First Care Unit x x x x
Last Measured HR/NBPs x x x x
General Anaesthetics (Amount) x x x x
ICD Version of First Code x x x
Time Since Intime x x x
Second ICD Code x x x
First ICD Chapter x x x
Blood Products /Colloids (Time) x x
Catecholamine (Time ) x x
Catecholamine (Amount) x
General Anaesthetics (Time) x
Ethnicity x
Admission Type x
5.2 Future Work
This work provides several touch points for future re-
search toward the automation of smart alarm thresh-
olds. The straightforward addition is the inclusion of
additional features available in MIMIC-IV.
Since there are few databases containing the
threshold values, it would also be possible to extend
the approach to a semi-supervised ML approach. For
example, an existing MIMIC-IV trained model could
be used to predict thresholds, for example, the eICU
CRD database. The results could in turn be used to
re-train the model.
Before applying the model in a practical environ-
ment, the focus should be on real-time implementa-
tion. For example, it needs to be clarified whether
threshold values are recalculated at fixed intervals –
e.g., every two minutes – to detect changes in the pa-
tient, or whether there are event-based indicators for
recalculation – e.g., an increase in the dose of a medi-
cation. Furthermore, it must be ensured that all infor-
mation used in the model is available very promptly
and is not available in the system with a long-time
delay.
6 CONCLUSION
Patient-specific alarm thresholds are necessary – both
for patient-centred medical care but also to alleviate
the long-standing problem of alarm fatigue in inten-
sive care medicine. Our work is the first step towards
smart alarm thresholds that take into account each pa-
tient’s specific need rather than relying on a set of
default values. When incorporated into patient moni-
tors, our method will make intensive care units quieter
and more efficient wards.
REFERENCES
CatBoost (2017). Catboost - open-source gradient boost-
ing library. https://catboost.ai/news/catboost-now-
available-in-open-source. Last checked on Mai 30,
2022.
Chambrin, M. C. (2001). Alarms in the intensive care unit:
how can the number of false alarms be reduced? Crit-
ical care (London, England), 5(4):184–188.
Chen, T. and Guestrin, C. (2016). Xgboost: A scalable
tree boosting system. In Proceedings of the 22nd
ACM SIGKDD International Conference on Knowl-
edge Discovery and Data Mining, KDD ’16, pages
785–794, New York, NY, USA. ACM.
Dorogush, A. V., Ershov, V., and Gulin, A. (2018). Cat-
boost: gradient boosting with categorical features sup-
port. https://arxiv.org/pdf/1810.11363.
Drew, B. J., Harris, P., Z
`
egre-Hemsey, J. K., Mammone,
T., Schindler, D., Salas-Boni, R., Bai, Y., Tinoco, A.,
Ding, Q., and Hu, X. (2014). Insights into the problem
of alarm fatigue with physiologic monitor devices: a
comprehensive observational study of consecutive in-
tensive care unit patients. PloS one, 9(10):e110274.
Faltys, M., Zimmermann, M., Lyu, X., H
¨
user, M., Hyland,
S., R
¨
atsch, G., and Merz, T. (2021). Hirid, a high
time-resolution icu dataset. https://doi.org/10.13026/
NKWC-JS72.
Fry, B. J. (2004). Computational information design. PhD
thesis, Massachusetts Institute of Technology.
Gonz
´
alez-N
´
ovoa, J. A., Busto, L., Rodr
´
ıguez-Andina, J. J.,
HEALTHINF 2023 - 16th International Conference on Health Informatics
84

Fari
˜
na, J., Segura, M., G
´
omez, V., Vila, D., and Veiga,
C. (2021). Using explainable machine learning to
improve intensive care unit alarm systems. Sensors
(Basel, Switzerland), 21(21).
Harutyunyan, H., Khachatrian, H., Kale, D. C., Ver Steeg,
G., and Galstyan, A. (2019). Multitask learning and
benchmarking with clinical time series data. Scientific
Data, 6(1):96.
Johnson, A., Bulgarelli, L., Pollard, T., Horng, S., Celi,
L. A., and Mark, R. (2021). Mimic-iv. https://doi.org/
10.13026/S6N6-XD98.
Ke, G., Meng, Q., Finley, T., Wang, T., Chen, W., Ma, W.,
Ye, Q., and Liu, T.-Y. (2017). Lightgbm: A highly
efficient gradient boosting decision tree. Advances
in neural information processing systems, 30:3146–
3154.
Kong, S. H., Ahn, D., Kim, B. R., Srinivasan, K., Ram, S.,
Kim, H., Hong, A. R., Kim, J. H., Cho, N. H., and
Shin, C. S. (2020). A novel fracture prediction model
using machine learning in a community-based cohort.
JBMR plus, 4(3):e10337.
Lundberg, S. M. and Lee, S.-I. (2017). A unified approach
to interpreting model predictions. In I. Guyon, U. Von
Luxburg, S. Bengio, H. Wallach, R. Fergus, S. Vish-
wanathan, and R. Garnett, editors, Advances in Neural
Information Processing Systems, volume 30. Curran
Associates, Inc.
McIlwraith, D., Marmanis, H., and Babenko, D. (2016). Al-
gorithms of the intelligent web. Manning Publications
Co, Shelter Island NY, second edition edition.
NBER (2022). Icd-9-cm to and from icd-10-cm and icd-
10-pcs crosswalk or general equivalence mappings.
https://www.nber.org/research/data/icd-9-cm-and-
icd-10-cm-and-icd-10-pcs-crosswalk-or-general-
equivalence-mappings. Last checked on Jun 14,
2022.
NIH (2022). Overview of snomed ct. https:
//www.nlm.nih.gov/healthit/snomedct/snomed
overview.html. Last checked on Mai 31, 2022.
Pelter, M. M., Suba, S., Sandoval, C., Z
`
egre-Hemsey, J. K.,
Berger, S., Larsen, A., Badilini, F., and Hu, X. (2020).
Actionable ventricular tachycardia during in-hospital
ecg monitoring and its impact on alarm fatigue. Crit-
ical Pathways in Cardiology: A Journal of Evidence-
Based Medicine, 19(2):79–86.
Pollard, T. J., Johnson, A. E. W., Raffa, J. D., Celi, L. A.,
Mark, R. G., and Badawi, O. (2018). The eicu col-
laborative research database, a freely available multi-
center database for critical care research. Scientific
Data, 5:180178.
Prokhorenkova, L., Gusev, G., Vorobev, A., Dorogush,
A. V., and Gulin, A. (2017). Catboost: unbiased
boosting with categorical features. https://arxiv.org/
pdf/1706.09516.
Schmid, F., Goepfert, M. S., Kuhnt, D., Eichhorn, V.,
Diedrichs, S., Reichenspurner, H., Goetz, A. E., and
Reuter, D. A. (2011). The wolf is crying in the operat-
ing room: patient monitor and anesthesia workstation
alarming patterns during cardiac surgery. Anesthesia
and analgesia, 112(1):78–83.
Sendelbach, S. and Funk, M. (2013). Alarm fatigue: a pa-
tient safety concern. AACN advanced critical care,
24(4):378–86; quiz 387–8.
SHAP (2022). beeswarm plot — shap latest documen-
tation. https://shap.readthedocs.io/en/latest/example
notebooks/api examples/plots/beeswarm.html. Last
checked on Sep 16, 2022.
Shapley, L. S. (1953). 17. a value for n-person games. In
Kuhn, H. W. and Tucker, A. W., editors, Contributions
to the Theory of Games (AM-28), Annals of Mathe-
matics Studies, pages 307–318. Princeton University
Press, Princeton, NJ.
SNOMED International (2022). Snomed
ct - clinical finding (finding). https:
//browser.ihtsdotools.org/?perspective=
full&conceptId1=404684003&edition=MAIN/
2022-05-31&release=&languages=en. Last checked
on Mai 31, 2022.
Suba, S., Sandoval, C. P., Z
`
egre-Hemsey, J. K., Hu, X.,
and Pelter, M. M. (2019). Contribution of electrocar-
diographic accelerated ventricular rhythm alarms to
alarm fatigue. American journal of critical care : an
official publication, American Association of Critical-
Care Nurses, 28(3):222–229.
Torres, F. (2022). Laboratory for computational physiology.
https://lcp.mit.edu/mimic. Last checked on Mai 28,
2022.
WHO (2022). International classification of diseases
(icd). https://www.who.int/standards/classifications/
classification-of-diseases. Last checked on Mai 31,
2022.
Yu, G., Li, Z., Li, S., Liu, J., Sun, M., Liu, X., Sun, F.,
Zheng, J., Li, Y., Yu, Y., Shu, Q., and Wang, Y. (2020).
The role of artificial intelligence in identifying asthma
in pediatric inpatient setting. Annals of translational
medicine, 8(21):1367.
Zhao, Q.-Y., Liu, L.-P., Luo, J.-C., Luo, Y.-W., Wang, H.,
Zhang, Y.-J., Gui, R., Tu, G.-W., and Luo, Z. (2020).
A machine-learning approach for dynamic prediction
of sepsis-induced coagulopathy in critically ill pa-
tients with sepsis. Frontiers in medicine, 7:637434.
Recommender System for Alarm Thresholds in Medical Patient Monitors
85
