
Machine Learning Algorithm Development and Metrics Extraction from
PPG Signal for Improved Robustness in Wearables
Pedro Veiga
1,2 a
, Rui Varandas
1 b
and Hugo Gamboa
2 c
1
PLUX Wireless Biosignals S.A., 1050-059 Lisboa, Portugal
2
LIBPhys (Laboratory for Instrumentation, Biomedical Engineering and Radiation Physics),
Faculdade de Ci
ˆ
encias e Tecnologia, Universidade Nova de Lisboa, 2829-516 Caparica, Portugal
Keywords:
Photoplethysmography, Pulse Oximetry, Machine Learning, Signal Quality, Heart Rate, Respiratory Rate,
SpO
2.
Abstract:
Wearable devices application in the digital measurement of health has gained attention by researchers. These
devices allow for data acquisition during real-life activities, resulting in higher data availability. They often in-
clude photoplethysmography (PPG) sensors, the sensor behind pulse oximetry which is a non-invasive method
for continuous oxygen saturation measurements, an essential tool for managing patients undergoing pulmonary
rehabilitation and an effective method for assessing sleep-disordered breathing. However, the current market
focuses on heart rate measurements and lacks the robustness of clinical applications for SpO
2
assessment. The
most common obstacle in PPG measurements is the signal quality. Thus, in this work a solution was devel-
oped to evaluate the signal in three distinct qualities. A Random Forest classifier achieved accuracy scores of
79%, 80% for the models capable of differentiating between usable and unusable signals, and of 74% and 80%
when distinguishing between optimal and suboptimal signals. Multi-class models achieved accuracy scores of
66% and 65%. Three clinically relevant metrics were also extracted from the PPG signal. The heart rate and
respiratory rate algorithms resulted in performances similar to the ones found in the literature. However, while
promising, more data is needed to reach statistical significance for the SpO
2
measurement.
1 INTRODUCTION
With recent advancements of technology, wearable
devices have gained mass public attention, being es-
timated that there would be over 1 billion wear-
ables worldwide by 2022 (Allen and Kyriacou, 2021)
and being an industry evaluated in US$100 bil-
lion (Thompson, 2022). Wearable devices have been
gaining traction in the health research community due
to their potential to monitor health-related indicators
continuously during real-life, resulting in more rep-
resentative datasets (Nelson and Allen, 2019), at the
cost of data quality. These typically include vari-
ous sensors, e.g., accelerometers, GPS, gyroscope and
photoplethysmography (PPG) sensors. Specifically,
71% of consumer wearables have been reported to be
equipped with a PPG sensor (Henriksen et al., 2018),
the sensor behind pulse oximetry.
Pulse oximetry is a non-invasive method for con-
tinuous oxygen saturation (SpO
2
) measurements. It
a
https://orcid.org/0000-0002-9359-8026
b
https://orcid.org/0000-0002-0237-3412
c
https://orcid.org/0000-0002-4022-7424
is a standard monitor for all anesthesia procedures in
most developed countries, it is used in emergency de-
partments and ambulances to assess blood oxygena-
tion (Torp et al., 2021), it is used to manage patients
undergoing pulmonary rehabilitation, and for assess-
ing sleep-disordered breathing. However, the cur-
rent wearable market focuses on heart rate measure-
ment, lacking the robustness of clinical applications
for SpO
2
measurements and, thus, most of them lack
medical certification (Torp et al., 2021).
1.1 Pulse Oximetry
Pulse oximetry is based on PPG, which is a device
consisting of a light source and a detector, in which
the light source is usually one or more LEDs of differ-
ent wavelengths and intensities. This sensor measures
volume changes in blood vessels during the cardiac
cycle and estimate vital signs, such as heart rate (HR),
respiratory rate (RR) and SpO
2
(Allen and Kyriacou,
2021). During measurement, the arterial blood is the
main factor of changes in the detected light intensity,
since most other components of tissue and blood re-
main unchanged, thus, their light attenuation remains
178
Veiga, P., Varandas, R. and Gamboa, H.
Machine Learning Algorithm Development and Metrics Extraction from PPG Signal for Improved Robustness in Wearables.
DOI: 10.5220/0011635900003414
In Proceedings of the 16th International Joint Conference on Biomedical Engineering Systems and Technologies (BIOSTEC 2023) - Volume 4: BIOSIGNALS, pages 178-185
ISBN: 978-989-758-631-6; ISSN: 2184-4305
Copyright
c
2023 by SCITEPRESS – Science and Technology Publications, Lda. Under CC license (CC BY-NC-ND 4.0)

constant (Allen and Kyriacou, 2021). This results in
a signal with a direct current (DC) component and an
alternated current (AC) component, as seen in Fig-
ure 1.
Figure 1: Sources of light attenuation in tissue and blood
and respective PPG waveform. From (Tamura et al., 2014).
Pulse oximetry requires light with at least two dis-
tinct wavelengths in such a way that the extinction
coefficients of the two hemoglobins able to bind with
O
2
molecules (Hb and HbO
2
) are different (Allen and
Kyriacou, 2021). By isolating the AC component of
the PPG signal for each wavelength, and normalizing
with their DC component, it is possible to calculate
the ratio of ratios, R, described as:
R =
AC
λ
1
/DC
λ
1
/
AC
λ
2
/DC
λ
2
(1)
Where AC and DC correspond to the pulsatile and
non-pulsatile components of the signal, respectively,
and λ
1
and λ
2
refer to both LEDs wavelengths used.
This ratio is related with the SpO
2
value but the an-
alytical relationship has several inherent issues and,
usually, an empirical calibration curve is determined
during the development of the device (Allen and Kyr-
iacou, 2021).
The most common and difficult limitation in
the PPG signal is the presence of motion artifacts
(MAs) (Petterson et al., 2007). These artifacts, caused
by voluntary or involuntary movement, can hide the
real signal with noise, making its interpretation im-
possible. In a clinical setting, this can increase the
number of false alarms, diminishing their importance
and increasing caregiver workload, stress, and patient
care (Petterson et al., 2007). Many automatic signal
quality assessment techniques using Machine Learn-
ing (ML) have been successfully implemented (Allen
and Kyriacou, 2021; Karlen et al., 2013; Prasun et al.,
2022). Most of the current research uses binary clas-
sification to distinguish between corrupted and not-
corrupted signal, but this may not be the most correct
approach as a lightly corrupted PPG signal can still
provide useful information, such as the HR. As an al-
ternative, (Prasun et al., 2022) classified the signals
into three different classes (’clean’, ’partially clean’
and ’corrupt’) for a more accurate evaluation.
Hence, in this work a solution that allows the im-
provement of pulse oximetry in wearable devices is
proposed. The main objectives are: (1) To detect the
signal quality in real-time, with a minimal use of sen-
sors and computational power; (2) Extract three bi-
ological metrics, namely, heart rate, respiration rate
and SpO
2
.
2 METHODS
2.1 Data Acquisition
In this work, two protocols were developed. For both
protocols, an ECG, a respiratory inductive plethysmo-
graph (RIP), SpO
2
and accelerometer sensors from
PLUX Wireless Biosignals S.A. were acquired and
the OpenSignals (r)evolution software was used. The
ECG sensor with three electrodes and a RIP sensor
were placed according to Figure 2. The SpO
2
and
accelerometer sensors were placed on the posterior
plane of the wrist where the subject would wear a
watch, to mimic a smartwatch placement. The SpO
2
sensor has a red and an IR LED, with wavelengths
of 660 nm and 950 nm respectively, and works in re-
flectance mode. All the sensors were sampled with a
frequency of 200 Hz.
Figure 2: Sensors placement. The RIP band was located
in the lower thoracic region and the three ECG electrodes
were placed below it in an inverted lead I configuration.
The first protocol was developed to simulate real-
world activities, with a two minute pause between ev-
ery task. The tasks performed were: typing in a com-
puter, writing by hand and a simple walk with natural
arm movement. To estimate the SpO
2
value, a second
protocol was developed with two rounds of the Wim
Hof Method breathing exercises, which allows longer
apnea periods than in normal circumstances, causing
the SpO
2
to drop (Citherlet et al., 2021). An addi-
tional Contec CMS50D+ Pulse Oximeter (CONTEC,
nd) sensor was used as reference and placed in the non
dominant hand to minimize movement.
2.2 Data Processing
Firstly, there is a need to process the acquired data
before extracting important information. According
Machine Learning Algorithm Development and Metrics Extraction from PPG Signal for Improved Robustness in Wearables
179
to (Allen and Kyriacou, 2021), the PPG bandwidth
is up to 5 Hz, and all relevant signal characteristics
could be extracted within this frequency range. The
signal’s DC component can also be removed by us-
ing a high-pass filter, with cut-off frequency up to
0.5 Hz (Allen and Kyriacou, 2021). Therefore, a
5
th
order Butterworth band-pass filter with cutoff fre-
quencies of 0.5 Hz and 10 Hz followed by a 3
rd
order
Butterworth band-stop filter with cutoff frequencies
of 40 Hz and 60 Hz, to remove specific noise gener-
ated by nearby electronic devices, were applied.
The data was subsequently divided into 3 s win-
dows. For an analysis closer to real time, a sliding
window with 2 s overlap was used, i.e., for each block,
there are 2 s of data common with the previous block.
For each window, a min-max normalization and a z-
score standardization step was performed.
2.3 Manual Quality Assessment
To train a supervised ML model for quality assess-
ment, the PPG data was manually evaluated before-
hand. This evaluation was done on a continual ba-
sis, providing more flexibility when choosing the win-
dow size since all samples have a corresponding qual-
ity. For this rating, the ECG signal was also used to
help assess where there were expected peaks in the
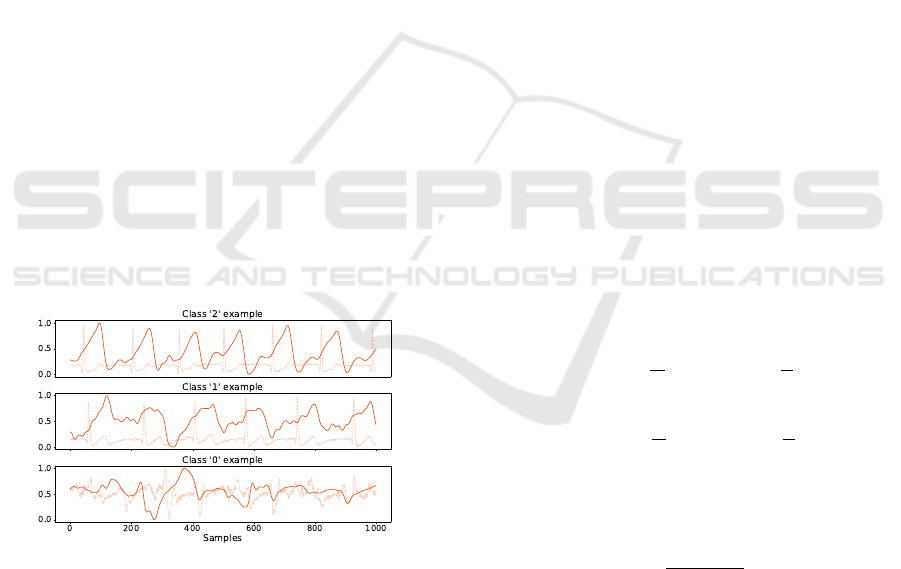
PPG signal. The data was divided into three qualities:
classes ’2’, ’1’ and ’0’ representing optimal quality,
suboptimal quality and corrupted signal, respectively,
with an example of each represented in Figure 3.
Figure 3: Data quality examples. It is also possible to see
the ECG signal, used for the manual evaluation.
To establish the quality of each window, three in-
terpretations were developed:
’Average’ Quality. The quality of the window is the
average quality of every sample in that window.
This value is then rounded to the nearest integer.
’Strict Average’ Quality. This interpretation is simi-
lar to the ’Average’ quality. However, if the block
has more than a third of its quality with class ’0’,
its quality was automatically class ’0’.
’Mode’ Quality. The quality of the block is the the
statistical mode quality in that window.
2.4 Feature Extraction
Although multiple signals were acquired, the charac-
teristics were only extracted from the SpO
2
sensor.
This was done intentionally to minimize the use of ex-
ternal sensors. This independence simulates a wear-
able device and opens the possibility of, in the future,
applying this algorithm to this sensor in specific. The
features were extracted from the red and IR channels
separately, except for the R ratio, which uses informa-
tion from both channels.
DC Component. The average of the unfiltered sig-
nal.
Peak-to-peak (PTP) Component. The subtraction
of the standardized signal maximum and mini-
mum.
Mean and Standard Deviation. The mean and stan-
dard deviation from the normalized signal.
Median. The median from the standardized signal.
R Ratio. The ratio presented in Equation 1.
Skewness and Kurtosis SQI. Measures of the sym-
metry and the peakness of the standardized signal
distribution, respectively. The expressions used
for computing S
SQI
and K
SQI
are represented in
Equation 2 and Equation 3, where N, µ and σ rep-
resent the number of samples, mean and standard
deviation of the signal, respectively.
S
SQI
=
1
N
N
∑
i=1
h
signal
i
−
µ
σ
i
3
(2)
K
SQI
=
1
N
N
∑
i=1
h
signal
i
−
µ
σ
i
4
(3)
Perfusion SQI. Ratio of pulsatile blood (PTP com-
ponent) to non-pulsatile blood (DC component).
P
SQI
=
signal
PT P
signal
DC
× 100 (4)
2.4.1 Feature Selection
Feature selection is an important and commonly used
technique for dimension reduction by removing un-
necessary features from data (Bonaccorso, 2017).
This approach can also provide a different under-
standing of the problem by ranking the different fea-
tures. A method based on Pearson correlation was
used which is a technique used to describe the rela-
tionship between two variables. It is recommended to
BIOSIGNALS 2023 - 16th International Conference on Bio-inspired Systems and Signal Processing
180

eliminate redundant or highly correlated features, as
a dataset with correlated features increases computa-
tional complexity and can reduce the overall perfor-
mance of models (Bonaccorso, 2017).
2.5 Metrics Extraction
For the HR and RR estimation only one channel is
needed, hence there can be more than one estimate for
each window. To choose the final HR
estm
and RR
estm
,
the window quality from both channels is rounded
to the nearest integer (simulating the classifiers de-
veloped). Then, the estimate from the channel with
the best quality is selected. If both channels have the
same quality, the algorithm averages both estimates.
2.5.1 HR Extraction
The HR is easily detected in the PPG signal as its peri-
odicity is derived from the heartbeat. The current gold
standard method for HR estimation is the ECG (Nel-
son and Allen, 2019), therefore its results were used
as reference. This metric was calculated using the
windows previously used for quality assessment. Us-
ing the BioSPPy Python package (Carreiras et al.,
2015), the R-peaks are extracted from the ECG sig-
nal. Then, using the average difference of the peaks
present in the window, the HR
ref
was calculated.
When extracting the HR from the PPG signal,
since it does not need the signal features, a stricter
filter could be applied. Hence, a 3
rd
order Butter-
worth band-pass filter was used. Several cutoff fre-
quencies were tested, with the lower frequency being
0.5 Hz and the high frequency varying between 3 and
5 Hz. The PPG peaks were then determined using the
BioSPPy Python package (Carreiras et al., 2015). Us-
ing the average difference from the peaks present in
the window, the HR was calculated for both the red
(HR
red
estm
) and infrared (HR
ir
estm
) channels.
2.5.2 RR Extraction
RR can also be estimated from the PPG signal. Mul-
tiple articles use capnometry as the reference method
for RR estimation (Karlen et al., 2013). However,
in this work a RIP band was used. Due to the al-
gorithms used and the acceptable RR frequencies
(0.067-1.08 Hz), a 32 s sliding window with 31 s
overlap was used. For the RR
ref
estimation, firstly, a
3
rd
order Butterworth band-pass filter with cutoff fre-
quencies of 0.1 Hz and 2 Hz was applied to the RIP
signal. Then, an adapted algorithm from the Biosppy
package (Carreiras et al., 2015) was used to calculate
RR
ref
. This algorithm finds the zero-crossings of the
standardized signal, ignoring the crossings that have
a higher frequency than 1.3 Hz.
The approach used to calculate the RR
estm
was
similar to that used by (Karlen et al., 2013). Along
with the original filter, three additional filters with
different cutoff frequencies were also tested. Then,
the peaks and valleys of the PPG signal were found
using the BioSPPy Python package (Carreiras et al.,
2015). Using these values, three respiratory-induced
variations (RIV) were calculated: respiratory-induced
intensity variation (RIIV), respiratory-induced fre-
quency variation (RIFV) and respiratory-induced am-
plitude variation (RIAV). These RIV are then pro-
cessed individually and the peak frequency in the ex-
pected respiratory frequency range (0.067-1.08 Hz)
for each RIV is calculated using a FFT. The accepted
peak frequencies of the three variations are averaged,
resulting in RR
red
estm
and RR
ir
estm
.
2.5.3 SpO
2
Extraction
The PPG sensor can also be used to estimate the
SpO
2
. A commercially available pulse oximeter,
Contec CMS50D+, was used as reference. The PPG
signal and the SpO
2
value are related by the ratio of
ratios R, represented in Equation 1. An alternative R
ratio was also tested, with the expression presented in
Equation 5.
R =
log
DC
λ
1
+AC
λ
1
DC
λ
1
log
DC
λ
2
+AC
λ
2
DC
λ
2
(5)
The R ratio is calculated for every pulse in a win-
dow and then averaged, along with the SpO
2 ref
value.
Different window sizes were tested. For the R ratio
calculation, the peaks and valleys were determined
in the filtered signal using BioSPPy Python pack-
age (Carreiras et al., 2015). Then, the AC compo-
nent corresponds to the valley-peak amplitude, while
the DC component corresponds to the average value
from the peak and valley of the raw signal.
A Ridge Regression (Boehmke and Greenwell,
2019) was used to relate the R ratios to the SpO
2 ref
and produce a SpO
2 estm
.
3 RESULTS
3.1 Data Acquisition
All data was manually evaluated with respect to qual-
ity and there was a slight variation on the prevalence
of each quality according to the employed interpre-
tation, as illustrated in Table 1. The ’Strict Average’
Machine Learning Algorithm Development and Metrics Extraction from PPG Signal for Improved Robustness in Wearables
181
quality lead to a large portion of the windows to be
classified as low-quality and, therefore, this interpre-
tation will not be further analyzed. For the first proce-
dure described in Section 2.1, five individuals (4 men)
between 20 and 23 years of age (mean = 21.4, stan-
dard deviation = 1.0) were recruited. Manual evalu-
ation revealed that two subjects had little or no data
evaluated as Class ’2’ and thus they were excluded
from the ML development.
Table 1: Results of the manual quality evaluation indicating
the prevalence of the different quality interpretations.
Samples
’Average’ ’Strict Average’ ’Mode’
Red
signal
Class ’0’ 74.00 % 73.51 % 93.75 % 74.51 %
Class ’1’ 17.09 % 18.57 % 5.05 % 16.70 %
Class ’2’ 8.91 % 7.92 % 1.20 % 8.79 %
Infrared
signal
Class ’0’ 61.65 % 60.36 % 92.45 % 61.64 %
Class ’1’ 19.18 % 21.70 % 5.60 % 19.20 %
Class ’2’ 19.17 % 19.94 % 19.95 % 19.16 %
3.2 Feature Selection
Figure 4 presents the correlation between all features
and the quality of the two channels. Only the ’Av-
erage’ quality is presented since the order did not
change in the ’Mode’ quality. The top four corre-
lated features with the red channel quality are from
the IR channel, indicating that the red channel classi-
fiers may use IR information for better results. Fig-
ure 4 also shows that the features least correlated with
the IR channel quality belong to the red channel, thus,
the IR classifiers that use all features can be disturbed
by these features.
Figure 4: Correlation between all the features and the ’Av-
erage’ quality from the red and IR channels, on the top and
bottom respectively.
3.3 Classification Models
Several models were tested with the ’Average’ qual-
ity. The Random Forest (RF) model was chosen for
further optimization because it achieved best prelimi-
nary results. The RF models were tested with differ-
ent numbers of trees generated and maximum depths,
to find the optimal combination. In this work a 10-
fold subject-wise cross-validation was used and there
were three subjects used for developing the ML mod-
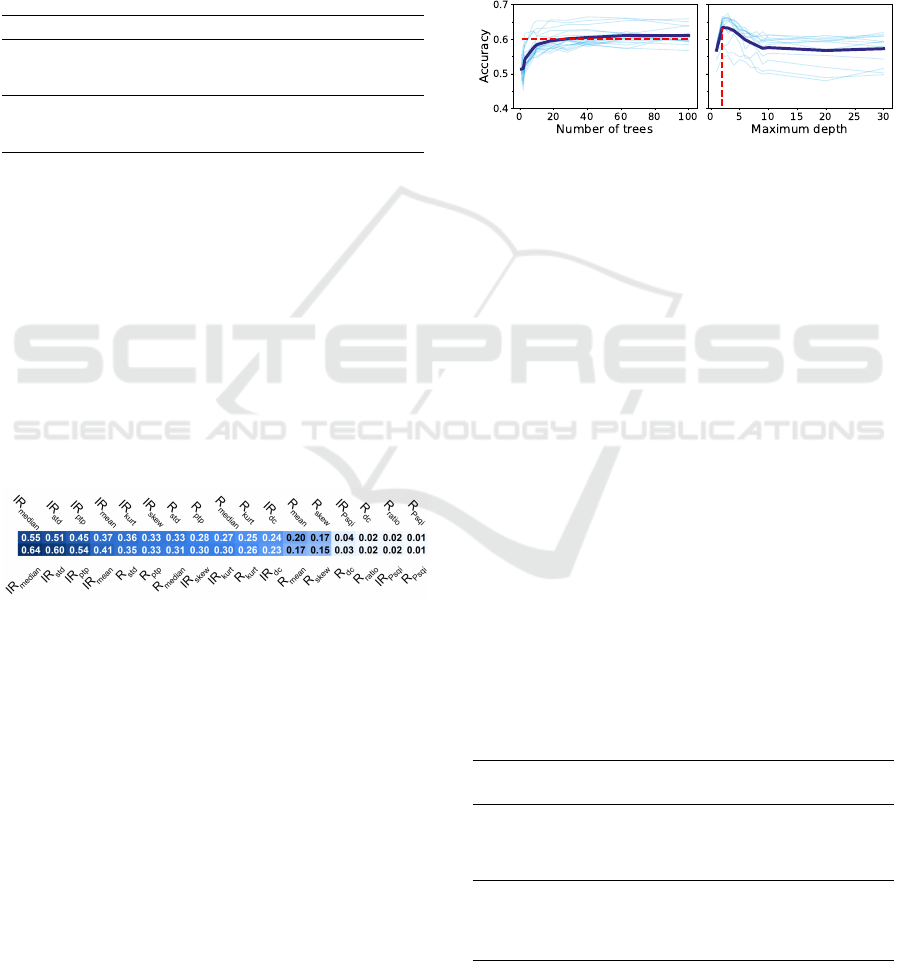
els, thus, each combination was tested 30 times. Vary-
ing the number of trees and maximum depth revealed
that the different models had a similar behavior, as
shown in Figure 5. As expected, the accuracy in-
creases with the number of trees until a plateau. With
the increase on maximum depth, the accuracy has
an initial peak in performance, then stabilizes with a
lower accuracy. The value of this peak varies for the
different cases, with the classifiers for the red channel
benefiting more with lower depths, when comparing
with the IR classifiers. This behavior is explained by
the fact that deep trees have more difficulty generaliz-
ing (Boehmke and Greenwell, 2019).
Figure 5: Accuracy results for the red channel classifier in
function of the number of trees generated (top plot) and the
maximum depth (bottom plot) using the ’Average’ quality
and all features. The lighter blue lines represent the perfor-
mance for the different combinations. The dark blue line
represents the lighter blue lines average. On the top graphic
the red line represents 90% of the accuracy improvement,
represented in 0.60 accuracy. On the bottom graphic the red
line represents the highest accuracy, represented in the max-
imum depth of 3.
Two distinct cases were studied: (1) using features
from both channels to train both classifiers and (2)
training each classifier with features only from the re-
spective channel. By analyzing the results in table 2,
as well as examining Figure 6, models trained with
all features perform better in classifying the quality
of the red channel, as opposed to classifiers with in-
dividual features, which perform better in classifying
the quality of the infrared channel. This can indicate
that the models for the red channel quality rely on the
infrared features for better results and the IR classi-
fiers are disturbed by the features of the red signal,
which was already noted in Section 3.2.
Table 2: Performance for the best classification mod-
els combinations, using features from both and individual
channels, in the top and bottom halves respectively.
Red channel IR channel
’Average’ ’Mode’ ’Average’ ’Mode’
Trees / Depth 40 / 3 63 / 3 100 / 5 100 / 8
Accuracy 0.67±0.05 0.65±0.05 0.62±0.04 0.61±0.06
F-score 0.66±0.05 0.64±0.06 0.62±0.04 0.59±0.06
AUC-ROC 0.83±0.02 0.81±0.02 0.80±0.03 0.78±0.05
Trees / Depth 40 / 3 28 / 2 63 / 40 40 / 7
Accuracy 0.56±0.05 0.55±0.03 0.65±0.03 0.63±0.06
F-score 0.55±0.05 0.54±0.03 0.65±0.04 0.61±0.06
AUC-ROC 0.73±0.06 0.70±0.02 0.81±0.03 0.79±0.04
BIOSIGNALS 2023 - 16th International Conference on Bio-inspired Systems and Signal Processing
182

Figure 6: Confusion matrices for the best classification
models for the red and IR channels using the ’Average’
quality.
3.3.1 Double Classifiers
An alternative studied was the development of a dou-
ble classifier, i.e., one classifier to separate the data
between class ’0’ and ’1 ∪ 2’ classes, and a second
classifier to evaluate between the classes ’1’ and ’2’.
This separation was based on the fact that some physi-
ological information can be extracted from the classes
’1’ and ’2’, unlike the class ’0’. The results in Ta-
ble 3 and Figure 7 show that these models can ac-
curately differentiate between classes ’0’ and ’1 ∪ 2’,
with the red and IR classifiers having, approximately,
80% accuracy. When classifying between classes ’1’
and ’2’, the infrared channel classifiers perform bet-
ter than the red channel classifiers. As stated in Sec-
tions 3.2 and 3.3, the red channel classifiers could
be relying on the infrared features for better results.
This could result in a situation where the red chan-
nel has a different quality than the IR channel, con-
sequently, the red channel classifier would have diffi-
culty in correctly classifying the quality of the corre-
sponding channel.
Table 3: Performance results for the best combinations for
the classification models differentiating between class ’0’
and ’1∪ 2’ and for differentiating between class ’1’ and ’2’,
in the top and bottom halves respectively.
Red channel IR channel
’Average’ ’Mode’ ’Average’ ’Mode’
Trees / Depth 63 / 3 100 / 5 63 / 7 100 / 5
Accuracy 0.80±0.04 0.80±0.04 0.81±0.07 0.80±0.04
F-score 0.80±0.06 0.79±0.03 0.80±0.09 0.79±0.06
AUC-ROC 0.87±0.06 0.86±0.03 0.87±0.08 0.86±0.06
Trees / Depth 100 / 2 100 / 2 28 / 4 100 / 8
Accuracy 0.74±0.09 0.72±0.10 0.75±0.08 0.81±0.07
F-score 0.78±0.06 0.77±0.06 0.76±0.06 0.80±0.09
AUC-ROC 0.80±0.07 0.77±0.09 0.83±0.07 0.87±0.08
One important aspect to consider when using
chained classifiers is the error propagation, i.e., a win-
Figure 7: Confusion matrices for the best classification
models for the red and IR channels for the double classi-
fiers using the ’Average’ quality.
dow with class ’0’ could be wrongly categorized in
the first classifier propagating this error to the second
classifier, therefore the real-world performance could
be worse than the one stated.
3.4 Heart Rate Extraction
Five different filters were tested, with high cutoff fre-
quencies varying between 3 and 7 Hz, along with the
original filter and a stricter filter improved the results,
as shown in Table 4. The results presented can use
two types of data: (1) at least one channel has quality
’2’; (2) at least one channel has quality ’1’ or better.
Windows where both channels are classified as qual-
ity ’0’ were not used since it is assumed that the signal
has no relevant information that can be extracted.
Table 4: HR estimation performance results.
High cutoff
frequency
Both qualities Quality ’2’
MAE
(bpm)
RSME
(bpm)
MAPE
MAE
(bpm)
RSME
(bpm)
MAPE
3 Hz 4.88 11.45 5.84 % 1.40 2.71 1.89 %
4 Hz 4.67 11.14 5.59 % 1.34 2.38 1.81 %
5 Hz 4.53 10.87 5.43 % 1.37 2.40 1.84 %
6 Hz 4.57 10.90 5.51 % 1.38 2.44 1.86 %
7 Hz 4.55 10.79 5.48 % 1.39 2.45 1.88 %
Original 4.85 11.21 5.83 % 1.42 2.37 1.90 %
The results using both qualities can be compared
with the results from commercially available prod-
ucts and can be considered accurate results, as they
have less than 10% of error (Association, 2018). The
Bland-Altman plot in Figure 8 uses the data filtered
using the 0.5 Hz-5 Hz band-pass filter since this filter
had the best performance when using data with both
qualities, the most difficult situation, and it is not pos-
sible to see a systematic under or overestimation of
the HR. Thus, existing errors can arise from false peak
detection in the PPG signal or in the ECG signal.
Machine Learning Algorithm Development and Metrics Extraction from PPG Signal for Improved Robustness in Wearables
183
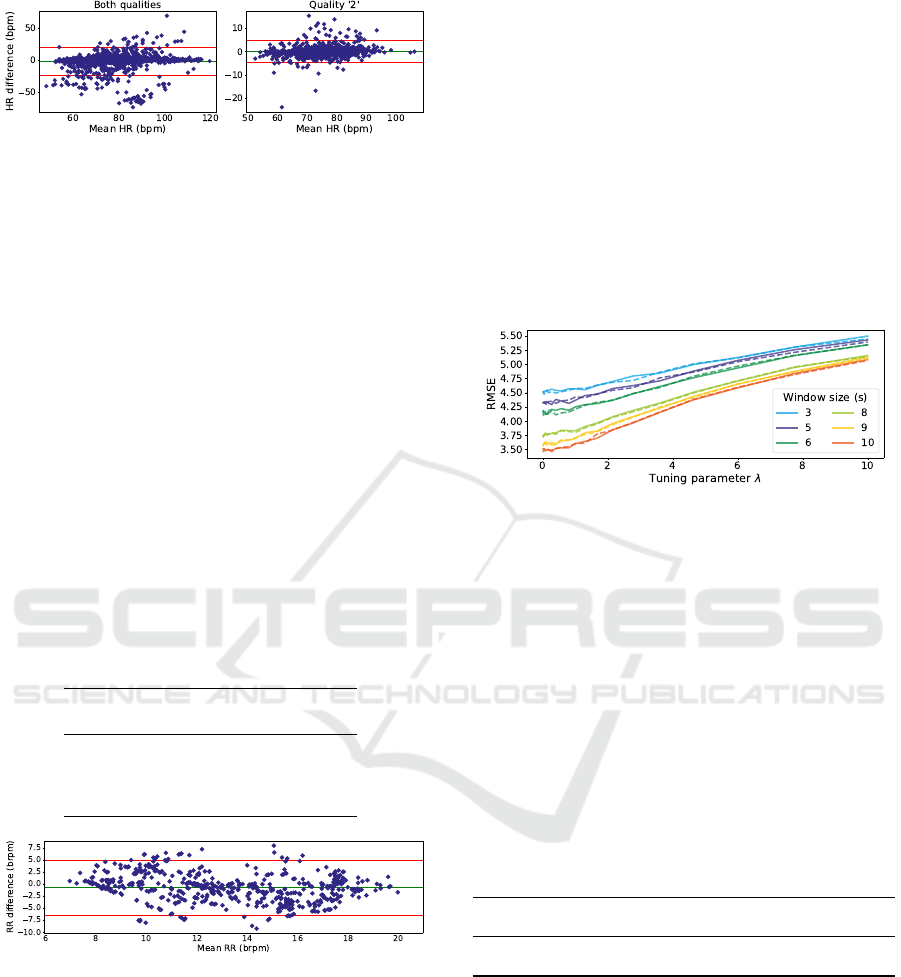
Figure 8: Bland-Altman plot for HR estimation. On left
are represented the estimates for windows with quality ’1’
or ’2’ (−1.50 ± 21.11 bpm). On the right are represented
the estimates for windows with, at least, one channel with
quality ’2’ (0.04 ± 4.70 bpm).
3.5 Respiratory Rate Extraction
The algorithm to estimate this parameter is more sen-
sitive to noise and artifacts, therefore, these estimates
were only calculated for windows with quality ’2’.
Several filters were tested and the original filter had
the best results, as shown in Table 5. These re-
sults were similar to the article on which the devel-
oped algorithm was based, with a RMSE of ≈3 brpm
which the authors considered promising (Karlen et al.,
2013). The proposed algorithm also has some ten-
dency to underestimate the RR, shown as a nega-
tive mean difference of -0.8 brpm in Figure 9. Even
though the results presented are promising, valida-
tion with another reference method and more data is
needed prior to clinical use.
Table 5: RR estimation performance results.
Cutoff
frequencies
MAE
(brpm)
RSME
(brpm)
MAPE
0.05 Hz 4.26 5.21 29.11 %
0.08-3 Hz 3.40 4.20 23.31 %
0.05-5 Hz 4.45 5.46 29.75 %
Original 2.33 3.02 18.17 %
Figure 9: Bland-Altman plot for RR estimation, using the
original filter (-0.829±5.691 brpm).
3.6 SpO
2
Extraction
Several acquisitions were made, all to the same in-
dividual, and only the signals acquired during the
breathing exercises were used. Most of the time, the
subject had an elevated value of SpO
2
which led to us-
ing a random undersampling method, in which, some
data with SpO
2
values greater than 90% were ignored.
Since a linear regression model was used, there was
no division in train and test sets. However, due to the
balancing step present there is some variation in the
data used for each model. As a result, each model
combination (λ - window size - R ratio expression)
was trained 30 times to obtain a better performance
estimate. Figure 10 shows that a bigger λ results in a
higher error, which makes the preferred Ridge model
closer to an Ordinary Least Squares regression. It is
also possible to note that, with an increase in the win-
dow size, there is a decrease in the RMSE. A big-
ger window size results in an average of more R ra-
tios, since this is calculated for every pulse, hence, an
abnormal pulse has less influence on the final SpO
2
value.
Figure 10: RMSE evolution with the increase of the tuning
parameter λ. The line style represents the two expressions
for the R ratio, with the solid and dashed lines representing
Equations 1 and 5, respectively.
Table 6 shows the best models to extract SpO
2
from the R ratio, using a 10 s window. It is pos-
sible to note that the models using both R ratio ex-
pressions have very similar results, with all the vari-
ation inside the error margin. The best model was
used to present more detailed results. The calibration
function is represented in Figure 11, together with a
balanced dataset. This dataset has MAE = 2.646 %
SpO
2
, RMSE = 3.413 % SpO
2
, MAPE = 2.966 % and
R
2
= 0.730.
Table 6: Results for the best SpO
2
extraction models for
both R ratio expressions tested.
R ratio
Tuning
parameter
MAE
(% SpO
2
)
RMSE
(% SpO
2
)
MAPE
(%)
R
2
(1) 0.27 2.63±0.13 3.47±0.14 2.95±0.14 0.72±0.02
(5) 0.00 2.64±0.12 3.46±0.12 2.95±0.13 0.73±0.02
While not perfect, it is possible to see a linear re-
lationship between the R ratio and the % SpO
2
value.
These models are also in accordance with ISO stan-
dards that state that a pulse oximeter should have a
RMSE < 4.0 % (International Organization for Stan-
dardization, 2017). However, there are some issues
with the acquired data: (1) the data was only extracted
from one subject; (2) the reference SpO
2
was mainly
contained in the 80-100 % SpO
2
range. Therefore,
data from more subjects with a wider SpO
2
range are
needed for a more accurate measurement.
BIOSIGNALS 2023 - 16th International Conference on Bio-inspired Systems and Signal Processing
184
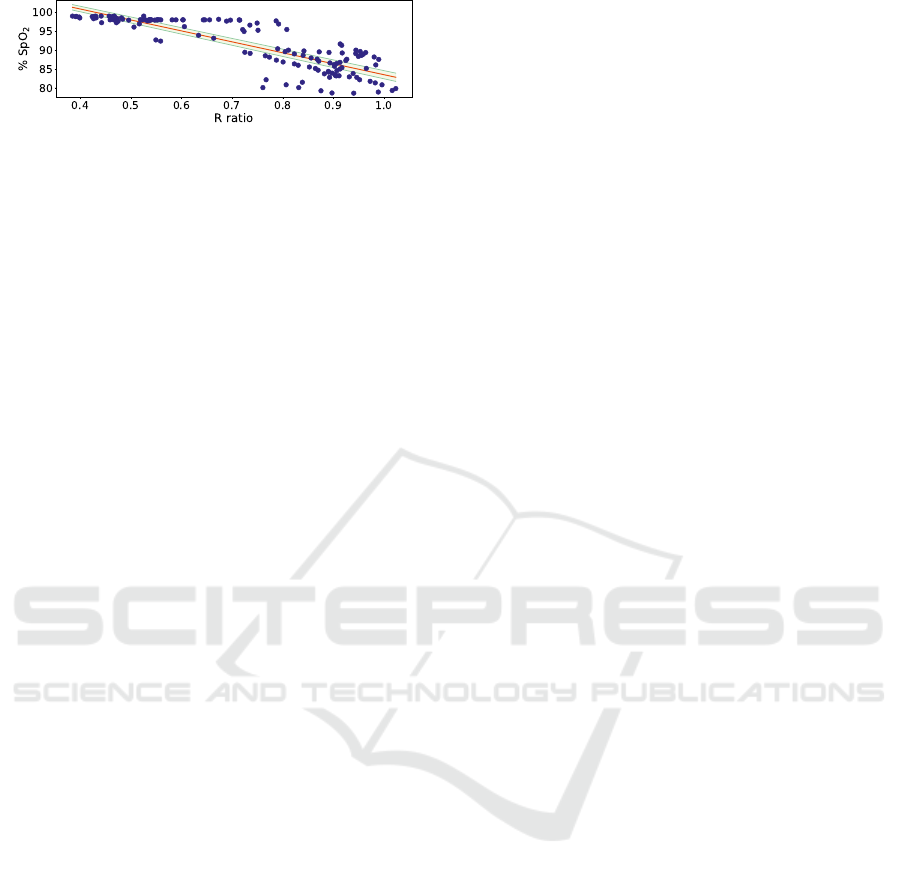
Figure 11: SpO
2
calibration curve. The average linear func-
tion is represented in red with the error space represented in
green.
4 CONCLUSIONS
Wearable devices have been promoted and improved
in the last few years. In addition, their application in
the digital measurement of health has gained attention
by researchers, as they allow for continuous data ac-
quisition in real-world scenarios, however, it could be
at the cost of the signal quality.
A solution for an automatic signal quality evalu-
ation in real-time was developed. This solution di-
vided the data into three separate qualities with sev-
eral classification models developed. The multi-class
classifiers achieved an accuracy double than random
chance, similar to other systems found in the litera-
ture. Two binary chained classifiers were also tested
which also had adequate performance, especially dif-
ferentiating bad quality signals from usable signals.
The HR and RR were also extracted from the PPG
signal. Since there is a prior evaluation of the sig-
nal quality, these metrics are only extracted when the
quality exceeds a threshold, thus avoiding abnormal
values. Both algorithms developed resulted in perfor-
mances similar to those found in the literature and in
other devices currently on the market. A SpO
2
ex-
traction algorithm was also developed. Although the
achieved results are promising, more data is needed to
reach statistical significance.
While this work presents promising results, there
are two big improvements that could be made before
applying the developed algorithms in a real-world de-
vice: (1) Expand the database, since a larger sample
size would provide better statistical significance while
evaluating more correctly the models’ ability to gen-
eralize; (2) A deeper feature engineering phase could
significantly improve the results. An alternative could
be the implementation of features from other sensors,
e.g., the accelerometer which was already acquired
but not used. However, it would lead to a solution that
required a larger number of sensors, thus, more pro-
cessing capacity and increased computational power,
which might be limited by wearables capabilities.
REFERENCES
Allen, J. and Kyriacou, P. A. (2021). Photoplethysmogra-
phy: Technology, Signal Analysis and Applications.
Elsevier.
Association, C. T. (2018). Physical activity monitoring for
heart rate (ansi/cta-2065). Technical report, Consumer
Technology Association.
Boehmke, B. and Greenwell, B. (2019). Hands-on machine
learning with R. Chapman and Hall/CRC, 1 edition.
Bonaccorso, G. (2017). Machine learning algorithms: Ref-
erence guide for popular algorithms for Data Science
and Machine Learning. Packt Publishing.
Carreiras, C., Alves, A. P., Lourenc¸o, A., Canento, F., Silva,
H., Fred, A., et al. (2015). BioSPPy: Biosignal pro-
cessing in Python.
Citherlet, T., Crettaz von Roten, F., Kayser, B., and Guex,
K. (2021). Acute Effects of the Wim Hof Breathing
Method on Repeated Sprint Ability: A Pilot Study.
Frontiers in Sports and Active Living, 3.
CONTEC (n.d.). CONTEC CMS50D Pulse Oximeter. Re-
trieved 27 July, 2022 from https://contecmed.com/
productinfo/602627.html.
Henriksen, A., Mikalsen, M. H., Woldaregay, A. Z., Muzny,
M., Hartvigsen, G., Hopstock, L. A., and Grimsgaard,
S. (2018). Using fitness trackers and smartwatches
to measure physical activity in research: Analysis of
consumer wrist-worn wearables. Journal of Medical
Internet Research, 20(3):e110.
International Organization for Standardization (2017).
Medical electrical equipment – particular require-
ments for basic safety and essential performance of
pulse oximeter equipment (ISO 80601-2-61:2017).
Karlen, W., Raman, S., Ansermino, J. M., and Dumont,
G. A. (2013). Multiparameter respiratory rate estima-
tion from the photoplethysmogram. IEEE Transac-
tions on Biomedical Engineering, 60(7):1946–1953.
Nelson, B. W. and Allen, N. B. (2019). Accuracy of con-
sumer wearable heart rate measurement during an eco-
logically valid 24-hour period: Intraindividual valida-
tion study. JMIR mHealth and uHealth, 7(3):e10828.
Petterson, M. T., Begnoche, V. L., and Graybeal, J. M.
(2007). The effect of motion on pulse oximetry and
its clinical significance. Anesthesia and Analgesia,
105(SUPPL. 6):S78–S84.
Prasun, P., Mukhopadhyay, S., and Gupta, R. (2022). Real-
time multi-class signal quality assessment of photo-
plethysmography using machine learning technique.
Measurement Science and Technology, 33(1):015701.
Tamura, T., Maeda, Y., Sekine, M., and Yoshida, M. (2014).
Wearable photoplethysmographic sensors—past and
present. Electronics, 3(2):282–302.
Thompson, W. R. (2022). Worldwide Survey of Fitness
Trends for 2022. ACSM’s Health and Fitness Jour-
nal, 26(1):11–20.
Torp, K. D., Modi, P., and Simon, L. V. (2021). Pulse
oximetry. Retrived 09 Frebruary, 2022, from
https://www.ncbi.nlm.nih.gov/books/NBK470348/.
Machine Learning Algorithm Development and Metrics Extraction from PPG Signal for Improved Robustness in Wearables
185
