
Measurement of Platelet Aggregation in Ageing Samples and After
in-Vitro Activation
Christian Klenk
1 a
, David Elias Fresacher
1,2 b
, Stefan R
¨
ohrl
2 c
, Dominik Heim
1 d
,
Manuel Lengl
2 e
, Simon Schumann
2 f
, Martin Knopp
1 g
, Klaus Diepold
2 h
,
Stefan Holdenrieder
3 i
and Oliver Hayden
1 j
1
Heinz Nixdorf Chair for Biomedical Engineering, Technical University Munich, Arcisstr. 21, Munich, Germany
2
Chair for Data Processing, Technical University Munich, Arcisstr. 21, Munich, Germany
3
Institute for Laboratory Medicine, German Heart Centre Munich, Lazarettstr. 36, Munich, Germany
Keywords:
Quantitative Phase Imaging, Microfluidics, Haematology, Machine Learning, Thrombocytes, Haemostasis,
Digital Holographic Microscopy, Blood Cells, Flow Cytometry.
Abstract:
Blood cell aggregates are gaining importance as a possible biomarker for various diseases. However, due
to technical limitations of common analysers, mostly only interactions between leukocytes and platelets are
measured directly as aggregates. Interactions between platelets are usually only measured indirectly after using
an activation assay or by analysing surface proteins. Here, an imaging flow cytometer is used to measure and
characterize platelet-aggregates directly in whole blood samples. Influences of sample ageing and in-vitro
activation with adenosine diphosphate (ADP) was investigated for blood anticoagulated with either EDTA,
citrate, heparin or hirudin. Here, the number of platelet-aggregates and their composition was measured.
Blood anticoagulated with hirudin and EDTA showed a stable number of aggregates within a timeframe of 240
minutes. While no aggregate concentration changes were observed in EDTA blood after activation with ADP,
a clear increase in aggregates was seen in hirudin, citrate and heparin blood. This effect is also observable
when looking at the composition of the clots. However, after an initial spike a large number of aggregates
disintegrate within a time frame of nine minutes. This effect is particularly prominent for large aggregates
containing six or more platelets.
1 INTRODUCTION
The analysis of processes in haemostasis is a cru-
cial field for medical diagnostics and the monitoring
of interventions. By understanding the mechanisms
behind haemostasis, specific dysfunctions can be de-
tected and traced back to possible causes.
Haemostasis describes the process of regulating
the formation of blood clots. This can result in the de-
velopment of blood clots, to limit the extent of bleed-
ings. In the opposite scenario, excessive thrombus
a
https://orcid.org/0000-0002-4664-8107
b
https://orcid.org/0000-0002-7650-8033
c
https://orcid.org/0000-0001-6277-3816
d
https://orcid.org/0000-0001-8463-1544
e
https://orcid.org/0000-0001-8763-6201
f
https://orcid.org/0000-0002-7074-473X
g
https://orcid.org/0000-0002-1136-2950
h
https://orcid.org/0000-0003-0439-7511
i
https://orcid.org/0000-0001-9210-7064
j
https://orcid.org/0000-0002-2678-8663
formation must be counteracted to prevent vascular
occlusion. An important role in these processes in-
volves blood platelets (thrombocytes), which are usu-
ally found as single cells and in an inactivated dis-
coid shape. External factors can lead to an activa-
tion of platelets, which leads to a change in their mor-
phology. This process triggers a number of reactions
resulting in the formation of platelet-aggregates, in
other words the cohesion of the platelets by fibrino-
gen (Kamath et al., 2001). If these cell clusters are
not stabilised by fibrin strands, this usually results in
unstable aggregates, which in turn often disintegrate
within a few minutes (Michelson et al., 2001).
Various diseases can influence haemostasis in
such a way that the formation of blood clots is ei-
ther increased or inhibited. Prominent examples are
the hyperactivity of platelets in blood of patients suf-
fering from COVID-19 (Rampotas and Pavord, 2021)
and cardiovascular diseases (Allen et al., 2019) as
well as a reduced haemostasis in haemophilia (Riedl
et al., 2017). In addition, the observation and tar-
geted alteration of blood coagulation through drug
Klenk, C., Fresacher, D., Röhrl, S., Heim, D., Lengl, M., Schumann, S., Knopp, M., Diepold, K., Holdenrieder, S. and Hayden, O.
Measurement of Platelet Aggregation in Ageing Samples and After in-Vitro Activation.
DOI: 10.5220/0011634200003414
In Proceedings of the 16th International Joint Conference on Biomedical Engineering Systems and Technologies (BIOSTEC 2023) - Volume 2: BIOIMAGING, pages 57-65
ISBN: 978-989-758-631-6; ISSN: 2184-4305
Copyright
c
2023 by SCITEPRESS – Science and Technology Publications, Lda. Under CC license (CC BY-NC-ND 4.0)
57

interventions also play a major role in the treatment
of patients. Thus, anticoagulant therapies are used
to specifically inhibit blood coagulation in patients
with various clinical conditions in order to counter-
act complications such as the formation of a thrombus
(Lazaridis et al., 2021; Lazo-Langner et al., 2007).
Nevertheless, it must be noted that an excessive ad-
ministration of these pharmaceutics can lead to in-
creased bleeding events (C¸ ankaya et al., 2021). For
this reason, actions must be considered carefully and
regularly controlled for every patient. A balance in
the treatment with anticoagulants between the risks
of thrombosis and bleeding can only be achieved with
an in-depth knowledge of the patients state of health
(Al-Samkari and Connors, 2019).
As a diagnostic tool of choice, coagulation is usu-
ally determined indirectly with the help of in-vitro
analysers. Those devices determine dynamics in co-
agulation with the help of so-called activation assays.
Here, an activating substance is added to the blood
sample, which starts the process of blood clotting.
The time and dynamics are measured until a certain
sample volume is partially or completely clumped.
The underlying technology for measuring this kind of
assays can be determined both mechanically (Whit-
ing and DiNardo, 2014) and by impedance measure-
ment (Sibbing et al., 2008). Both methods have a
wide range of possible applications but have the dis-
advantage that large sample volumes are usually re-
quired, and partial aspects of coagulation can only be
measured after the use of an activation assay. The
direct measurement of blood cell aggregates is an al-
ternative approach, which generally does not suffer
from these disadvantages. Aggregates can be mea-
sured using many different methods. One prominent
example is the use of a so-called blood smear anal-
ysis (Rampotas and Pavord, 2021). Here, the cells
are presented on a slide, stained and examined under
a microscope. This method provides a high contrast,
but requires trained personnel, time-consuming sam-
ple preparation steps and measures only a statistically
small number of cells. Fluorescent flow cytometry
combines fluorescent staining of blood cells with a
microfluidic system and an optical readout (Michel-
son et al., 2001). This results in a rapid image ac-
quisition and therefore in high numbers of measured
cells in a short time frame. The highly specific bind-
ing of the fluorescent dye labelled antibodies allows
accurate cell identification (Herzenberg et al., 2000).
However, a major disadvantage is the low spatial res-
olution and the cost and time intensive staining. Es-
pecially the low spatial resolution makes a detection
of small platelet-aggregates difficult.
Here, we present a method that combines the high
spatial resolution of an imaging method like the blood
smear analysis with the level of automation in fluo-
rescent flow cytometry by combining a quantitative
phase contrast microscope with a microfluidic sys-
tem and an adapted image analysis. This not only al-
lows the measurement of aggregates in high through-
put and without staining, but also allows a quantita-
tive characterisation of their single components. In
the work presented here, the method is applied for
two purposes. First, to measure the influence of the
ageing of blood samples on platelets aggregates (P-
aggregates) while storing them in different blood col-
lection tubes. And second, to measure dynamics in
P-aggregate formation and decay when using a com-
monly used activation assay.
2 MATERIAL AND METHODS
The applied protocols and the methodology of the
image-based flow cytometer used for the analysis of
dynamics in cell aggregation are described in this
section in more detail. The presented flow cytome-
ter is composed of a digital holographic microscope
(DHM), a microfluidic channel and a customized im-
age analysis (see Figure 1). Previous to this work,
this technique was already utilized to analyse changes
in leukocyte morphology due to sample preparation
(Klenk et al., 2019) and to distinguish between differ-
ent types of leukaemia (Ugele et al., 2018).
2.1 Digital Holographic Microscopy
For the recording of the image data a transmission
digital holographic microscope (Ovizio Imaging Sys-
tem) was used. Interferograms on the GS3-U3-
32S4M camera (Teledyne FLIR LLC) are generated
by off-axis holography combined with a double shear-
ing interferometric approach. A 528 nm SLED (Os-
ram) along with a Koehler illumination unit serves as
a light source. Light passes through the sample to-
wards the objective (CFI LWD, Nikon). The objec-
tive has a 40x magnification and a numeric aperture
of 0.55 providing moderate resolution in both axial
and lateral direction. A grating is used to generate
diffraction maxima, which together with a spatial fil-
ter are essential for the in-line approach. Interference
of the single beams is generated on the camera with a
specific phase angle between them (off-axis) and re-
sults in the creation of an interferogram. Images are
generated with a frame rate of 105 frames per second
at an exposure time of 5 µs using the Software Os-
One Version 5.12.12 (Ovizio Imaging Systems). Each
image contains on average 5 - 20 cells, resulting in
BIOIMAGING 2023 - 10th International Conference on Bioimaging
58
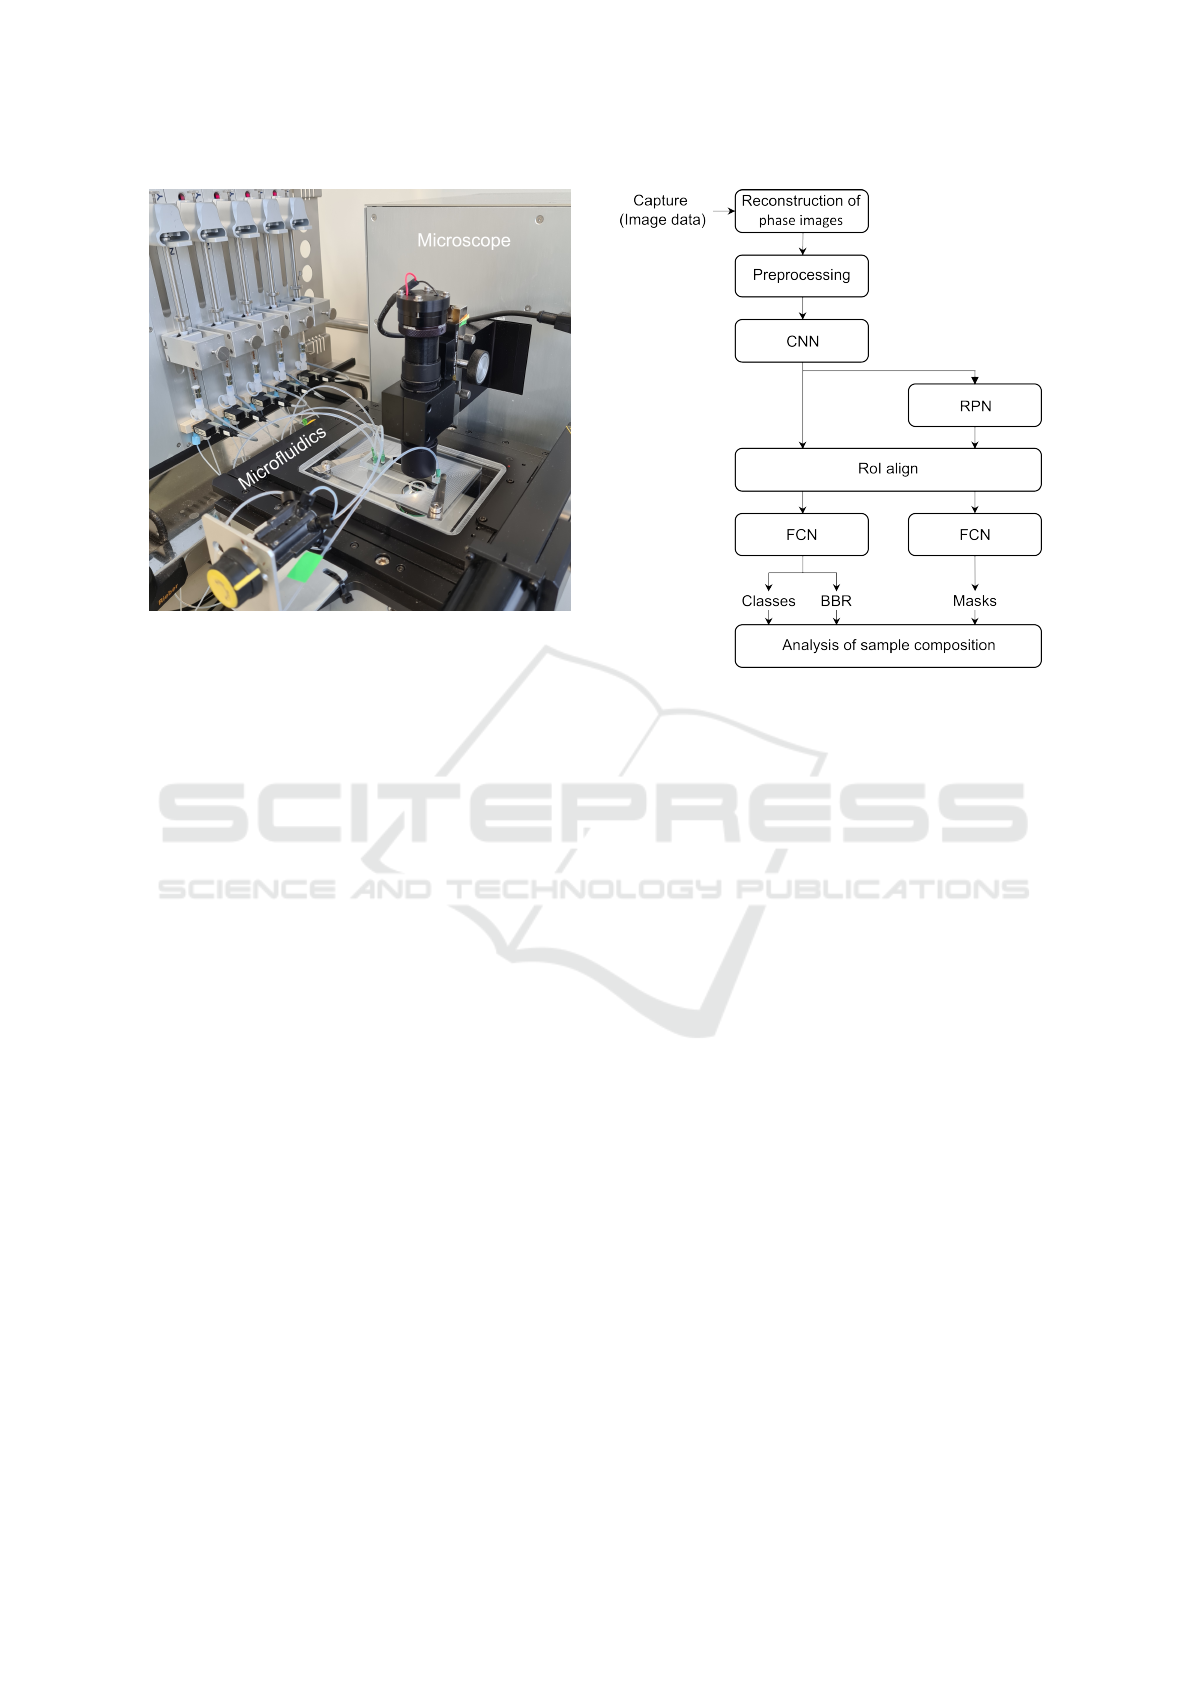
Figure 1: Hardware components of the optical flow cytome-
ter containing a digital holographic microscope, a microflu-
idic channel and a syringe pump system.
525 - 2100 cells per second. This leads to approxi-
mately 50,000 measured blood cells per capture.
2.2 Microfluidics
A microfluidic system was implemented to achieve
a high throughput of samples with a precise blood
cell alignment in a sub monolayer. For this, a poly-
methylmethacrylate (PMMA) channel with a width of
500 µm, a height of 50 µm and a length of 5000 µm
was used. Viscoelastic and hydrodynamic focussing
methods were combined to ensure a high precision.
To enable viscoelastic focussing, a portion of the
polymer polyethylene oxide (PEO) was added to the
measurement solution. Hydrodynamic focussing was
implemented, using four sheath flows surrounding the
sample from bottom, top and both sides. Additionally
to the horizontal focussing this also allows a vertical
alignment. The total flow rate was fixed to 1.6 µl/s re-
sulting in a flow velocity of 6.4 cm/s and a Reynolds
number in a single digit range (Re ≈ 6). Due to this
low flow Reynolds number, experiments were carried
out in the laminar flow regime.
2.3 Image Analysis
The analysis of the quantitative phase images was
done in three distinct steps: preprocessing of the im-
ages, Mask R-CNN based segmentation, and analysis
of detected objects.
• Preprocessing of the data included a background
subtraction, cell detection, masking and normal-
Figure 2: Block diagram of image analysis processes
needed to get from the raw holographic images towards in-
terpretable data.
ization. Background subtraction is needed to
eliminate background noise due to channel walls
and other phase influencing elements. By using
threshold segmentation, binary images of the sin-
gle elements were be obtained. Contours of ob-
jects were extracted based on the thresholding re-
sults and the algorithm of Suzuki et al. (Suzuki
et al., 1985). By choosing a suitable size filter on
the contours of detected objects, background arte-
facts from measurement media or debris could be
removed. As a final preprocessing step, normal-
isation steps were carried out which are serving
two purposes. First, limiting the value range of
the phase images and then normalizing them by
a min-max normalisation to transform the image
values into the range 0-1 which is suitable for neu-
ral networks.
• As a second level of segmentation a Mask R-CNN
(He et al., 2017) approach was used for both a
refinement of the segmentation contour and an
instance segmentation of cell aggregates. Mask
R-CNN performed both object detection and ob-
ject mask computation at the same time and is
based on the Faster R-CNN (Ren et al., 2015).
This region-based convolutional neural network
(CNN) operates in four stages. First, a CNN pro-
vides a convolutional feature map based on the in-
put patches. Secondly, a region proposal network
(RPN) provides regions of interest (RoI) by slid-
ing a small network over the convolutional fea-
Measurement of Platelet Aggregation in Ageing Samples and After in-Vitro Activation
59
ture map. Then, a RoI align layer utilizes bi-
linear interpolation to provide feature maps with
the same size as the RoI. These are used in the
fourth stage for classification and bounding box
regression (BBR). In parallel, a small fully convo-
lutional network (FCN) was applied to each RoI to
predict the individual object masks at pixel reso-
lution. For the analysis of aggregates in this work,
a ResNet50 (He et al., 2016) was used as a convo-
lutional network. For training, two datasets were
used. One with single defined blood cells as well
as a dataset with synthetically created aggregates.
These were made by composing several single cell
pictures together. Blood cells were classified in
three different classes: red blood cells (erythro-
cytes), white blood cells (leukocytes) and platelets
(thrombocytes). The network was trained on a to-
tal of 200,000 cell patches.
• Analysis of detected objects is the last step of the
imaging analysis pipeline. Based on the segmen-
tation and classification results, image patches are
categorized as single cells or cell aggregates. This
allows an analysis of the number of cells form-
ing an aggregate and how this clot is structured.
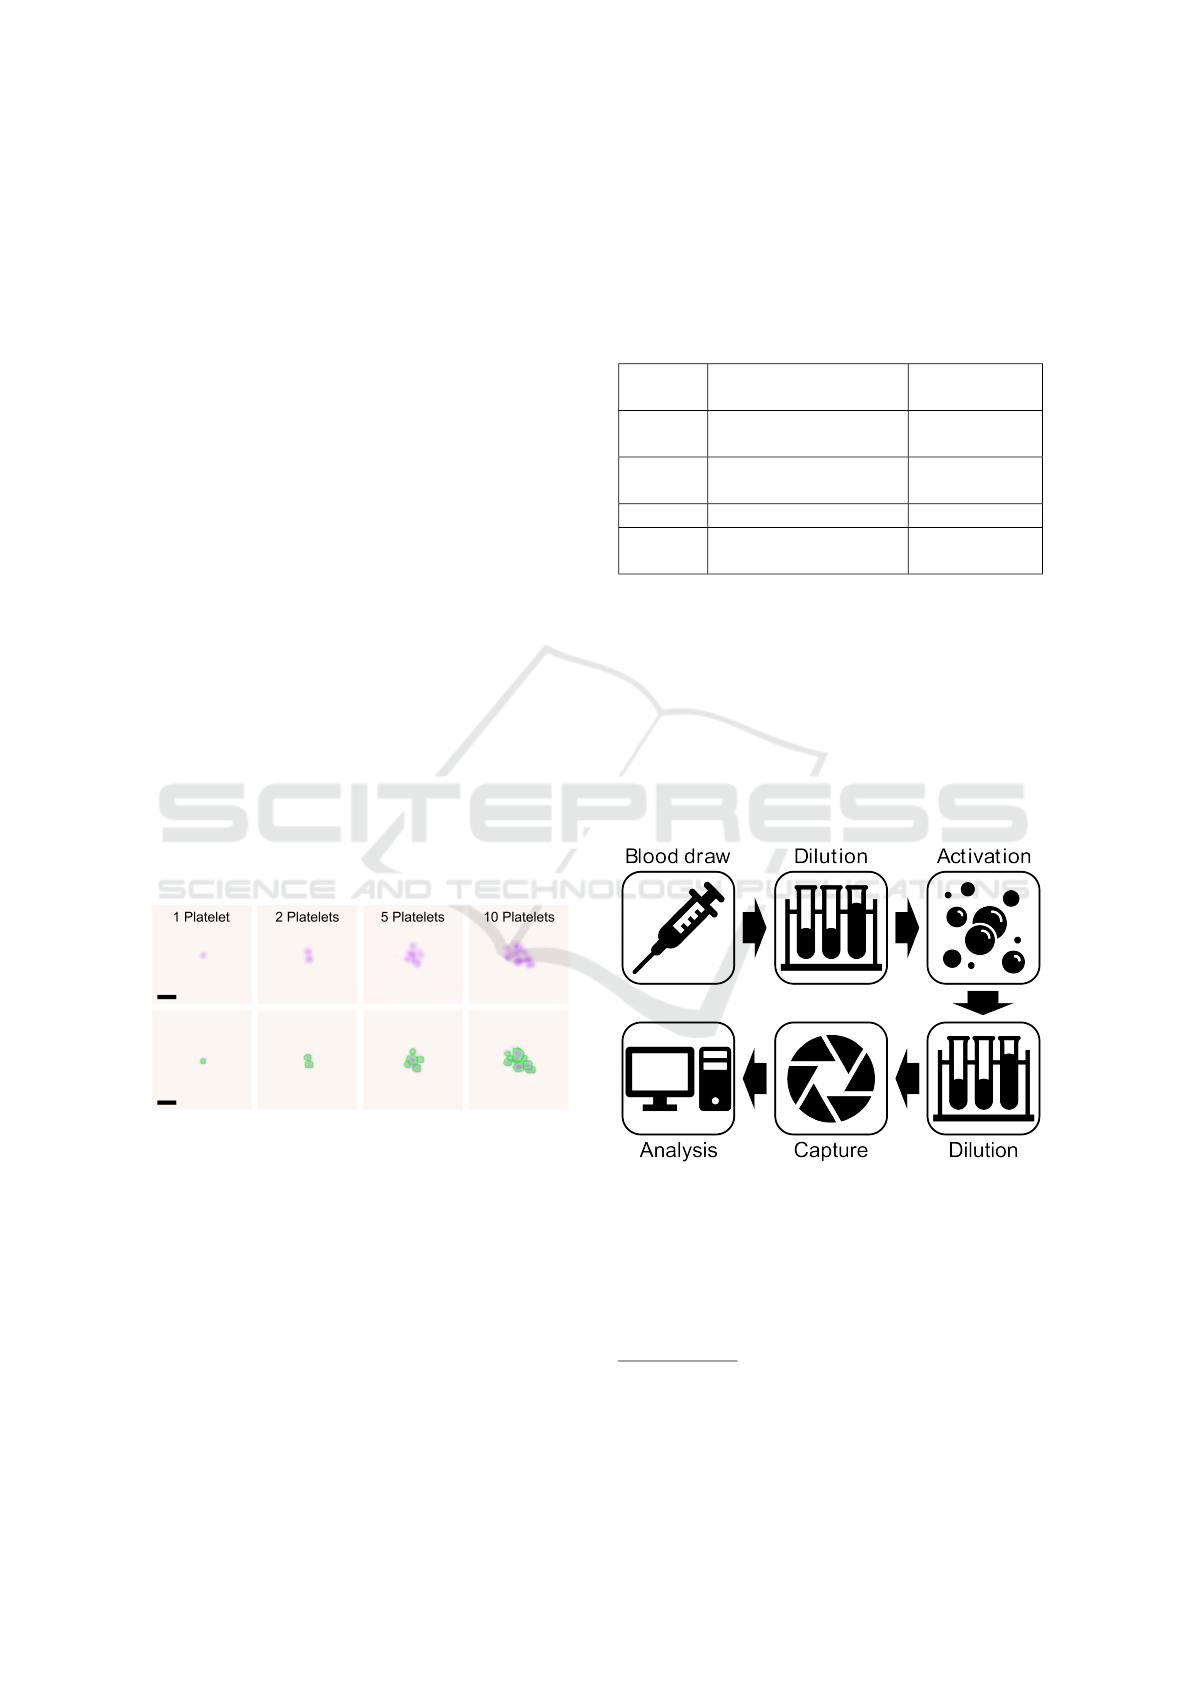
An example of a single platelet and platelet-
aggregates with the corresponding results of the
segmentation and classification is shown in Figure
3. Here, the highlighted green lines represent the
borders of the segmentation. Green in this case
represents a classified platelet.
Figure 3: Example images showing single platelets and
platelet-aggregates of different sizes. The top row shows
the quantitative phase contrast images in false colour. The
bottom row shows the same cells, with applied segmenta-
tion and classification by the image analysis algorithm. The
highlighted edges represent the edges of the segmentation,
with the colour illustrating the classification. Green in this
case represents platelets. The scale bars correspond to 5 µm.
2.4 Sample Preparation
Two different protocols were used for the experi-
ments presented in this work. One for measuring the
ageing of blood samples and the other for in-vitro
activation of blood cells. In both cases, dilution was
performed by mixing the sample with a measurement
solution containing 99.95 % phosphate buffered
saline (PBS) and 0.05 % polyethylene oxide (PEO,
molecular weight MW = 4 × 10
6
Da, Sigma Aldrich)
Table 1: Overview of the used anticoagulants and their con-
centrations specified by the supplier.
Name Anticoagulant Concentra-
tion
Citrate Trisodium citrate 0.129
mmol/ml
EDTA K3 Ethylenediamine-
tetraacetic acid
1.6 mg/ml
Heparin Lithium heparin 16 IU/ml
Hirudin Hirudin 525 ATU
Hirudin / ml
2.4.1 Ageing Experiment
Blood from a total of four independent donors
1
was
collected in the blood collection tubes mentioned in
Table 1. Directly before the measurement, blood was
diluted 1:100 in the measurement solution to reduce
cell density.
2.4.2 In-vitro Activation Experiment
Figure 4: Schematic of sample preparation steps for the ac-
tivation protocol.
For the in-vitro activation experiment, blood of three
independent donors was drawn and collected in the
same blood collection tubes mentioned in Table 1.
After a subsequent dilution step (1:2 with PBS) and
mixing for three minutes at 37°C, adenosine diphos-
1
All human samples were collected with informed con-
sent and procedures approved by application 620/21 S-KK
of the ethic committee of the Technical University Hospital
of Munich
BIOIMAGING 2023 - 10th International Conference on Bioimaging
60
phate (ADP) with a final concentration of 0.33 µM,
1.61 µM or 6.45 µM was added as an activator. This
step was followed by an additional dilution step (1:50
with measurement solution). Platelet-aggregates were
measured continuously for twelve minutes. Since
there were three to four minutes between each mea-
surement, a total number of four measurements were
carried out. Note, that the first measurement was per-
formed shortly before the activation with ADP and
that the first three preanalytical steps (see top row of
Figure 4) are adapted from existing activation pro-
tocols to allow for comparability of results (Sibbing
et al., 2008).
3 RESULTS
The findings of this study focus on the influence of
sample ageing on aggregates as well as the change in
blood after in-vitro activation by ADP. The measured
target variables include the number and composition
of P-aggregates. The number of P-aggregates is al-
ways given percentage to the total amount of platelets
in the blood sample. The composition is described by
the amount of the involved platelets. For this, the total
of all P-aggregates is always normalized to 100 %.
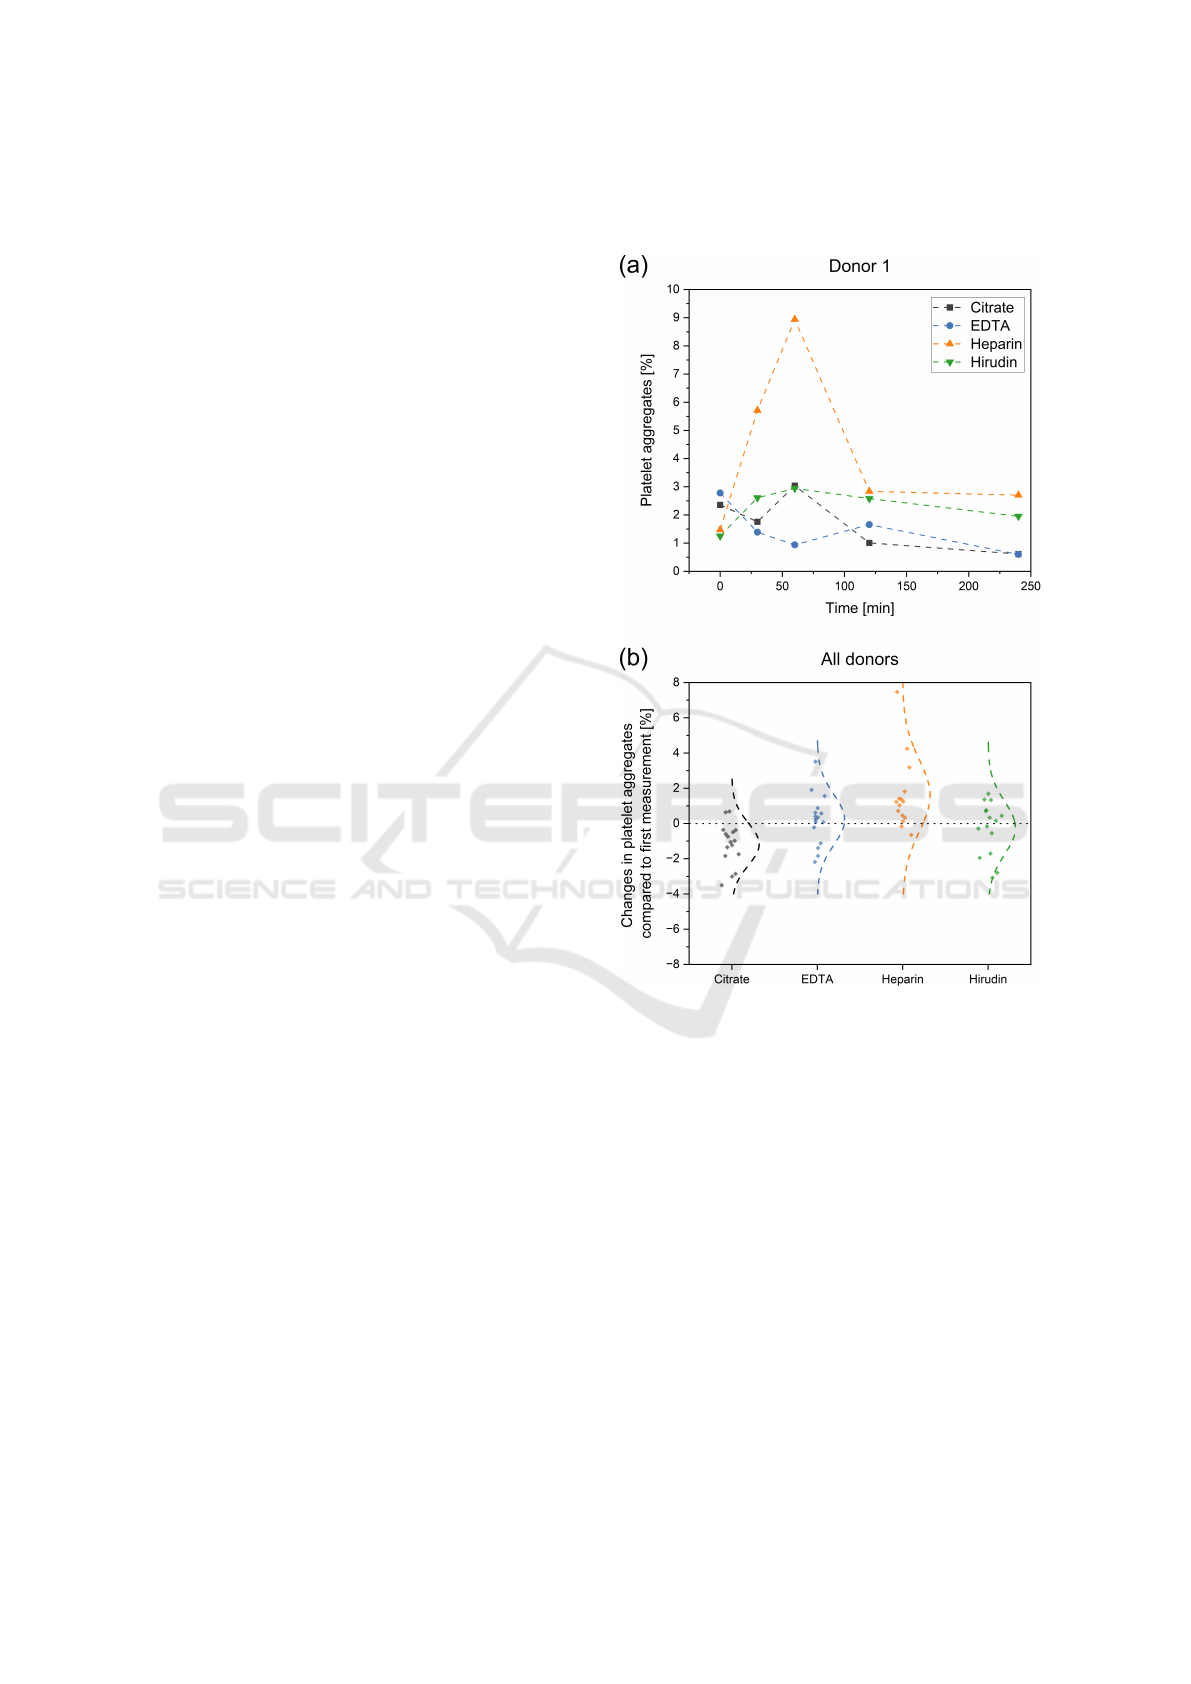
3.1 Effect of Sample Ageing on
Measured P-Aggregates
Blood of all donors was anticoagulated in citrate,
EDTA, heparin and hirudin tubes. The storage and
measurement of the sample was then performed at
room temperature over a period of two hours. Fig-
ure 5a shows such a progression for one exemplary
donor. After 0, 30, 60, 120 and 240 minutes, the
P-aggregates were measured. The different antico-
agulants are shown in different colours with citrate,
EDTA, heparin and hirudin represented in black, blue,
orange and green, respectively. All measurements
within the 240 minutes of EDTA, citrate and hirudin
range between 0.5 - 3 % of P-aggregates. For donor
1, there are only two outliers, namely in the heparin
tube after 30 min (5.71 %) and 60 min (8.94 %). A
similar picture can be seen when observing Figure 5b.
Here, the aggregates of the ageing measurement are
compared with the respective 0 min measurement for
all patients and the difference is plotted on the Y-axis.
Each point represents one measurement. In addition,
the normal distribution fitted over all points was dis-
played. For EDTA and hirudin blood, an expected
distribution around the origin can be observed. As
for donor 1, heparin shows an increased aggregation
compared to the zero measurement. Citrate, on the
other hand, shows a reduced aggregate number over
time.
Figure 5: Ageing effects on the measured number of
platelet-aggregates in different blood collection tubes. (a)
Analysis of platelet-aggregate behaviour for different anti-
coagulants over a period of 240 minutes for one donor. (b)
Difference in platelet-aggregate for all donors of the 30-,
60-, 120- and 240-minute measurement compared to their
respective 0-minutes reference.
3.2 In-vitro Activation of Thrombocytes
In this section, the effects of activation assays on
P-aggregates are investigated. For this, the ADP
concentration was varied and different anticoagulants
were used. The in-vitro activation protocol presented
in chapter 2.4.2 was applied.
3.2.1 Impact of ADP Concentration
In a first step, the concentration of the added ADP
for activation was varied to test whether this has an
Measurement of Platelet Aggregation in Ageing Samples and After in-Vitro Activation
61
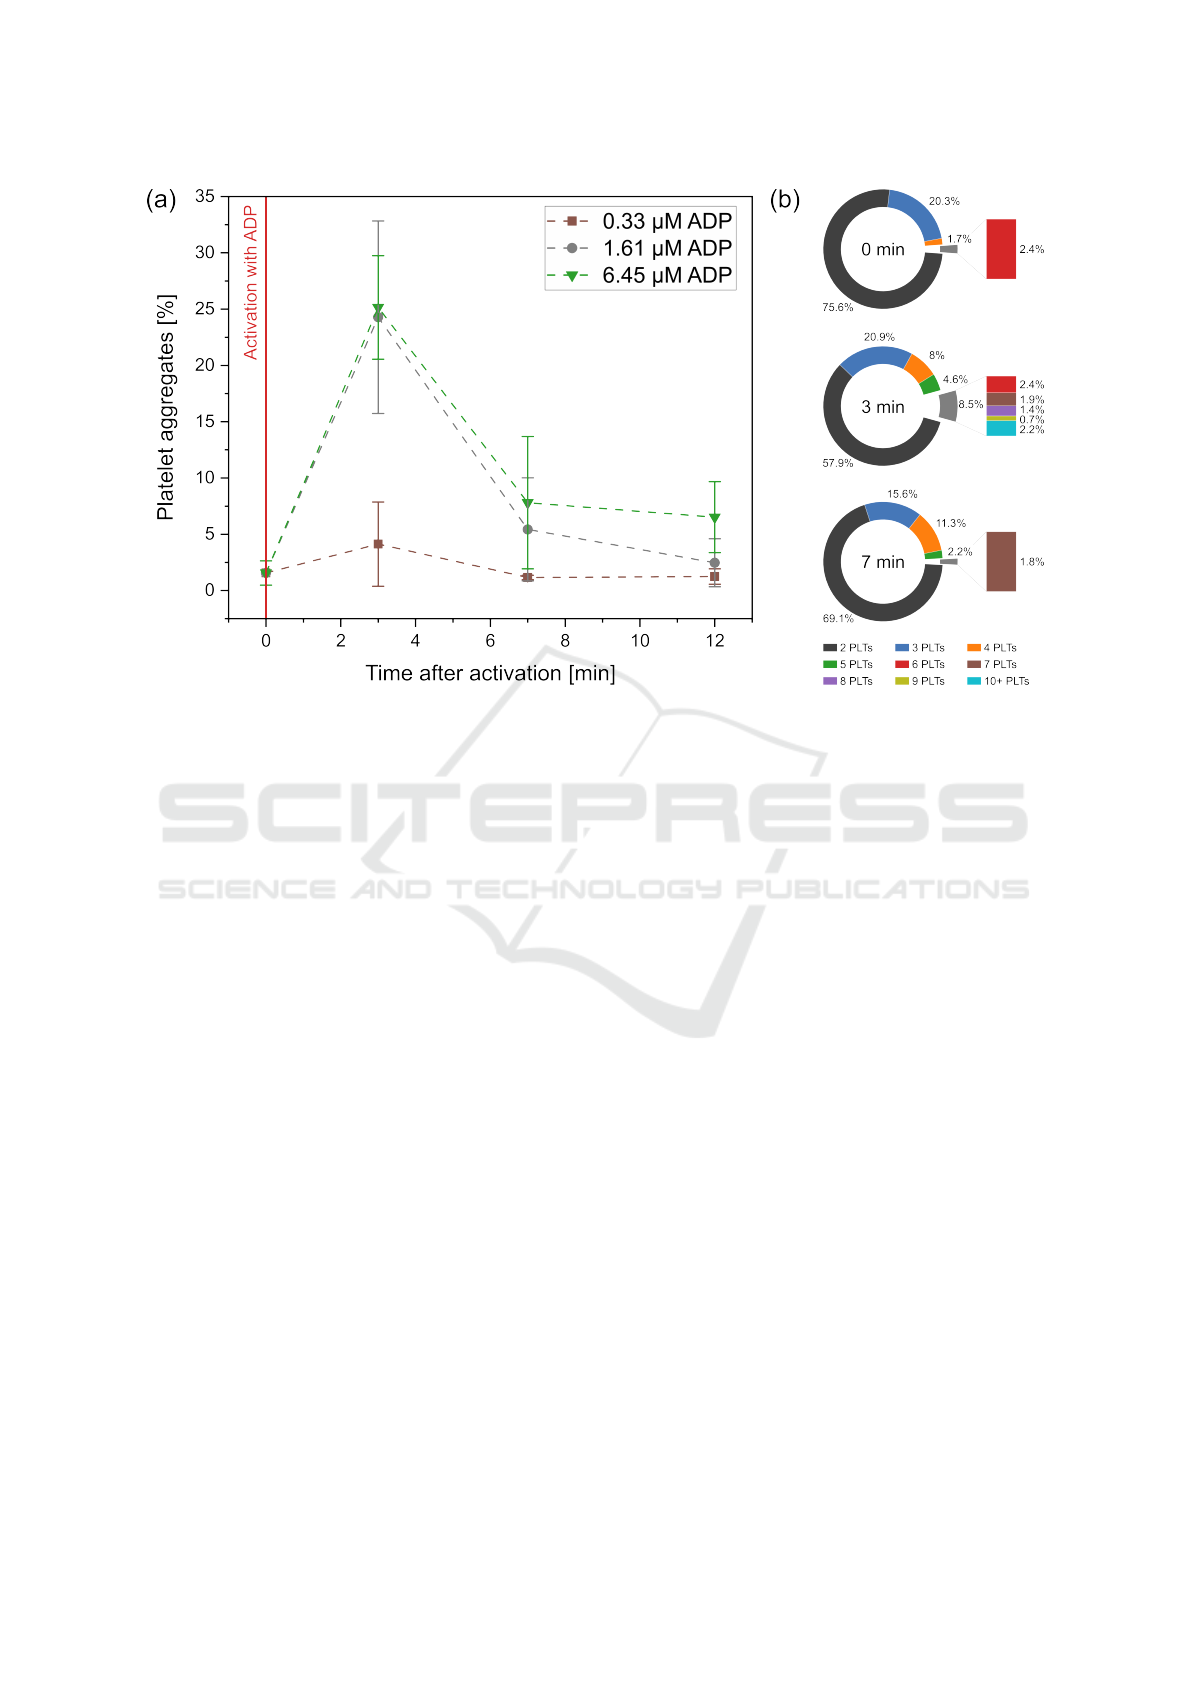
Figure 6: Change in the number (a) and composition (b) of platelet-aggregates over time after activation with different
concentrations of ADP. In all three cases, blood was collected in a hirudin blood collection tube. For the characterization of
the P-aggregate composition (b) all results are presented for the 6.45 µM experiment.
impact on the measured number and composition of
P-aggregates. For this purpose, the starting concen-
tration of ADP with 6.45 µM was diluted to 1.61 µM
and 0.33 µM and added to hirudin blood samples.
Measurements were taken shortly before activation
(0 min) and after activation (3, 7 and 12 min). As
shown in Figure 6a, the activation step results in
an increase in aggregates after three minutes for all
ADP concentrations. However, at 0.33 µM (brown
squares) the value only slightly increases from 1.56 %
to 4.13 %, whereas at 1.61 µM (gray circles) and
6.45 µM (green triangles) the values increase signifi-
cantly more (to 24.28 % and 25.15 %). After reaching
this maximum value of aggregation at three minutes,
in all three cases the values decrease over time. A
similar course can also be observed for the aggregate
composition. Figure 6b shows the size distribution of
the aggregates for the case of activation with 6.45 µM
ADP. For the first measurement, most of the aggre-
gates consist of two or three platelets. Only 4.1 %
of the aggregates consist of more than three platelets.
Immediately after activation, this proportion increases
to 21.1 %. Particularly noteworthy is, clots with 10 or
more platelets account for 2.2 % of all aggregates. For
the seven-minute measurement not only a large share
of aggregates disintegrated but especially the majority
of large aggregates. At this point, aggregates with 10
or more platelets could no longer be observed.
3.2.2 Impact of Used Anticoagulants
The choice of anticoagulant influences the in-vitro ac-
tivatability of blood cells. Thus, they intervene at
different points in the coagulation cascade, prevent-
ing uncontrolled formation of large amounts of blood
clots. To test whether these differences can also be
observed when measuring P-aggregates, differently
anticoagulated blood was activated with a total con-
centration of 6.45 µM ADP each. Figure 7 shows the
difference between the single measurement points and
their associated zero measurement before activation.
Thus, differences due to activation can be observed
directly for each point in time. When looking at the
numbers of the EDTA measurement (blue circles) no
significant increase in P-aggregates after activation
can be observed. For all three measurement points
the increase ranges between 0.16 % and 0.66 %. In
contrast to this, a sharp increase can be observed for
blood samples with citrate (black squares), heparin
(orange triangles) and hirudin (green triangles). Di-
rectly after activation, the three values of the anticoag-
ulants lie close to each other with values ranges from
21.68 % to 23.59 %. This rise is then followed by a
drop at the time points 7 min and 12 min, whereby
this decrease is lower for heparinized blood than for
the other two anticoagulants.
BIOIMAGING 2023 - 10th International Conference on Bioimaging
62
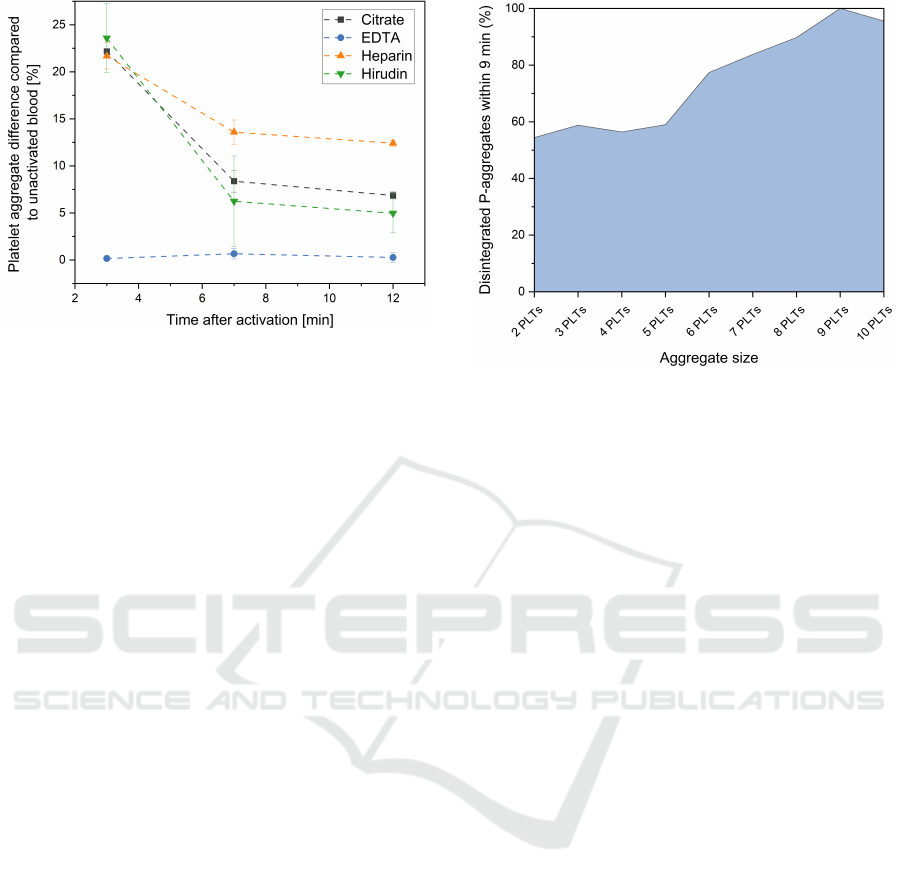
Figure 7: Influence of in-vitro activation on measured P-
aggregates in blood samples with different anticoagulants.
Shown is the difference in platelet-aggregate for all donors
3-, 7- and 12-minutes after activation compared to their re-
spective 0-minutes value.
3.2.3 Decay of P-Aggregates by Size over Time
As shown in the previous chapters, P-aggregates tend
to decay after an initial formation in the in-vitro ac-
tivation experiments. The dynamics of this process
are visible for citrate, heparin and hirudin as anti-
coagulant. In Figure 8, this decay was examined
in term of the size of the decaying aggregates. For
this purpose, all citrate, heparin and hirudin measure-
ments were pooled. Aggregates were analysed at 3
and 12 minutes, by this the number of disintegrating
clots within these nine minutes was determined. For
this analysis aggregates were considered from a size
of two platelets up to a size of ten platelets. Within the
nine minutes of analysis, the majority of P-aggregates
decayed. This effect could especially be observed in
larger aggregate structures. While the number of re-
maining clots with two, three, four or five platelets
were still between 41.03 % and 45.59 %, large ag-
gregates tend to decay faster. In clots of six to nine
platelets a nearly linear increase from 77.40 % to
100 % disintegrated P-aggregates could be seen. A
slight decrease is then observed for structures with
10 PLTs (95.58 %), which might be due to the small
amount of such large structures after 12 minutes and
the associated measurement inaccuracy.
4 DISCUSSION
As shown in Figure 5 and 6, a stable measurement
of blood was achieved. Measured aggregate values
directly after blood draw laid between 0.50 % and
3.00 %, which is in a similar range as published
Figure 8: In depth analysis of P-aggregate decay by size
between minute 3 and 12 of the activation experiments.
For this purpose all measurements of citrate, heparin and
hirudin were pooled and then analysed together.
data. Leytin et al. analysed the number of activated
platelets by measuring P-selectin, a protein which is
presented on the surface of the thrombocytes when
activated (Leytin et al., 2000). Here, an amount of
1.02 ± 0.49 % of activated platelets could be observed
for healthy blood samples. The slight difference in
range to the here presented data could be explained
by the use of different analysing techniques and the
measurement of different biomarkers. Although the
number of activated platelets and P-aggregates are di-
rectly related, it does not allow direct comparability of
the values.
For samples without ageing effect, the measure-
ments for EDTA and hirudin showed a normal distri-
bution around the respective zero measurement (Fig-
ure 5b). The measured P-aggregate values tended to
vary between ±2 % during the two hours of moni-
toring, allowing stable measurement conditions. For
heparinised blood on the other hand, an increased ag-
gregate formation due to ageing effects could be ob-
served. Since this is mostly observed shortly after
blood collection (Figure 5a), thus after 30 and 60 min,
these effects could be due to the blood collection and
subsequent lower anticoagulation with heparin. For
citrate blood a decrease of values over time, hence a
disintegration of aggregates could be observed. Both
effects, for citrate and heparin, show a clear trend for
the four measured blood samples, but need to be vali-
dated by a higher sample collective in the future.
In addition to measuring ageing effects, the
method was also applied to measure highly dynamic
processes in the formation and decay of blood cell ag-
gregates. Figure 6 - 8 show the rate of this dynamics.
Depending on the anticoagulant, between 42.79 % -
Measurement of Platelet Aggregation in Ageing Samples and After in-Vitro Activation
63

79.98 % of all P-aggregates disintegrated within nine
minutes. Michelson et al. performed a comparable
study in-vivo. Here, they activated baboon platelet
concentrates, infused it into the animals and mea-
sured the number of leukocyte-platelet-aggregates in
the blood stream. For monocyte-platelet-aggregates
approximately 72.73 % disintegrated within a time
frame of ten minutes (Michelson et al., 2001). Al-
though this experimental protocol and the measured
aggregates cannot be compared directly to the P-
aggregates, it still shows a similar physiological dy-
namic. The fast changes in values underline the need
of a measurement technique which is not dependent
on time consuming sample preparation steps or long
acquisition times. Increased aggregate values can still
be detected several minutes after activation, but on a
reduced scale. Furthermore, it cannot be ruled out that
the sample is activated due to sample preparation and
handling (Ramstack et al., 1979; Jesty et al., 2003).
When observing P-aggregate formation, results in
Figure 7 suggest that there was a difference in acti-
vation of blood, depending on the used anticoagulant.
There were anticoagulants that allowed an in-vitro ac-
tivation of blood with ADP, namely citrate, heparin
and hirudin, and then there was EDTA, that prevented
any activation. These results are in line with findings,
showing that EDTA prevents an interaction between
fibrinogen and the exposed receptors on the platelet
membranes resulting in strongly inhibited formation
of aggregates (Peerschke and Zucker, 1981). Cit-
rate, heparin and hirudin on the other hand are com-
monly used for in-vitro activation assays and allow a
subsequent blood coagulation (Wall
´
en et al., 1997).
Besides the chosen anticoagulant also the amount
of added ADP had an impact on platelet activation.
Thus, only a marginal increase in aggregates could
be registered after activation with 0.33 µM ADP. The
effects were significantly higher for 1.61 µM and
6.45 µM with only a small difference between these
two concentrations. This suggests that saturation is
reached and further concentration increase does not
lead to a significant increase in P-aggregates.
Lastly, when looking at the composition of the P-
aggregates it can be seen, that after activating blood
with ADP not only the number of aggregates but also
the number of the involved platelets changes. While
the aggregates for the measurements before activation
(Figure 6) mostly consisted of two platelets, the num-
ber of larger aggregates changed considerably after
activation. The ADP promoted cohesion of platelets
by fibrinogen, thus supports not only the formation
of small but also large blood clots. When observing
their decay (Figure 8), it can be seen that the propor-
tion of large aggregates with more than six platelets
tended to dissolve faster than smaller aggregates. This
effect may be explained by a homogeneous disinte-
gration of all aggregates but a decay of big clots into
smaller ones. Thus, nine minutes after activation, al-
most no aggregates with nine or more platelets could
be recorded.
5 CONCLUSION
The work presented here, shows a method that
is capable of high throughput measurement of P-
aggregates without any staining or other lengthy sam-
ple preparations. Through combination of quantita-
tive phase microscopy, microfluidics and image anal-
ysis a quantitative and qualitative analysis of these
aggregates was achieved. This was done in such a
way that even fast dynamics in aggregation formation
and decay could be observed. When looking at the
analysed anticoagulants, two reagents show promis-
ing results for long time storage of blood, regarding
the measured P-aggregates. EDTA and hirudin fulfil
this goal, whereby only the latter allows an in-vitro
activation. The application of the presented method
for ageing and activation measurements is a first step
to characterise the measurement system as well as the
biomarker. The long-term goal, however, is to mea-
sure increased platelet activity in blood of patients
with various diseases. An increased platelet activ-
ity was already observed for patients with COVID-
19, cancer and cardiovascular diseases. Although fur-
ther studies are needed to validate the biomarker in
these medical fields, the presented method could be a
promising tool to reach this goal.
REFERENCES
Al-Samkari, H. and Connors, J. M. (2019). Managing the
competing risks of thrombosis, bleeding, and antico-
agulation in patients with malignancy. Hematology
2014, the American Society of Hematology Education
Program Book, 2019(1):71–79.
Allen, N., Barrett, T. J., Guo, Y., Nardi, M., Ramkhelawon,
B., Rockman, C. B., Hochman, J. S., and Berger, J. S.
(2019). Circulating monocyte-platelet aggregates are
a robust marker of platelet activity in cardiovascular
disease. Atherosclerosis, 282:11–18.
C¸ ankaya, B. Y., Alper, F., Karaman, A., and Akg
¨
un, M.
(2021). Hemorrhagic lesions associated with antico-
agulant therapy: a pictorial review. Journal of Throm-
bosis and Thrombolysis, 51(4):1067–1077.
He, K., Gkioxari, G., Doll
´
ar, P., and Girshick, R. (2017).
Mask r-cnn. In Proceedings of the IEEE international
conference on computer vision, pages 2961–2969.
BIOIMAGING 2023 - 10th International Conference on Bioimaging
64

He, K., Zhang, X., Ren, S., and Sun, J. (2016). Deep resid-
ual learning for image recognition. In Proceedings of
the IEEE conference on computer vision and pattern
recognition, pages 770–778.
Herzenberg, L. A., De Rosa, S. C., and Herzenberg, L. A.
(2000). Monoclonal antibodies and the facs: comple-
mentary tools for immunobiology and medicine. Im-
munology today, 21(8):383–390.
Jesty, J., Yin, W., Perrotta, P., and Bluestein, D. (2003).
Platelet activation in a circulating flow loop: com-
bined effects of shear stress and exposure time.
Platelets, 14(3):143–149.
Kamath, S., Blann, A., and Lip, G. (2001). Platelet activa-
tion: assessment and quantification. European heart
journal, 22(17):1561–1571.
Klenk, C., Heim, D., Ugele, M., and Hayden, O. (2019).
Impact of sample preparation on holographic imaging
of leukocytes. Optical Engineering, 59(10):102403.
Lazaridis, D., Leung, S., Kohler, L., Smith, C. H., Kearson,
M. L., and Eraikhuemen, N. (2021). The impact of
anticoagulation on covid-19 (sars cov-2) patient out-
comes: a systematic review. Journal of Pharmacy
Practice, page 08971900211015055.
Lazo-Langner, A., Goss, G., Spaans, J., and Rodger, M.
(2007). The effect of low-molecular-weight heparin
on cancer survival. a systematic review and meta-
analysis of randomized trials. Journal of Thrombosis
and Haemostasis, 5(4):729–737.
Leytin, V., Mody, M., Semple, J. W., Garvey, B., and Freed-
man, J. (2000). Flow cytometric parameters for char-
acterizing platelet activation by measuring p-selectin
(cd62) expression: theoretical consideration and eval-
uation in thrombin-treated platelet populations. Bio-
chemical and biophysical research communications,
269(1):85–90.
Michelson, A. D., Barnard, M. R., Krueger, L. A., Va-
leri, C. R., and Furman, M. I. (2001). Circulat-
ing monocyte-platelet aggregates are a more sensitive
marker of in vivo platelet activation than platelet sur-
face p-selectin: studies in baboons, human coronary
intervention, and human acute myocardial infarction.
Circulation, 104(13):1533–1537.
Peerschke, E. I. and Zucker, M. B. (1981). Fibrino-
gen receptor exposure and aggregation of human
blood platelets produced by adp and chilling. Blood,
57(4):663–670.
Rampotas, A. and Pavord, S. (2021). Platelet aggregates, a
marker of severe covid-19 disease. Journal of Clinical
Pathology, 74(11):750–751.
Ramstack, J., Zuckerman, L., and Mockros, L. (1979).
Shear-induced activation of platelets. Journal of
biomechanics, 12(2):113–125.
Ren, S., He, K., Girshick, R., and Sun, J. (2015). Faster
r-cnn: Towards real-time object detection with region
proposal networks. Advances in neural information
processing systems, 28.
Riedl, J., Ay, C., and Pabinger, I. (2017). Platelets and
hemophilia: A review of the literature. Thrombosis
research, 155:131–139.
Sibbing, D., Braun, S., Jawansky, S., Vogt, W., Mehilli,
J., Sch
¨
omig, A., Kastrati, A., and von Beckerath, N.
(2008). Assessment of adp-induced platelet aggrega-
tion with light transmission aggregometry and multi-
ple electrode platelet aggregometry before and after
clopidogrel treatment. Thrombosis and haemostasis,
99(01):121–126.
Suzuki, S. et al. (1985). Topological structural analy-
sis of digitized binary images by border following.
Computer vision, graphics, and image processing,
30(1):32–46.
Ugele, M., Weniger, M., Stanzel, M., Bassler, M., Krause,
S. W., Friedrich, O., Hayden, O., and Richter, L.
(2018). Label-free high-throughput leukemia detec-
tion by holographic microscopy. Advanced Science,
5(12):1800761.
Wall
´
en, N. H., Ladjevardi, M., Albert, J., and Br
¨
oijers
´
en,
A. (1997). Influence of different anticoagulants on
platelet aggregation in whole blood; a comparison
between citrate, low molecular mass heparin and
hirudin. Thrombosis research, 87(1):151–157.
Whiting, D. and DiNardo, J. A. (2014). Teg and rotem:
technology and clinical applications. American jour-
nal of hematology, 89(2):228–232.
Measurement of Platelet Aggregation in Ageing Samples and After in-Vitro Activation
65
