
The Compilation of 2D and 3D Dynamic Visualizations
Brian Farrimond
a
and Ella Pereira
b
Edge Hill University, St Helens Road, Ormskirk, U.K.
Keywords: 3D Modelling, Parametric Modelling, Information Visualization, Temporal Database, Digital Heritage,
Industrial Heritage, Cultural Heritage.
Abstract: 3D modelling and visualization are rapidly developing in power and application. Unfortunately they are also
developing in complexity of use. They require considerable practice and skill in order to model and visualize
successfully. This paper presents modelling and visualization strategies and tools based on textual
descriptions of models and visualizations. The principles of compilation used in coding for many decades are
applied to modelling and visualization. This results in tools able to model and visualize many types of dynamic
object such as ships and locomotives that can be used successfully by non-expert users who have knowledge
of the objects being modelled. The tools have been used in local primary schools since 2007.
1 INTRODUCTION
As the uses of 3D models increase, more and more
tools become available to build and make use of them.
Unfortunately as the tools continue to be developed,
so their complexity and difficulty of use increase.
Several products aim to simplify the model building
process but they still require a certain amount of skill
and experience to create successfully realistic models
of objects such as buildings, ships and steam
locomotives. In this paper we present our solutions
for making easier the creation and use of 3D models
for use in visualizations of highly deterministic
historical events whose actions follow pre-
determined rules such as the movements of railway
trains and shipping.
Our model building tools are inspired by the
compiling methodologies developed since the 1940s
and 1950s to remove the need for the programmers to
understand the architecture of the computers they
were coding for. They introduced high level
languages such as FORTRAN (Backus, 1978) and
compilers that translate them into machine code. We
aim to remove from the user the need to understand
how geometrical primitives can be assembled to
model real world objects. Similarly, by focussing on
highly deterministic scenarios we are able to direct
the computer with a few narrative sentences to carry
a
https://orcid.org/0000-0001-7606-6899
b
https://orcid.org/0000-0001-7273-3295
out the computations animating the complex
movements of railway trains and ships.
This paper describes strategies that enable non-
expert users to create rapidly complex visualizations
containing accurate models of dynamic, animated
artifacts compiled from textual information. The
strategies are based on textual descriptions which
lend themselves to embedding into model creation
and usage the capture and provision of textual
information about the objects being modelled.
Conversely, the strategies make possible the
automatic generation of models from textual
descriptions in other, well-formed formats by
conversion into our formats. The strong links between
models, visualizations and the underpinning text offer
rich opportunities for enhancing the application of 3D
modelling to industrial heritage.
Tools based on these strategies have been
developed and used successfully in a group of
primary schools in the United Kingdom since 2007.
Children, between 9 and 11 years old, have been able
to build complex, dynamic 3D models while learning
about the terminology and grammar of the real-world
objects that the models represent such as churches,
steam locomotives and paddle steamers.
Collaboration continues with an industrial
heritage society on the development of visualizations
to enhance the society’s outreach to schools and the
general public.
150
Farrimond, B. and Pereira, E.
The Compilation of 2D and 3D Dynamic Visualizations.
DOI: 10.5220/0011633300003417
In Proceedings of the 18th International Joint Conference on Computer Vision, Imaging and Computer Graphics Theory and Applications (VISIGRAPP 2023) - Volume 3: IVAPP, pages
150-157
ISBN: 978-989-758-634-7; ISSN: 2184-4321
Copyright
c
2023 by SCITEPRESS – Science and Technology Publications, Lda. Under CC license (CC BY-NC-ND 4.0)

2 RELATED WORK
3D models are normally created with powerful and
complex 3D modelling tools. Ugwitz et al discuss the
tools and their usage by their students for the
modelling of historical buildings (Ugwitz et al, 2021).
They include commercial tools such as Autodesk
Maya, Autodesk 3D Studio Max and free tools such
as Blender. They also include 3D game engines
(Unity, Unreal, CryEngine). The learning curves of
all the software are considerable and natural ability is
required for success in building more complex
models from geometrical primitives such as curves,
cuboids, spheres, cones and extrusions. This is
evidenced by the official and unofficial tutorial
videos available on the internet (Autodesk 3ds Max
Learning Channel, 2022) (Blender Tutorials, 2022).
3D sculpting tools such as zBrush aim to provide
a more intuitive way of building but the interfaces are
still technical and require considerable familiarity
with the dozens of tools/brushes available in order to
create realistic models. (zBrush, 2021). They rely. on
the user having a traditional sculptor's skills
3D model building from 2D drawings is available
in tools such as Sketchup but, again, considerable
skill is required for success or the contribution to a
model of a locomotive or a ship is very limited
(Sketchup, 2021).
3D Parametric Modelling has been developed in
recent years to increase the connectivity between
components enabling consistent changes to be
applied throughout a model automatically. This is
implemented either as extensions to the 3D modelling
tool (such as in Maya) or as plug-ins (such as
Grasshopper for the Rhinoceros 3D modelling tool
(Rhino 3D, 2022)). Networks of relationships
between nodes are created. Components attached to
the nodes are able to receive input values and send
output values to other connected nodes. Thus any
changes in a parameter triggers a cascade of output
values to be sent through the network updating the
state of the components as determined by the network
design. The networks are created by either graphical
programming or scripting. Considerable experience is
required in order to produce successful networks. The
networks can be extremely complex.
The advantages of modelling with real world
components such as windows, walls and doors have
been recognised by the construction industry which
has seen the introduction of Building Information
Modelling (BIM). The objects to be added to a
building, such as windows and doors are selected
from databases of “smart” objects. Once inserted, the
dimensions of the objects can be modified.
Parametric modelling within BIM enables rules to be
applied such as setting the difference in height
between floor and ceiling equal to the height of the
walls – or vice versa. This can be achieved by the use
of scripting for example (Casini, 2022).
Many applications have been developed exploring
the use of natural language to generate visual
interpretations of semantic content either as static
scenes or dynamic animations (Hassani et al, 2017).
We use our models in visualizations generated from
two types of source: restricted natural language
narratives and transcribed timetables. The
deterministic nature of our chosen scenarios and the
embedding of behaviour in the semantics of the
models such as the operation of lock gates and swing
bridges in a harbour means that only a few dozen
sentence types are needed to create realistic scenarios.
We make use of regular expressions to parse the
narratives.
3 OUR APPROACH
Our tools for building and using 3D models aim to be
easy to learn for the non-expert because:
• they deal entirely with real world terms (such as
nave, chancel, transept for a church, firebox,
boiler and wheels for a steam locomotive) when
adding and modifying components and no
knowledge of how a 3D tool would render them
is needed. The software knows how to do that.
• building consists of selecting a component in a
model, customising it by modifying the attributes
displayed in a table and adding components to
the selected component and moving on to select
these added components to customise their
attributes. No switching of tools is required. The
procedure is taught to primary school children in
a matter of minutes.
In our software, parametric modelling is coded
within the model builder libraries. The user does not
have to specify the connectivity between
components; it is embedded within the library code.
The code uses the attributes of the modelled
components to determine the geometry and their
effects on other components within the model. For
example, if the height of the saddle supporting the
smoke box on a steam locomotive is raised then the
code changes the height of the saddle geometry; it
also raises the position of the smoke box to conform
and raises the heights of the boiler and firebox to
conform in turn. Thus the changes to one parameter
of the model cascade through all the other
components affected by the change. Unlike the
The Compilation of 2D and 3D Dynamic Visualizations
151
parametric modelling described in the previous
section, all the coding necessary to achieve this
component connectivity is embedded in the model
building libraries.
This means that our model builders are not general
purpose model builders. They can only build the types
of model targeted by the builder libraries. However,
we believe that this is worthwhile doing because an
important and interesting group of visualizations can
be created with them. At present we are exploring the
visualization of railway and shipping movements and
the creation of landscapes of medieval churches and
cathedrals. In the real world each domain contains (or
contained) many thousands of variations of the same
kinds of things – locomotives, carriages, wagons,
railway infrastructure such as signals and track and
churches. Our builder tools are suitable to model
these.
The arrangements to animate items such as
locomotives and carriages are embedded in the library
code and the results seen in animated visualizations.
4 2D AND 3D COMPILATION
Our modelling strategy is based on compiling 3D
models from formal textual descriptions. These
models are used in complex 3D visualizations
compiled from textual sources including restricted
natural language narratives and transcribed
timetables.
The aim is to enable the user to work entirely in
terms of his domain rather than the artifacts of 3D
modelling tools. For example, a church should be
built from naves, chancels, windows etc and not
cuboids, spheres and cones. Not many people have
the skills to look at an object like a church or ship and
be able to split it into the geometrical primitives
needed to model it. Our tools aim to prevent this from
being a hindrance to modelling and to provide an
environment in which the users will feel familiar with
the components they are using to build.
The text based methodology of the tools provides
candidate methods for recording information about
objects textually in an unambiguous, structured
manner that can be automatically visualized, for
example, for validation purposes.
Additionally, any existing textual descriptions
containing sufficient information can be converted
into our text formats and automatically visualized in
2D and 3D.
5 OVERALL VISUALIZATION
COMPILATION SYSTEM
The overall system for making 3D models and using
them to create and view visualizations, which we
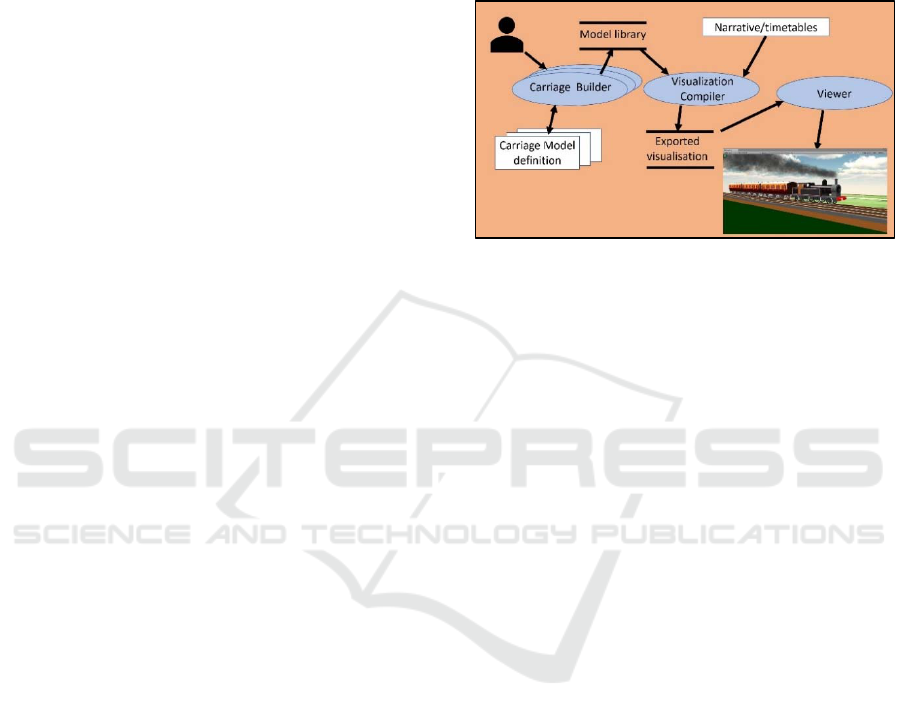
refer to as scenarios, is shown in Figure 1:
Figure 1: Overall system for creating dynamic 3D models
and using them in visualizations. Builders include Carriage
Builder, Locomotive Builder, ScenarioScene Builder
(which creates the scenery and railway and dock
infrastructure)…
This is a development of our earlier work visualizing
historical events (Presland et al, 2010), (Hazlewood
et al, 2011). 3D models are created by adding and
customising the components from which they are
made, e.g. ship’s hull, masts, rudders. The models are
dynamic in the sense that they have moving parts such
as ships having rudders that are able to swing left and
right and locomotives having wheels that are able to
turn. The attributes of the customised components are
recorded in the model definition file.
The models are added to a library that is used by
a visualization compiler that reads a narrative or
timetable that determines what is to happen in a
visualization. The visualization compiler identifies
the models required from the library, loads them and
uses their characteristics to determine state of the
models within the scene as the visualization
progresses through its time span.
The visualization is saved as a set of VRML or
OBJ files and text files storing the scene graph for the
visualization and keyframes containing the state of
the nodes of the scene graph at one second intervals.
The stored visualization includes:
• The scene graph – specifying each node in the
scene graph and its connectivity to the other
nodes. It also contains the links identifying which
dynamic nodes are driven by other nodes and the
function and parameters to be used when updating
a driven node in the light of changes to a driver
node. (See Section 8.1)
IVAPP 2023 - 14th International Conference on Information Visualization Theory and Applications
152
• The keyframe table – specifying the state of each
transform node for each second of the
visualization time span.
The mechanism we use to save a visualization
enables us to use the same saved visualizations in any
implementation of a scenario viewer. The viewer
must be able to read the saved scene graph description
and generate the corresponding scene graph in its own
environment. The viewer must be able to load the
keyframe values. So far we have implemented
viewers using Java 3D (Java is the implementation
language of our builder software) and in Unity 3D.
The Unity 3D viewer has been exported for use in the
Edge Hill University’s Computer Augmented Virtual
Environment (CAVE) and Vive headsets using
MiddleVR (MiddleVR, 2022) to interface to the
hardware. It should be possible to create a viewer in
any 3D environment that can create, display and
manipulate the nodes of a scene graph.
Primary school children build locomotive models
in class then come to see them running in the CAVE
and in the Vive headsets at Edge Hill University
where they are embedded into a model of the local
railway system of 100 years ago.
6 BUILDING MODELS USING
THE MODEL BUILDERS
The objects we have modelled so far, include sailing
ships, paddle steamers, steam locomotives, railway
carriages and wagons and beam engines and scenario
scenes containing harbours and railway networks,
churches and cathedrals.
In all cases we have failed to find useful existing
written descriptions that could be transformed
directly into the XML model definitions that we are
making use of. Consequently we realised that we
needed to create interfaces that enable the user to
create the textual descriptions for the model builders,
building the models by adding components and
customising their attributes using whatever
information is available.
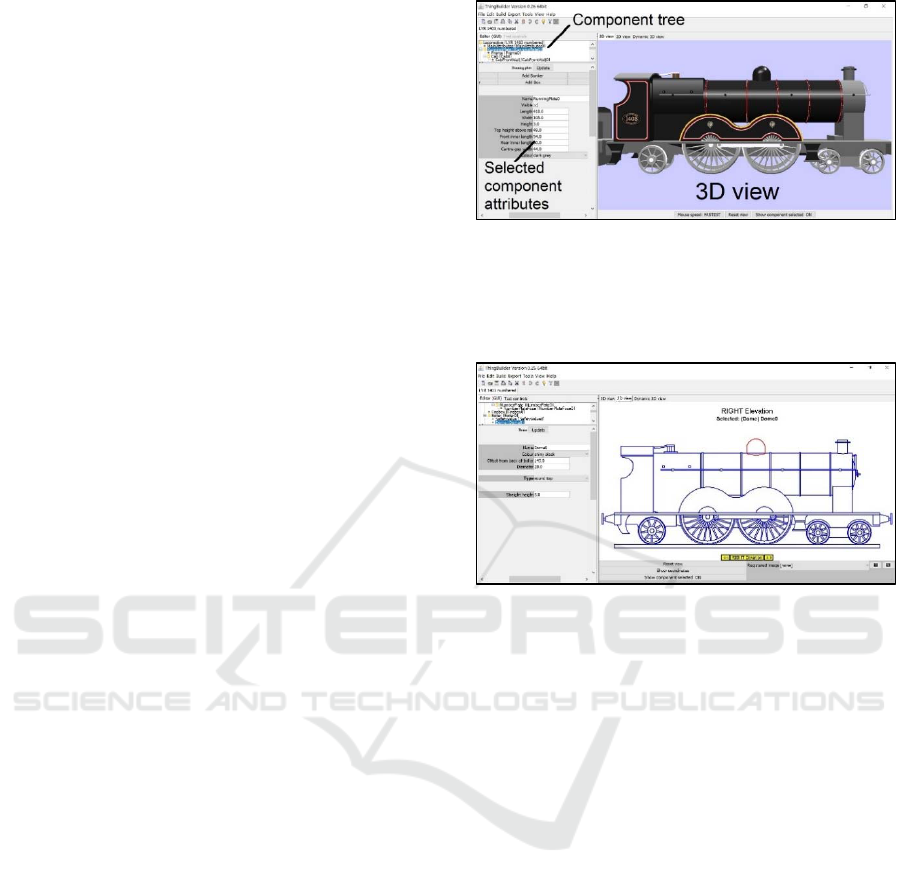
The interfaces consist of 3 panels: the component
tree, a table showing the attributes of the selected
component and the 3D view as shown in Figure 2:
A 2D view is also available for locomotives as
shown in Figure 3.
Figure 2: Locomotive Builder interface. The 3D view is on
the right. The user selects components in the component
tree at top left. The user edits the selected component
attributes at bottom left. Clicking on the Update button
refreshes the 3D model.
Figure 3: The same locomotive (Lancashire & Yorkshire
Railway Class 1400) shown in the 2D view. Components
may be selected by clicking on them in this view. Here, the
dome is currently selected (highlighted in red) with its
attributes shown in the lower left panel.
When a model definition file is opened the model type
is detected and the corresponding model builder
library is used to read in the file and generate the
corresponding VRML 3D model files specifying the
vertices and polygons forming the 3D geometry.
When the model is edited, updates cause the
VRML code for the model to be regenerated. This
repeated VRML code writing has caused no delay
problems with objects such as locomotives. This
holds true even for the older, less powerful machines
available in primary schools. However, it is
recognised that optimisation or an alternative method
will be needed in order to achieve satisfactory
performance for models as large as full cathedrals.
Selecting components for editing is handled by
selecting them in the component tree or in the 2D
views.
It has been found that the process of obtaining
measurements from drawings of steam locomotives,
for example, is much simplified if model editing is
carried out in a 2D view in which images of the
original drawing are placed in the background.
The Compilation of 2D and 3D Dynamic Visualizations
153
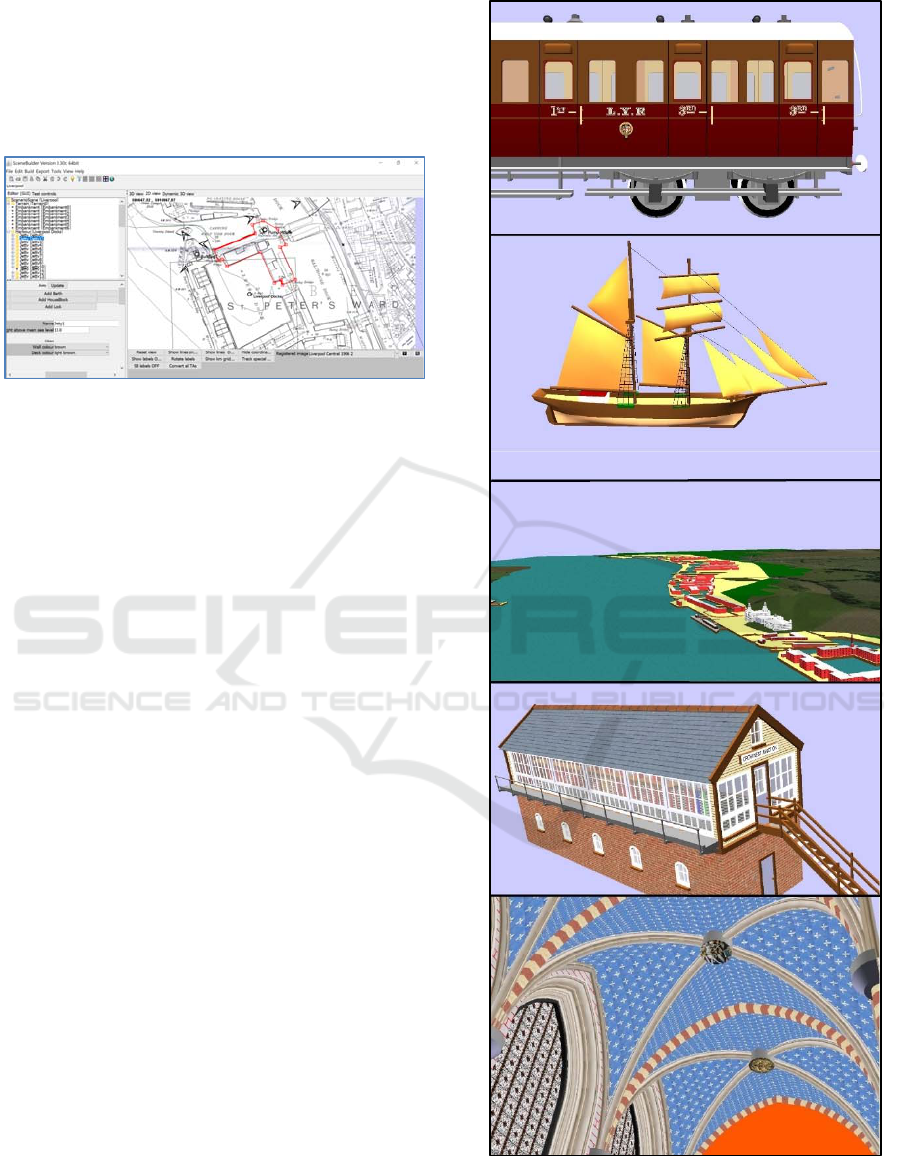
It has been found that modelling scenes that
include docks and railways is best done principally in
2D using images of 25 inch to the mile Ordnance
Survey maps (National Library of Scotland, 2022).
Scenario scenes such as the Liverpool docks are
modelled in the 2D view as shown in Figure 4:
Figure 4: Editing the Albert Dock in Liverpool from the
1906 25 inch to the mile Ordnance Survey Map. A jetty is
shown selected in red. Map from National Library of
Scotland.
Figure 5 shows a selection of other models: created
with the builder tools.
7 CREATING THE MODEL
BUILDERS
A set of model builders have been developed that can
read high-level language model definitions and
generate corresponding 2D images and 3D models. A
consistent structure underlies the builders for
different types of model. Consequently, much of the
creation of the model builders is automated. This
speeds up development and makes modifications to
the builders easier and quicker to implement.
The model builders are created using a builder
compiler that reads a definition of the grammar to be
used to describe a model and generates an application
library that is able to generate 2D images and 3D
models expressed in the VRML and OBJ formats
from model definitions written using the grammar.
8 COMPILING DYNAMIC
VISUALIZATIONS
The models created as described above are used
inside dynamic visualizations. The models are
exported to a model library from where they can be
included in the visualizations.
Figure 5: Examples of model types created by our model
builders - a Lancashire & Yorkshire Railway carriage, a
schooner, a scenario scene model of Liverpool Docks, a
signal box and a quadripartite cathedral vault.
IVAPP 2023 - 14th International Conference on Information Visualization Theory and Applications
154
The export includes the collection of VRML and
OBJ files that realise the dynamic 3D model along
with the data files that contain a definition of the
model’s scene graph recording how moving sub-
components are to be attached to a visualization scene
graph and any lookup tables used by the model.
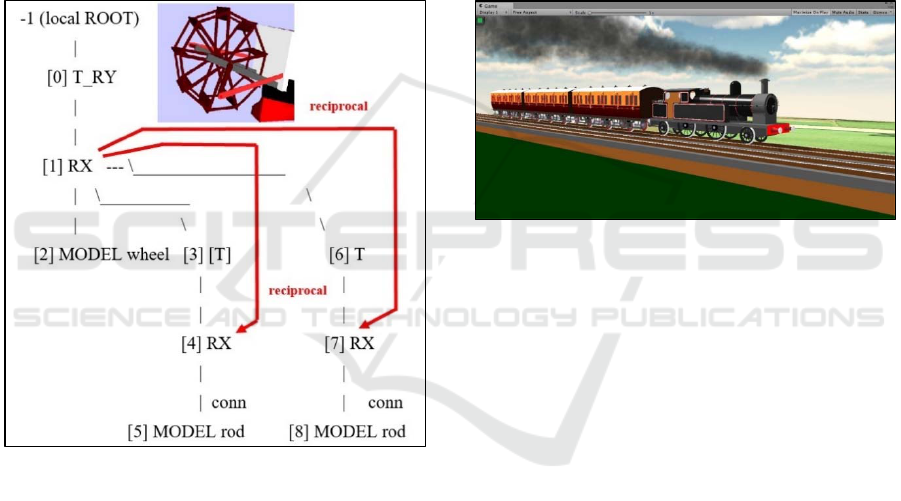
8.1 Model Animation
Models are animated by putting the moving
component VRML or OBJ code into separate files
and loading them into the model’s scene graph
attached to appropriate transform (translation,
rotation and scaling) nodes. During animated
visualization the values of the transform nodes are
continually updated producing the desired animation.
Figure 6: Part of the scene graph for a stern wheeler paddle
steamer showing the transform nodes (T_RY translation
and rotation about Y axis, T translation, RX rotation about
X axis). Node [1] drives nodes [4] and [7]. This means that
the changed value of the RX attribute for node [1] (which
controls the turning of the wheel) is sent to nodes [4] and
[7] where the value is used in the function reciprocal to
modify their RX values and so animate the connecting rods
as the wheel turns. Lookup tables are used for more
complex mechanisms such as Walschaert’s valve gear and
Watt’s parallel motion.
Figure 6 shows the part of a scenario scene graph for
a stern wheeler paddle steamer and showing how
certain nodes are driven by other nodes to realise the
animation.
8.2 Visualization Animation
The visualizations are created by a visualization
compiler. Limited natural English narratives and
transcribed railway timetables are processed to
populate a temporal database. The narratives contain
sentences such as
Train train999 consists of Loco 1400, 2 * carriage
D30, carriage D33.
Train999 is initially parked at Mark4 back
towards Mark3.
Train999 moves to Mark5 facing south at speed
10 mph at 6:04 am
Figure 7 shows a passenger train in a visualization
of the operation of the Lancashire & Yorkshire
railway (LYR) around the year 1905.
Figure 7: Lancashire & Yorkshire Railway (LYR)
locomotive with train in the early 1900s in 3D
visualization.
The path and timings followed by trains and ships are
deduced from the narrative and the operating
characteristics of the trains and ships.
The visualizations are built “offline” using
mathematical models of the motions of trains and
ships. For example, the attributes of the models such
as the tractive effort of steam locomotives and their
weight are used to determine the accelerations of
trains. The mathematical model solutions for location
and heading etc of the trains as they move are
determined at 1 second intervals as the scenario time
progresses. The track paths are identified in the
scenario scene models that contain the track and other
railway infrastructure and buildings embedded in the
landscape. The values are recorded in the keyframe
files as the values of parent transform nodes for the
model locomotives and carriages in the scenario
scene graph.
The keyframe values for nodes within part of the
scene graph for each locomotive and carriage are
determined by deductive modelling. If, for example,
a train is running between two places starting at a
given time and ending at a given time, we determine
the path followed from the track graph. In the simple
The Compilation of 2D and 3D Dynamic Visualizations
155
case, omitting speed restrictions along the path, we
determine the train’s location at each second of its
journey along that path by applying the equations of
motion to the train accelerating, travelling at constant
speed then decelerating to its destination. From these
locations we can deduce the amount of rotation of a
locomotive’s wheels every second along the journey.
From the rotation of the driving wheels we can
determine the location of the attached coupling rods,
connecting rods and valve gear. The values for the
transform nodes for these locomotive components
can then be deduced and recorded in the keyframe
table.
When the visualization is run, on each tick of the
clock, the viewer determines the values to be assigned
to each transform node by interpolation in the table of
keyframes. An exception to this is those actions such
as the recoil of a naval gun whose motion cannot be
adequately modelled by the interpolation of time
points at 1 second intervals. In these cases the current
values of the relevant scene graph transform nodes
are found by running their mathematical models at
that moment in the visualization run. Apart from
interpolation and the use of functions for driven nodes
as shown in Figure 6, all the other model state
calculations are done during the compilation of the
keyframe tables. This means that simulations of, for
example, 6 or more trains can run in a landscape
simultaneously in not very powerful PCs such as
found in a primary school. The realism is open to
further improvement as time permits by using more
sophisticated mathematical models to compute the
transform node values. The effect of changing the
time step from 1 second should also be explored.
8.3 Dynamic 2D and 3D Visualizations
from Railway Timetables
A collaboration of members of the Lancashire &
Yorkshire Railway Society has transcribed the UK
Bradshaw railway passenger timetables of 1906 for
the Lancashire & Yorkshire Railway Company
(LYR). The Society has also transcribed the goods
trains workings of 1920. The visualization compiler
has been modified to read these transcriptions and
display 2D animations of them online (LYR Society,
2016). The visualization compiler enables
transcribers to validate their transcriptions by
identifying wrong timings revealed, for example, by
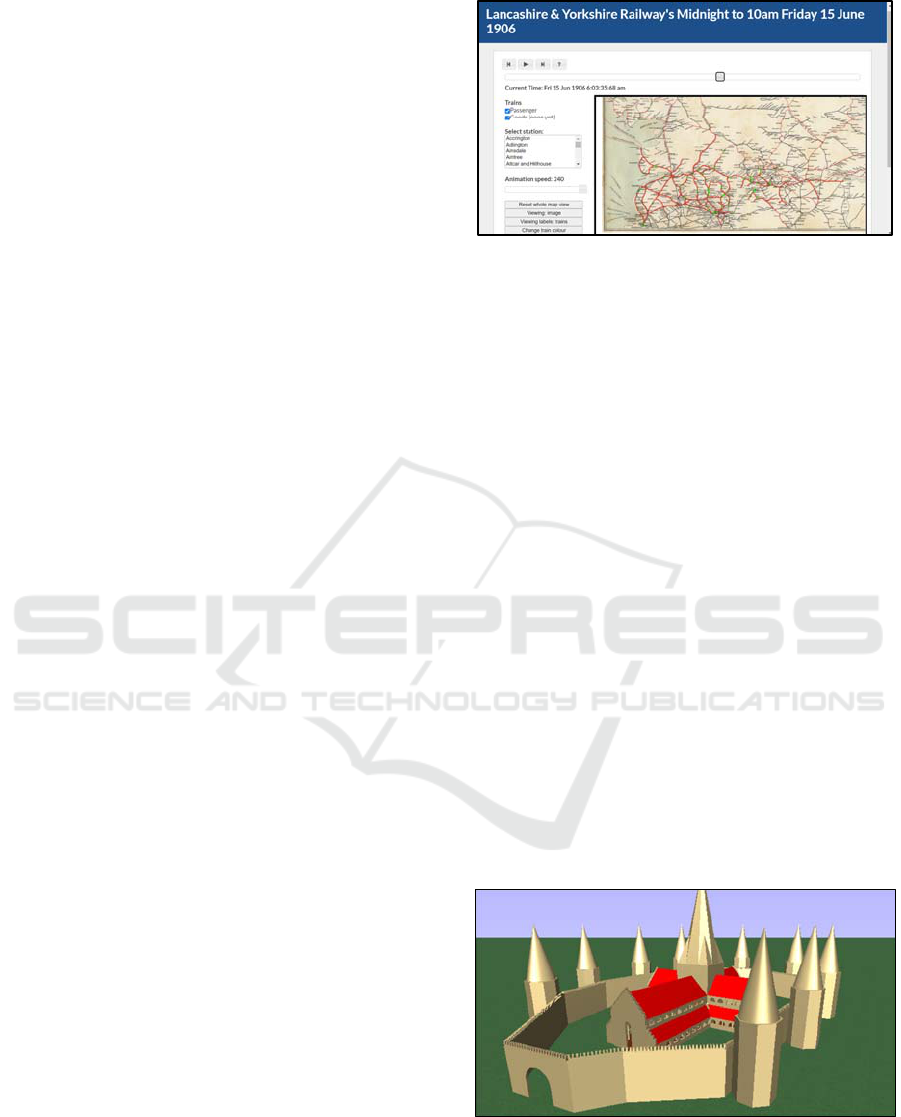
resulting in impossible speeds. Figure 8 shows the
visualization.
Figure 8: 2D animation of Bradshaw 1906 Passenger
Timetable for the Lancashire & Yorkshire Railway
Company.
A prototype online 3D simulation of the timetable
is being developed. The simulation divides the area
served by the Lancashire & Yorkshire Railway into
1-kilometre squares. The prototype covers 24 square
kilometres and includes three stations and the railway
lines joining them – the same region covered by the
model used by the children to run their trains. Each
scheduled train has its scene graph and keyframes
held in an online database to be downloaded on
demand and added to the viewer’s scene graph as
viewing place and time determine.
Future work will include implementing the
simulation on mobile devices so that a “window into
the past” can be created through which visualizations
of historical locations and events can be viewed at the
user’s current location.
9 EVALUATION
As the tools have been developed they have been used
by children aged between 9 and 11 in local primary
schools.
Figure 9: Heavily fortified church built by 10-year-old Luke
and Abby by the end of the morning session.
Our trials with the first standalone, church
building application took place in 2007. They are
IVAPP 2023 - 14th International Conference on Information Visualization Theory and Applications
156

repeated each year by popular demand. The children
learn the structure of churches whose components
include nave, chancel, transepts etc. They then learn
how to use the modelling tool. By the end of the single
morning session they were able to build models
churches as shown in Figure 9:
The children provide an enthusiastic audience and
the activity fits naturally into the curriculum. Church
building has been done from 2007 to the present day
for about 60 children per year.
Building and running locomotives is also popular
and take a day. In the morning the children learn how
steam locomotives work and what the various
components do and how they fit together. They learn
how to use the locomotive model builder and build a
locomotive from a set of measurements (some of
which they made themselves) on simplified
engineering drawings. This has been done, apart from
Covid, for about 60 children per year for 10 years.
In the afternoon the children modify and compile
visualizations and export them to the Unity 3D viewer
to run their locomotives pulling trains on models of
the 1906 railway system in the local area. They learn
how to drive a steam locomotive and run the
locomotives under manual control.
The children have also built and sailed model
paddle steamers around the Liverpool docks by
modifying narrative visualizations and under manual
control.
10 CONCLUSIONS
The model and visualization builders have
demonstrated that it is possible to enable non-
specialist users such as primary school children to
create 3D models and use them in complex, realistic
3D visualizations in a range of viewing environments.
The lack of existing, suitable textual descriptions of
the objects being modelled has been surprising but
this methodology offers tools that make the creation
of such descriptions practical and useful.
The compilation of 3D models from their
component attributes has been applied successfully to
a range of different model types including ships,
locomotives, carriages, beam engines and scenes with
railway networks. Their creation from given
measurements or from invention has been achieved
successfully by hundreds of primary school children
for over 15 years.
Deductive modelling has enabled compilation of
restricted natural language narratives and transcribed
timetables to create complex visualizations on PC,
CAVE and Vive headsets. Improvements in
visualization quality as 3D rendering develops can be
easily applied to legacy visualizations by simple re-
compilation.
The work on developing tools to build a full
online animated model of the Lancashire & Yorkshire
Railway mentioned in Section 8.3 will be generalised
to the exploration of the modelling of other past
worlds such as pre-Reformation England.
REFERENCES
Autodesk 3ds Max Learning Channel, (2022)
https://www.youtube.com/user/3dsMaxHowTos
(Accessed on 08/10/2022).
Backus J., (1978). The history of Fortran I, II, and III.
History of programming languages. Association for
Computing Machinery, New York, NY, USA, pp 25–74
Blender Tutorials, (2022) https://www.blender.org/
support/tutorials/ (Accessed on 08/10/2022)
Casini M., (2022). Construction 4.0 Advanced Technology,
Tools and Materials for the Digital Transformation of
the Construction Industry, Woodhead Publishing
Hassani K., Lee W, (2017) Visualizing Natural Language
Descriptions: A Survey, ACM Computing Surveys,
Volume 49, Issue 1, pp 1-34
Hazlewood P., Oddie A., Presland S., Farrimond B.,
(2011)3D spatiotemporal reconstruction of places and
events for digital heritage. Proceedings of the 2011
international conference on Electronic Visualisation
and the Arts
LYR Society, (2016) Digitising Bradshaw – volunteers
needed, Lancashire and Yorkshire Railway Magazine,
No. 267, April 2016 p 17
MiddleVR, (2022) https://www.middlevr.com/2/ (Accessed
on 15/12/2022)
National Library of Scotland, (2022) Ordnance Survey
Maps. 25 inch England and Wales, 1841-1952
https://maps.nls.uk/os/25inch-england-and-wales/
(Accessed on 01/09/2022).
Presland S., Farrimond B., Hazlewood P., Oddie A., (2010)
Creating Complex Interactive 3D Visualisations of
Naval Battles from Natural Language Narratives.
Developments in e-Systems Engineering, 2010 (DES
2010), London England.
Rhino 3D, (2022) https://www.rhino3d.com/ (Accessed on
04/10/2022)
Sketchup, (2021) Easy 3D Models from 2D Images in
SketchUp https://youtu.be/fjP0THYOSSE (Accessed
on 22/12/2022)
Ugwitz, P., Herman L., and Stachon Z., (2021). 3D
Visualization of Historical Buildings: Methods, Their
Utility in the Tourism Industry and Beyond. Regionální
Rozvoj Mezi Teorií a Praxí 1:43-62
zBrush, (2021) Zbrush Core Mini Tutorial https://
youtu.be/-T2xlU7MB2Q (Accessed on 15/12/2022).
The Compilation of 2D and 3D Dynamic Visualizations
157
