
Spontaneous Cardiac-Locomotor Coupling in Healthy Individuals
During Daily Activities
Aurora Rosato
1 a
, Matilda Larsson
1 b
, Eric Rullman
2 c
and Seraina A. Dual
1 d
1
Department of Biomedical Engineering, KTH Royal Institute of Technology, Stockholm, Sweden
2
Division of Clinical Physiology, Department of Laboratory Medicine, Karolinska Institutet,
Karolinska University Hospital Huddinge, Stockholm, Sweden
Keywords:
Cardiac-Locomotor Coupling, Wearable Sensor, Exercise, Lifelogging.
Abstract:
During exercise, the locomotor and the cardiovascular system work in synergy to control the blood flow
through the body. In particular, the muscle contraction generates rhythmic raising and lowering of intramus-
cular pressure, which in synergy supports cardiovascular function. This study aims to analyze spontaneous
cardiac-locomotor coupling (CLC) events during daily activities using weareable sensors. We analyze the data
set PMData, containing recordings from sixteen healthy subjects during five months. The data were acquired
with a smartwatch and consist of step rate (SR), heart rate (HR) and daily surveys reporting the training ses-
sions. Coupling is defined as being present when SR and HR are within 1% of each other (strong coupling)
and within the 10% of each other (weak coupling). The results show that every subject presents occurrences
of CLC while performing normal daily activities. In particular, strong coupling occurs more likely for longer
activities (111 ± 34 min), at moderate intensity (100
steps
min
< SR > 130
steps
min
). The presence of CLC during
daily activities rises the question whether there is a physiological mechanism controlling this phenomenon,
that should be investigated in future.
1 INTRODUCTION
The human body is made of a set of systems that work
in synergy to achieve maximum efficiency, within cer-
tain metabolic and bio-mechanical constraints. The
cardiovascular, the respiratory and the locomotor sys-
tem affect blood flow.
In fact, during locomotion, blood flow through
the body is influenced by two opposing pumps. The
pumping of the heart delivers the blood to the whole
body and the skeletal muscle pump, through periodic
increases of intramuscular pressure and venous return
(Novak et al., 2007), pumps it back to the heart. If
these two pumps become entrained, with equal con-
traction rates, the cardiac-locomotor coupling (CLC)
phenomenon occurs (Niizeki and Saitoh, 2014).
Prior studies of CLC investigate the interaction
between the cardiovascular and the locomotor sys-
tem during rhythmic exercise in the laboratory setting
a
https://orcid.org/0000-0002-8768-2619
b
https://orcid.org/0000-0002-5795-9867
c
https://orcid.org/0000-0003-2854-7262
d
https://orcid.org/0000-0001-6867-8270
(Kirby et al., 1989; Hausdorff et al., 1992; Constan-
tini et al., 2018; Takeuchi et al., 2014). In the past, re-
searchers used different signal processing techniques
to identify the CLC during exercise. One method con-
sists in processing the electrocardiogram (ECG) and
the acceleration, identifying the rates and calculating
the ratio between the heart rate (HR) and the step rate
(SR) (Kirby et al., 1989). Another technique consists
in analyzing the frequency spectrum and the coher-
ence of the acquired signals (Hausdorff et al., 1992;
Niizeki et al., 1993). It has been demonstrated that
the HR increases when the muscle contraction is syn-
chronized with the systolic phase of the cardiac cycle
(Niizeki and Miyamoto, 1999). In contrast, if oppor-
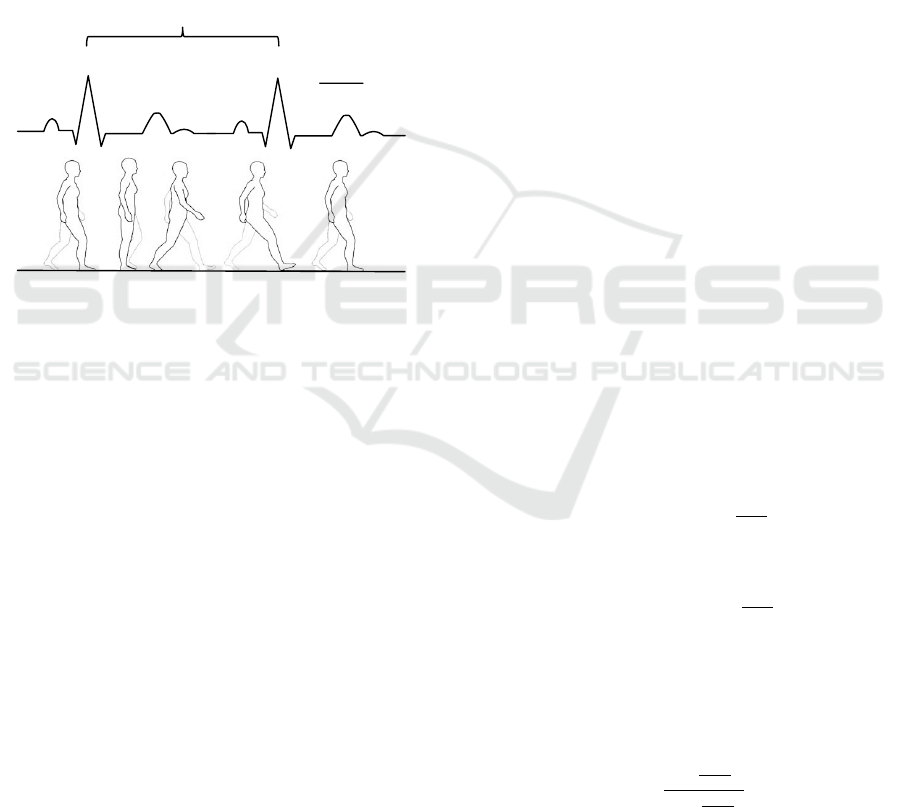
tunely synchronized with diastole (see Figure 1), it
can reduce the HR and the ventilation, indicating im-
proved cardiac efficiency (Constantini et al., 2018).
All prior studies on CLC take place in controlled,
monitored environments and study short-term activ-
ities such as walking and running on a treadmill or
cycling (Nomura et al., 2003). However, the physi-
ological occurrence of CLC remains elusive. In par-
ticular, we do not know if humans in their daily lives
experience CLC, a necessary condition to allow for
170
Rosato, A., Larsson, M., Rullman, E. and Dual, S.
Spontaneous Cardiac-Locomotor Coupling in Healthy Individuals During Daily Activities.
DOI: 10.5220/0011632700003414
In Proceedings of the 16th International Joint Conference on Biomedical Engineering Systems and Technologies (BIOSTEC 2023) - Volume 4: BIOSIGNALS, pages 170-177
ISBN: 978-989-758-631-6; ISSN: 2184-4305
Copyright
c
2023 by SCITEPRESS – Science and Technology Publications, Lda. Under CC license (CC BY-NC-ND 4.0)
diastolic synchronization. Our hypothesis is that the
CLC is a common occurrence across individuals, not
only in laboratory settings but also during activities of
daily life.
The use of smartphones and wearables has be-
come common practice to record signals about phys-
ical activities and health status, called lifelogging
(Karami et al., 2021). Exploiting this trend, this
study aims to use lifelog data to analyze the extent
of CLC occurrences during non-monitored daily ac-
tivities, collected retrospectively from a wrist-worn
wearable device. Moreover, we want to investigate
how occurrence of CLC depends on the intensity, the
type and the duration of the activity and subject-age.
Cardiac cycle
ECG
Figure 1: Timing of cardiac cycle and gait cycle during di-
astolic cardiac-locomotor coupling.
2 METHODS
2.1 Study Population
We used a retrospectively acquired dataset called PM-
Data (Thambawita et al., 2020). The dataset contains
data collected from 16 healthy subjects (13 men and
3 women), aged between 23 and 60 years (34.85 ±
11.67 years) (Table 1).
The participants were grouped into elderly and
young to assess inter-class differences using a com-
mon threshold of 40 years of age. The elderly group
presents 5 subjects (49.80 ± 7.22 years) and the young
group 11 subjects (28.09 ± 4.64 years).
2.2 Study Protocol and Recorded
Variables
The participants wore a Fitbit Versa 2 (Fitbit.Inc, San
Francisco) for a period of 5 months, from November
2019 to the end of March 2020. They were encour-
aged to wear the smartwatch as much as possible. The
study organizers did not impose any restrictions or re-
quirements on the type or duration of exercise (Tham-
bawita et al., 2020).
The Fitbit acquired SR per minute and HR per 5
seconds. Each entry has a timestamp that allows to
synchronize samples from different files. Moreover,
the participants were encouraged to use PM Reporter
Pro smartphone application (Forzasys AS c/o Simula
Research Laboratory, Oslo) to collect subjective as-
sessments of training load, reported after every train-
ing session. The subjective assessments of training
load are collected in CSV-files named Session Rating
of Perceived Exertion (SRPE). Each SRPE file con-
tains the type of activity performed, the training ses-
sion’s end time, the duration and the rate of perceived
exertion (RPE), used to assess the internal training
load.
2.3 Data Analysis
The files were processed in MATLAB R2022a (The
MathWorks, Natick, MA) for all analyses. We used
the Statistic and Machine Learning Toolbox.
Since the HR and the SR were not acquired with the
same sampling rate, we first synchronized both sig-
nals using the timestamp information. The HR was
averaged per minute, in order to match the time res-
olution of the SR and to account for possible fluctua-
tion in HR due to potential fluctuations in device ac-
curacy.
The data were filtered to instances of physi-
cal activity with the goal to delete instances of
sleep and rest. We used the metabolic equivalent
of task (METs) to evaluate physical activity inten-
sity. One metabolic equivalent represents the oxy-
gen consumption while sitting at rest (1 MET= 3.5
ml O
2
/kg/min)(Jett
´
e et al., 1990). We used a MET
level of 2 and a threshold of 60
steps
min
as indicative of
instances of physical activity, as this SR was previ-
ously identified as slow walking in a study population
of adults older than 20 years of age. (Tudor-Locke
et al., 2011). All data below 60
steps
min
were excluded
from the analysis.
2.3.1 Cardiac-Locomotor Coupling
To find evidence of CLC, the ratio between SR and
HR, defined as:
R =
SR(
steps
min
)
HR(
beats
min
)
(1)
was computed for each entry. Coupling is defined as a
deviation between SR and HR of < 1% (Kirby et al.,
1989). We group the data into uncoupling (deviation
> 10%), weak coupling (deviation < 10%) and strong
Spontaneous Cardiac-Locomotor Coupling in Healthy Individuals During Daily Activities
171

coupling (deviation < 1%) for further considerations.
We introduced a new parameter to evaluate the devia-
tion from the ideal ratio 1:1. We called this parameter
coupling parameter and we defined it as follow.
C = |
SR(
steps
min
)
HR(
beats
min
)
− 1| (2)
We used violin plot of the SR and the HR to look
at their distribution. We decided to group the subjects
in three groups, according to the number of step rates
at which strong coupling occurred. In group 1, strong
coupling occurred at one specific step rate, in group 2
at two step rates and in group 3 at three step rates.
2.3.2 Timing, Duration and Intensity
We analyzed the timing, the duration and the intensity
of physical activities. For these calculations, we only
used the dataset with SR and HR, which contains no
information reported by the participant about which
activity was performed.
We defined an activity as consecutive observations
with a difference between them smaller than one hour.
In this way, we were able to investigate the training
habits and to calculate:
• the mean duration of activities
• the time of the day at which the activities were
conducted
Furthermore, we stratified the data into three
groups according to their heuristic cadence thresh-
olds of 100
steps
min
and 130
steps
min
which are associated to
moderate and vigorous intensity, respectively (Tudor-
Locke et al., 2019; Tudor-Locke et al., 2020; Tudor-
Locke et al., 2021). Hence, we divided the intensity of
any activity in three different groups: light, moderate
and vigorous activity.
2.3.3 Type of Training
We combined the information from the Fitbit and the
one reported in the SRPE, described in the section 2.2.
The reports about the training load contain four vari-
ables: end time of the training, type of training, dura-
tion and RPE. For each entry, the mean coupling pa-
rameter was calculated and the data were grouped ac-
cording to two activities (running and strength train-
ing). Moreover, we computed the percentage of cou-
pling for each training.
2.4 Statistical Analysis
Firstly, we plotted the distribution of the ratio to as-
sess if coupling (1:1) was more likely then any other
ratio. Then, a Chi-squared test was used to determine
if the distribution of the ratio, coupling parameter, HR
and SR is normal. Since these data were not nor-
mally distributed, we used nonparametric statistical
tests to assess differences. Median and standard de-
viation were computed for each parameter of interest.
For the amount of coupling, the timing and the per-
centage of occurrences, mean and standard deviation
were calculated instead.
We chose the Kruskal-Wallis test to test statisti-
cally significant differences in grouping the subjects,
according to their preferred SR, as explained in sec-
tion 2.3.1. A Friedman test was instead used to assess
statistically significant differences within the same
group during different activities and coupling condi-
tions. Pearson correlation coefficient was calculated
to evaluate the relationship between HR and SR, me-
dian ratio and median coupling parameter and age.
The results were considered statistically significant at
P ≤ 0.05.
3 RESULTS
3.1 Participant Characteristics
Demographic and physiologic data during strong cou-
pling are summarized in table 1. The median HR dur-
ing strong coupling ranges from 87 to 115
beats
min
, with
no statistically significant difference between the el-
derly and the young subjects. For each subject, there
are between 683375 and 1819246 HR and SR entries
acquired from Fitbit. No data from either HR or SR
are missing. In the PM reporter app, instead, the par-
ticipants registered less data, by adding from 2 to 113
training session. Moreover, only one subject did not
record any training session.
3.2 Cardiac-Locomotor Coupling
Evidence of strong coupling was found in each sub-
ject. The distribution of the ratio is not normal, but
centered around a subject specific median that ranges
between 0.87 and 1. The median of the ratio over
all subjects is 0.94. The centered distribution indi-
cates that subjects prefer to adjust their SR and HR
rather than those two quantities being independently
controlled. Figure 2 shows the distribution of the ra-
tio, plotted with different bin sizes, considering all the
subjects during the entire observational period. By re-
ducing the bin size, the peak at 1 becomes more ev-
ident. This result highlights how spontaneous strong
coupling is prevalent during normal daily activities.
BIOSIGNALS 2023 - 16th International Conference on Bio-inspired Systems and Signal Processing
172
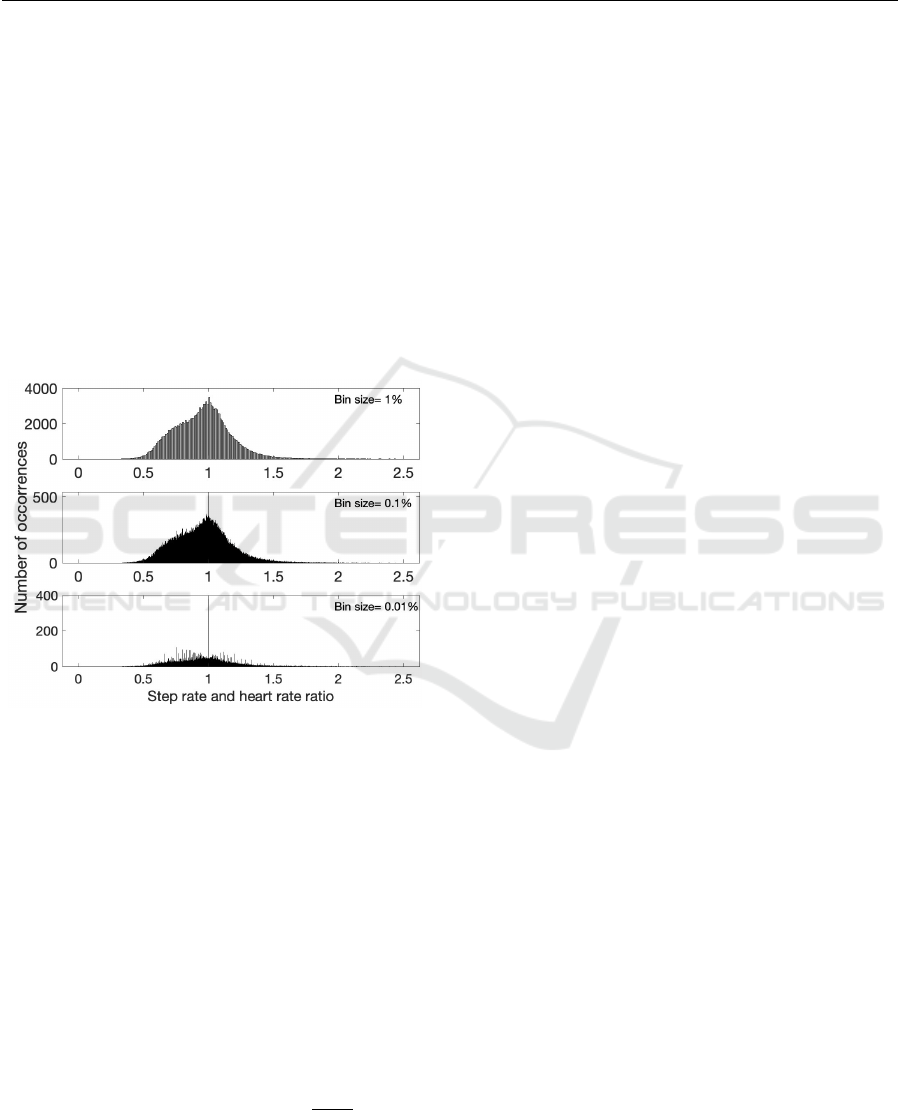
Table 1: Demographic characteristics of the participants, heart rate and step rate during strong coupling, coupling parameter
and ratio. STD, standard deviation.
Subject Age Height Gender Heart rate Step rate Coupling parameter Ratio
Median STD Median STD Median STD Median STD
1 48 195 male 99.4 21.1 99 21.1 0.14 0.13 0.96 0.20
2 60 180 male 106 23.6 106 23.6 0.12 0.15 1.00 0.22
3 25 184 male 107 11.1 107 11.0 0.12 0.12 0.92 0.17
4 26 163 female 113 26.1 113 26.2 0.11 0.13 0.93 0.17
5 35 176 male 102 13.1 102 13.1 0.16 0.12 0.87 0.18
6 42 179 male 87.7 33.8 87 33.8 0.16 0.14 0.99 0.24
7 26 177 male 112 33.8 112 33.8 0.13 0.13 0.99 0.21
8 27 186 male 110 28.3 110 28.3 0.13 0.13 0.96 0.20
9 26 180 male 109 14.6 109 14.6 0.13 0.13 0.98 0.21
10 38 179 female 111 13.4 111 13.4 0.11 0.13 0.92 0.17
11 25 171 female 115 11.6 115 11.6 0.12 0.14 0.90 0.17
12 27 178 male 110 14.0 110 14.0 0.12 0.12 0.94 0.19
13 31 183 male 109 23.4 109 23.4 0.18 0.13 0.86 0.21
14 45 181 male 113 25.3 113 25.3 0.14 0.12 1.04 0.20
15 54 180 male 108 23.5 108 23.6 0.18 0.14 0.95 0.24
16 23 182 male 104 7.87 104 7.91 0.13 0.13 0.91 0.17
Figure 2: Ratio distribution.
The violin plots of HR and SR show that each
participant has one, two or three different step rates
at which strong coupling occur (Figure 3). This evi-
dence was used to group the subjects, as presented in
2.3.1. We observe that group 1 includes 7 subjects,
28.4 ± 5.7 years; group 2 includes 8 subjects, 39.6 ±
13.7 years, and group 3 only includes one subject, 42
years old. Overall, it can be noticed that the total per-
centage of strong coupling occurrences is higher and
the coupling parameter is smaller for the group 1 com-
pared with group 2 and 3. However, no statistically
significance was shown in any of the above mentioned
parameters. The grey line in Figure 3 represents the
threshold for moderate intensity activity. We can no-
tice that for subjects 10 and 4, the strong coupling is
prevalent when walking at a SR of 100
steps
minute
or more.
We found higher SR in instances of strong cou-
pling vs. uncoupling (109 vs. 85, p=4.4 ∗ 10
−7
), and
in instances of weak coupling vs. uncoupling (107
vs. 85, p=0.0028). Statistically significant differ-
ence was found also in the HR between the condi-
tion uncoupling and strong coupling (109 vs. 101, p=
6.02 ∗ 10
−4
).
No correlation was found between the median of
the ratio and the age or the height of the subjects. The
same was found for the median of the coupling pa-
rameter and age and height.
3.3 Timing, Duration and Intensity
The following results present the differences found in
the uncoupling, weak coupling and strong coupling
occurrences among the subjects and the activities.
We found that each subject has a percentage of
strong coupling occurrences ranging from 3% and
7% and a percentage of weak coupling occurrences
ranging from 26% and 40%, calculated over the five
months of observational period (Figure 4).
We noticed differences in the percentage of cou-
pling occurrences between the young group (aged be-
tween 23 and 40 years) and the elderly group (aged
between 40 and 60 years). Occurrences of weak cou-
pling and uncoupling are significantly higher in the
young group (33.61 vs. 36.19, p=0.0036 and 62,02 vs.
59.07, p=0.0068, respectively). No differences were
found between the elderly group and the younger
group as regard to the strong coupling (3.98 vs. 4.74,
p=0.08).
The percentage of strong coupling occurrences
(Figure 5) was significantly higher when perform-
Spontaneous Cardiac-Locomotor Coupling in Healthy Individuals During Daily Activities
173
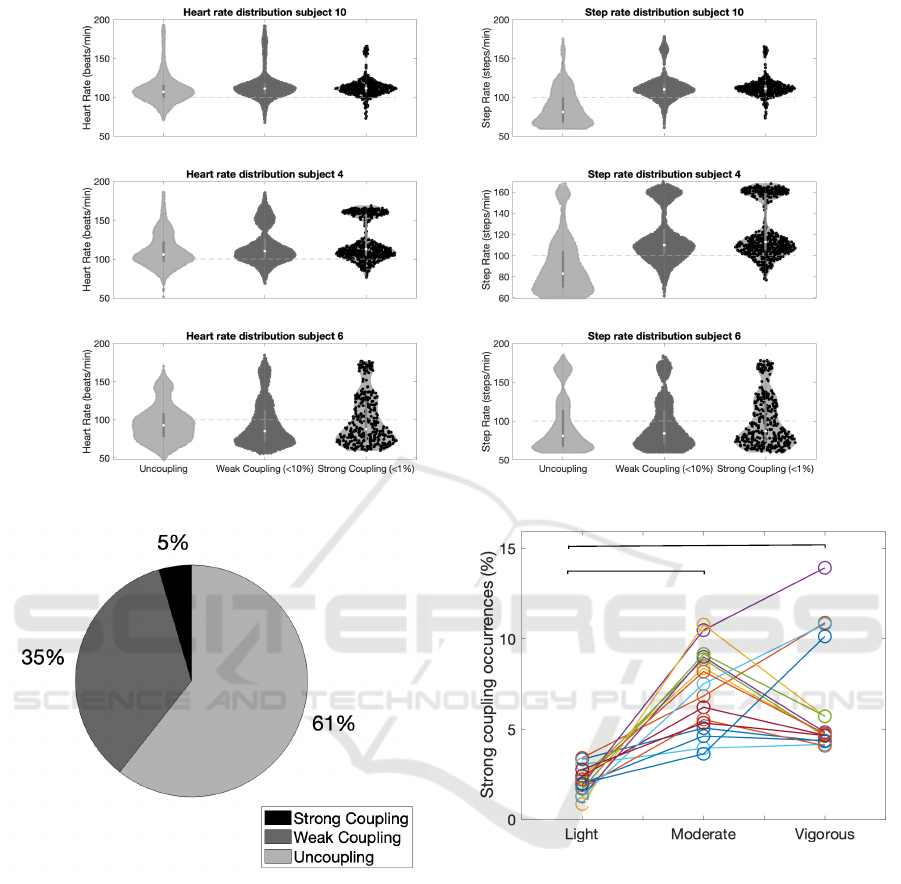
Figure 3: Violin plot of heart rate and step rate for three of the subjects.
Figure 4: Coupling occurrences in percentage, mean for all
subjects.
ing moderate activities compared to light activities
(7.17% vs. 2.10%, p=5.42 ∗ 10
−6
) and when per-
forming vigorous activities compared to light activ-
ities (4.745% vs. 2.10%, p=6.01 ∗10
−4
).
The mean duration of activities (Figure 6) is sig-
nificantly higher in presence of strong coupling events
vs. uncoupling (111.31 vs. 69.89 min, p=4.4 ∗ 10
−8
)
in strong coupling vs. weak coupling events (111.31
in vs. 80.26 min, p=0.013) and in weak coupling
events vs uncoupling (80.26 vs. 69.89 min, p=0.013).
We found no correlation between the time of the
day at which the activity is performed and the cou-
pling strength (12.89 vs. 13.10 vs. 13.00 , p=0.2 for
p=6*10
-4
p= 5* 10
-6
Figure 5: Percentage of strong coupling occurrences during
different activity intensity for each subject.
uncoupling, weak coupling and strong coupling, re-
spectively). In particular, most of the activity is dis-
tributed between 10h and 19h.
3.4 Type of Training
As regard to type of training, we found that coupling
(both strong and weak) occurred to a larger extent
during running exercises than during strength training
(6.05% vs. 4.00%, p=0.004 and 39.30% vs. 27.50%,
p=0.007, respectively).
BIOSIGNALS 2023 - 16th International Conference on Bio-inspired Systems and Signal Processing
174
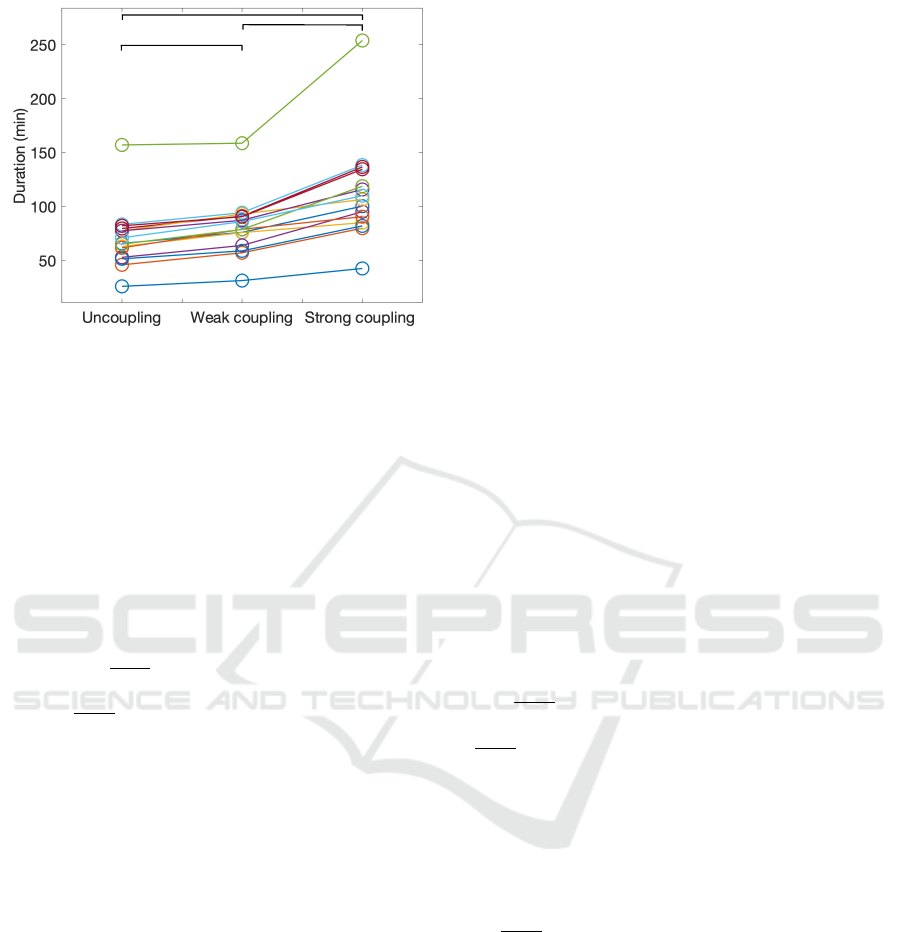
p=0.013
p=0.013
p= 4* 10
-8
Figure 6: Mean activity duration for each subject.
4 DISCUSSION
Using lifelogging data, this study shows that every
subject presents occurrences of CLC. Furthermore,
the ratio 1:1 between SR and HR seems to occur
more frequently than other ratios. Previous studies
in laboratory settings claim that some of the subjects
never coupled (Kirby et al., 1989; Novak et al., 2007;
De Bartolo et al., 2021; Hausdorff et al., 1992). In
particular, one laboratory study found that CLC oc-
curred only in 18/25 subjects for step rates between
106 and 150
steps
minute
(Kirby et al., 1989). During daily
activities, instead, we found a median SR between 87
and 115
steps
minute
. The comparison of these two settings
indicates that the SR of the subjects in the laboratory
could be influenced by the use of the treadmill, which
might affect the choice of a comfortable walking step
rate.
When exercising, the cardiovascular system
adapts to meet the metabolic demand of the sys-
temic system including the skeletal muscles (Mur-
phy et al., 2011). Physiology tells us that the inter-
action between cardiovascular and locomotor system
originates in the interplay of the parasympathetic and
sympathetic system. During muscle activity, the sym-
pathetic nervous system is activated, which, in turn,
increases the arterial blood pressure, the HR and the
vascular resistance (Murphy et al., 2011). In this way,
we expect the HR to rise with increasing in metabolic
activity level, or increasing step frequency. The pos-
itive correlation between SR and HR was observed
for all subjects in the present study. Additionally, we
found that a 1:1 correspondence is most likely, which
raises new research questions regarding the interac-
tion of the cardiovascular and the locomotor system.
While previous studies focused only on the strong
coupling, we also investigated when and to what ex-
tent the two rhythms were within 10% to each other
(weak coupling). Even though the strong coupling is
present only in the 5% of the observational period,
during the 30% of the total time the HR and SR are
within the 10% of each other. This result highlights
that CLC can be reached without changing or forcing
the physiology of the body.
In a laboratory study, they compared CLC dur-
ing running and cycling and they demonstrated that
CLC exists for longer periods during running com-
pared to cycling (113.6s vs 58s, p < 0.05) (No-
mura et al., 2003). Our analysis shows that cou-
pling occurred to a larger extent during running com-
pared to strength trainings. Running seems to en-
hance the CLC, compared to other training activities,
which align with what we found during daily activi-
ties. Moreover, in the laboratory settings some sub-
jects coupled only while running and not while walk-
ing (Kirby et al., 1989). The differences between the
occurrence of CLC during walking compared with
running, could be due to the duration of the labora-
tory experiment. In fact, with higher exercise inten-
sity, the HR approaches the SR more rapidly than
during walking (Kirby et al., 1989). In our study,
we found that the duration of the activity is higher
in presence of strong coupling (111 min± 34 min),
whereas in the laboratory study only 2-5 min of walk-
ing were performed (Kirby et al., 1989). However,
we also found that there are some subjects who cou-
ple more while performing vigorous activities (SR >
130
steps
minute
) and other who couple more while per-
forming moderate activities (SR > 100 and < 130
steps
minute
), compared to light activities. The body seems
to approach CLC rapidly when the exercise intensity
is higher and slowly when walking at lower speed.
The extent and speed of sympathetic activation re-
sults in different HR effects depending on the subject
level of training. In a trained subject, we expect the
resting HR to be lower than in an untrained subject.
The subjects in our study have a resting HR below
70
beats
minute
, indicating a good level of training. During
running, the trained subject is engaged in rhythmic
exercises and we would more likely observe a sta-
ble 1:1 ratio between HR and SR. The observation
we made regarding the number of SR at which strong
coupling occur can be dependent on the training habit
of the participants, rather than on the CLC effect. The
study reports the time it took each subject to run 5km,
however, we did not find the results very credible and
therefore did not use them in this analysis.
The small size of our study population, charac-
terized by only healthy subjects, limits any discus-
sion concerning intra-subject characteristics, like age
or height that may enhance or inhibit the CLC. In a
Spontaneous Cardiac-Locomotor Coupling in Healthy Individuals During Daily Activities
175

previous study (Novak et al., 2007), they show that
HR and SR were coupled only for the elderly group
(70.3 ± 5.1 years) and not for the young participants
(29.0 ± 5.0 years). In our study cohort, we found
no differences in the extent of strong CLC between
the participants aged <40 years vs. > 40 years old.
However, the young cohort expressed higher extent of
weak coupling. The reason could be due to the small
number of elderly subjects, which consisted of 5 sub-
jects (49.8 ± 7.2 years) in our study compared to 9
subject (70.3 ± 5.1 years) in the study (Novak et al.,
2007). Further research including more subjects with
an higher average age may be useful to investigate
age-related physiological effects.
Smartwatches are a powerful tool to obtain in-
sights and information about non-monitored daily ac-
tivities, that would otherwise be difficult to obtain.
However, the advantage of unsupervised data collec-
tion could translate in non-monitored artifacts in the
data. One example could be detecting steps when the
person is using the hands for other tasks, but is not
exercising. Another could be that rhythmic move-
ment of the wrist during exercise, induces wrongly
detected heart beats. Furthermore, we expect motion
related measurement artefacts to increase with activ-
ity level. However, most coupling was found at mod-
erate intensity. The HR detection from a wrist-worn
device relies on the photoplethsmography (PPG) sig-
nal, a technique that has various limitations compared
to the chest-worn sensors, which rely directly on the
electrocardiogram (Boudreaux et al., 2018). Tight
compression of the device on the skin, changes in skin
temperature and perfusion and contraction of skeletal
muscle in the forearm and in the hand, are some of
the cause of artifacts in the PPG signal that can lead
to underestimation of HR (Boudreaux et al., 2018).
In the future, a chest-worn device with higher accu-
racy, less prone to artifacts and more robust against
HR measurements, should be utilized (Feehan et al.,
2018; Chevance et al., 2022; Sj
¨
oberg et al., 2021).
The dataset included reports of step rates and heart
rates. However, the reports did not allow a study of
the synchronization of both time series signals with
respect to each other. In particular, it would be in-
teresting to understand if the subjects synchronized
each step with the diastolic or systolic part of the car-
diac cycle. Current wearable devices do not regis-
ter the acceleration and cardiac signals on the same
clock, which makes it harder to study such high time-
resolution phenomena. In particular, no dataset ex-
ists that records these signals during daily activities.
The identification of CLC events during every day
activities presented in this work raises further ques-
tions to whether there is a physiologic mechanism that
controls CLC. Unfortunately, the dataset lacked suf-
ficient reports of perceived exertion during coupling
and uncoupling and thus did not allow for investiga-
tion of physiological benefits of CLC in terms of ex-
ercise performance. In the future it should be investi-
gated whether CLC could offer a more efficient way
of training.
5 CONCLUSIONS
In conclusion, we found evidences of spontaneous
CLC during daily activities in every subject. In par-
ticular, CLC occurs more likely when the subject en-
gages in long activities at moderate intensity. More-
over, the ratio 1:1 between SR and HR seems to pre-
vail over any other ratio. By improving the under-
standing occurrence of CLC in daily life, this work
supports further research on customised training and
rehabilitation programs. Future work will address the
synchronization between cardiac contraction and the
gait cycle using temporal and spectral signal analysis
techniques.
REFERENCES
Niizeki, Kawahara, and Miyamoto (1993). Cardiac, res-
piratory, and locomotor coordination during walking
in humans. Folia primatologica., 66(1-4):226–239.
Place: [Basel, Switzerland] : Publisher: Karger.
Boudreaux, B. D., Hebert, E. P., Hollander, D. B., Williams,
B. M., Cormier, C. L., Naquin, M. R., Gillan, W. W.,
Gusew, E. E., and Kraemer, R. R. (2018). Validity of
Wearable Activity Monitors during Cycling and Re-
sistance Exercise. Medicine and Science in Sports and
Exercise, 50(3):624–633. ISBN: 0000000000.
Chevance, G., Golaszewski, N. M., Tipton, E., Hek-
ler, E. B., Buman, M., Welk, G. J., Patrick, K.,
and Godino, J. G. (2022). Accuracy and Preci-
sion of Energy Expenditure, Heart Rate, and Steps
Measured by Combined-Sensing Fitbits Against Ref-
erence Measures: Systematic Review and Meta-
analysis. JMIR mHealth and uHealth, 10(4):e35626.
Company: JMIR mHealth and uHealth Distribu-
tor: JMIR mHealth and uHealth Institution: JMIR
mHealth and uHealth Label: JMIR mHealth and
uHealth Publisher: JMIR Publications Inc., Toronto,
Canada.
Constantini, K., Stickford, A. S. L., Bleich, J. L.,
Mannheimer, P. D., Levine, B. D., and Chapman,
R. F. (2018). Synchronizing Gait with Cardiac Cy-
cle Phase Alters Heart Rate Response during Run-
ning. Medicine & Science in Sports & Exercise,
50(5):1046–1053.
De Bartolo, D., De Giorgi, C., Compagnucci, L., Betti, V.,
Antonucci, G., Morone, G., Paolucci, S., and Iosa, M.
BIOSIGNALS 2023 - 16th International Conference on Bio-inspired Systems and Signal Processing
176

(2021). Effects of cognitive workload on heart and
locomotor rhythms coupling. Neuroscience Letters,
762:136140.
Feehan, L. M., Geldman, J., Sayre, E. C., Park, C., Ez-
zat, A. M., Yoo, J. Y., Hamilton, C. B., and Li,
L. C. (2018). Accuracy of Fitbit Devices: System-
atic Review and Narrative Syntheses of Quantitative
Data. JMIR mHealth and uHealth, 6(8):e10527. Com-
pany: JMIR mHealth and uHealth Distributor: JMIR
mHealth and uHealth Institution: JMIR mHealth and
uHealth Label: JMIR mHealth and uHealth Publisher:
JMIR Publications Inc., Toronto, Canada.
Hausdorff, J. M., Forman, D. E., Pilgrim, D. M., Rigney,
D. R., and Wei, J. Y. (1992). A new technique
for simultaneous monitoring of electrocardiogram and
walking cadence. The American Journal of Cardiol-
ogy, 70(11):1064–1071.
Jett
´
e, M., Sidney, K., and Bl
¨
umchen, G. (1990). Metabolic
equivalents (METS) in exercise testing, exercise pre-
scription, and evaluation of functional capacity. Clin-
ical Cardiology, 13(8):555–565.
Karami, Z., Hines, A., and Jahromi, H. Z. (2021). Leverag-
ing IoT Lifelog Data to Analyse Performance of Phys-
ical Activities. In 2021 32nd Irish Signals and Systems
Conference (ISSC), pages 1–6. ISSN: 2688-1454.
Kirby, R. L., Nugent, S. T., Marlow, R. W., Macli$od, D. A.,
Alan, Marble, E., Lee, R., Nugent, S. T., Mar, R. W.,
and Macleod, D. A. (1989). Coupling of cardiac and
locomotor rhythms. J. Appl. Physiol, pages 323–329.
Murphy, M. N., Mizuno, M., Mitchell, J. H., and
Smith, S. A. (2011). Cardiovascular regulation
by skeletal muscle reflexes in health and disease.
American Journal of Physiology-Heart and Circu-
latory Physiology, 301(4):H1191–H1204. eprint:
https://doi.org/10.1152/ajpheart.00208.2011.
Niizeki, K. and Miyamoto, Y. (1999). Phase-dependent
heartbeat modulation by muscle contractions dur-
ing dynamic handgrip in humans. American Jour-
nal of Physiology-Heart and Circulatory Physiology,
276(4):H1331–H1338. Publisher: American Physio-
logical Society.
Niizeki, K. and Saitoh, T. (2014). Cardiolocomotor phase
synchronization during rhythmic exercise. The Jour-
nal of Physical Fitness and Sports Medicine, 3(1):11–
20.
Nomura, K., Takei, Y., and Yanagida, Y. (2003). Compar-
ison of cardio-locomotor synchronization during run-
ning and cycling. European Journal of Applied Phys-
iology, 89(3):221–229.
Novak, V., Hu, K., Vyas, M., and Lipsitz, L. A. (2007).
Cardiolocomotor Coupling in Young and Elderly Peo-
ple. The Journals of Gerontology Series A: Biological
Sciences and Medical Sciences, 62(1):86–92.
Sj
¨
oberg, V., Westergren, J., Monnier, A., Martire, R. L.,
Hagstr
¨
omer, M.,
¨
Ang, B. O., and Vixner, L. (2021).
Wrist-Worn Activity Trackers in Laboratory and Free-
Living Settings for Patients With Chronic Pain: Cri-
terion Validity Study. JMIR mHealth and uHealth,
9(1):e24806. Company: JMIR mHealth and uHealth
Distributor: JMIR mHealth and uHealth Institution:
JMIR mHealth and uHealth Label: JMIR mHealth and
uHealth Publisher: JMIR Publications Inc., Toronto,
Canada.
Takeuchi, S., Nishida, Y., and Mizushima, T. (2014). Ef-
fects of Synchronization between Cardiac and Loco-
motor Rhythms on Oxy- gen Pulse during Walking.
page 7.
Thambawita, V., Hicks, S. A., Borgli, H., Stensland, H. K.,
Jha, D., Svensen, M. K., Pettersen, S.-A., Johansen,
D., Johansen, H. D., Pettersen, S. D., Nordvang, S.,
Pedersen, S., Gjerdrum, A., Grønli, T.-M., Fredriksen,
P. M., Eg, R., Hansen, K., Fagernes, S., Claudi, C.,
Biørn-Hansen, A., Nguyen, D. T. D., Kupka, T., Ham-
mer, H. L., Jain, R., Riegler, M. A., and Halvorsen, P.
(2020). PMData: a sports logging dataset. In Proceed-
ings of the 11th ACM Multimedia Systems Conference,
pages 231–236, Istanbul Turkey. ACM.
Tudor-Locke, C., Aguiar, E. J., Han, H., Ducharme, S. W.,
Schuna, J. M., Barreira, T. V., Moore, C. C., Busa,
M. A., Lim, J., Sirard, J. R., Chipkin, S. R., and Stau-
denmayer, J. (2019). Walking cadence (steps/min)
and intensity in 21–40 year olds: CADENCE-adults.
The International Journal of Behavioral Nutrition and
Physical Activity, 16:8.
Tudor-Locke, C., Camhi, S. M., Leonardi, C., Johnson,
W. D., Katzmarzyk, P. T., Earnest, C. P., and Church,
T. S. (2011). Patterns of adult stepping cadence
in the 2005-2006 NHANES. Preventive Medicine,
53(3):178–181.
Tudor-Locke, C., Ducharme, S. W., Aguiar, E. J., Schuna,
J. M., Barreira, T. V., Moore, C. C., Chase,
C. J., Gould, Z. R., Amalbert-Birriel, M. A., Mora-
Gonzalez, J., Chipkin, S. R., and Staudenmayer, J.
(2020). Walking cadence (steps/min) and intensity in
41 to 60-year-old adults: the CADENCE-adults study.
The International Journal of Behavioral Nutrition and
Physical Activity, 17:137.
Tudor-Locke, C., Mora-Gonzalez, J., Ducharme, S. W.,
Aguiar, E. J., Schuna, J. M., Barreira, T. V., Moore,
C. C., Chase, C. J., Gould, Z. R., Amalbert-Birriel,
M. A., Chipkin, S. R., and Staudenmayer, J. (2021).
Walking cadence (steps/min) and intensity in 61-85-
year-old adults: the CADENCE-Adults study. The In-
ternational Journal of Behavioral Nutrition and Phys-
ical Activity, 18(1):129.
Spontaneous Cardiac-Locomotor Coupling in Healthy Individuals During Daily Activities
177
