
AI and IoT Enabled Sleep Stage Classification
Dimitrios Zografakis
1,2 a
, Panagiotis Tsakanikas
1,2 b
, Ioanna Roussaki
1,2 c
and Konstantina-Maria Giannakopoulou
1,2 d
1
Institute of Communication and Computer Systems, 10682 Athens, Greece
2
School of Electrical and Computer Engineering, National Technical University of Athens, 15773 Athens, Greece
Keywords:
Sleep Stages, IoT, Feature Engineering, Artificial Intelligence, Polysomnography, Machine Learning.
Abstract:
Sleep is a key aspect affecting health, cognitive functionality, and human psychology on all occasions. There-
fore, on the one hand, sleep greatly impacts the quality of life, while on the other hand poor health and/or
psychology often deteriorate the quality of sleep. Moving beyond the golden standard for sleep studies, i.e.
polysomnography, and building on the current state of the art in wearables, this paper aims to propose a deep
learning approach that focuses on sleep stage classification, introducing the timeseries related information
input to the classification. In this respect, smartwatch sensor measurements are used and a series of meth-
ods have been tested. The proposed approach constitutes a preliminary work on sleep stage classification
introducing a novel approach of feature engineering incorporating the time-related information concerning the
transition of the sleep stages via a Long Short-Term Memory (LSTM) encoding of the accelerometer data from
smartwaches. The obtained results are compared with the outcomes of existing related approaches on the same
open dataset as previously published. The respective evaluation exhibits promising findings and shortcomings
compared to previous approaches and polysomnography analysis correspondingly. In addition, the choice of
appropriate evaluation metrics has emerged, since traditional classification metrics such as accuracy, are not
appropriate to capture the real performance in terms of the transition of the stages sequence in the resulted
hypnograms.
1 INTRODUCTION
Sleep habits and sleep patterns are associated with
brain functionality and structure. Sleep is intrinsically
related to well-being, mental, and physical health as
highlighted in (Tahmasian et al., 2020). There is a vi-
cious circle in place where poor sleep can lead to in-
creased risk of poor health, and poor health can make
it harder to sleep or severely limit its quality. It is
well established that sleep disturbances/disorders are
often among the first signs of distress (Anderson and
Bradley, 2013), where common mental health prob-
lems such us anxiety and depression (Dinges et al.,
1997) can often underpin sleep problems (Oh et al.,
2019).
Currently, the golden standard in sleep monitor-
ing and analysis is polysomnography (PSG), the most
reliable and comprehensive method for diagnosing
a
https://orcid.org/0000-0001-6955-3242
b
https://orcid.org/0000-0002-9361-5922
c
https://orcid.org/0000-0001-7289-0653
d
https://orcid.org/0000-0002-0563-0912
sleep disorders that provides trustful insights on the
user-subject sleep analysis (Rundo and Downey III,
2019). PSG requires in-laboratory overnight multi-
channel and video recording of sleep under a trained
technician supervision. Thus, PSG is a time consum-
ing and labor intensive procedure, especially for the
meta-analysis of the recorded multisource signals as
well as in money. In addition, PSG is limited to sleep
data of a single night, is obstructive and in the vast
majority of the cases stressful for the people under-
going this procedure. Furthermore, it is well docu-
mented that apart from the inherent variability among
nights of sleep, the intrusive nature of the PSG data
acquisition affects the analysis outcome (Herbst et al.,
2010), usually in an unknown and unexplored man-
ner.
As an alternative to the gold standard the PSG
monitoring, wearables have ben proven to be able
to provide a feasible and promising approach (Kwon
et al., 2021) mainly due to their lower cost, reason-
able accuracy and ability to measure sleep in the wild
(without medical supervision) for long periods of time
Zografakis, D., Tsakanikas, P., Roussaki, I. and Giannakopoulou, K.
AI and IoT Enabled Sleep Stage Classification.
DOI: 10.5220/0011631300003414
In Proceedings of the 16th International Joint Conference on Biomedical Engineering Systems and Technologies (BIOSTEC 2023) - Volume 4: BIOSIGNALS, pages 155-161
ISBN: 978-989-758-631-6; ISSN: 2184-4305
Copyright
c
2023 by SCITEPRESS – Science and Technology Publications, Lda. Under CC license (CC BY-NC-ND 4.0)
155

(accumulation of big data), while limiting the incon-
veniency caused by the PSG setup. As a result, there
is a growing interest of researchers on the clinical
sleep domain concerning the potential of employing
Consumer Sleep Technologies (CST) (Kwon et al.,
2021). This is further strengthened by the fact that
the number of available devices claiming to track and
define sleep-related metrics (Khosla et al., 2018) is
growing fast. Nevertheless, there are limited valida-
tion data available regarding the evaluation of their
performance in terms of sleep stage classification ac-
curacy and conformity to the PSG studies, Moreover,
validation studies typically demonstrate sensitivity of
about 90%, but exhibit sensitivity that varies in the
range of 20% to 80% (De Zambotti et al., 2019;
de Zambotti et al., 2020; Goldstein, 2020). It is
thus obvious that further work is needed to investi-
gate the potential use, performance and limitations
of wearables in terms of their efficient and reliable
application in sleep research. The aim of this study
is to extend the current state of the art in wearable-
based sleep monitoring employing AI towards en-
hancing the achieved performance and accuracy of
sleep stages identification as well as other sleep met-
rics such as sleep phases duration, awakenings etc.
More specifically, this paper focuses mainly in feature
engineering on two of the the sensor measurements
acquired by smartwatches, namely heart rate and ac-
celerometer signals in tandem with novel classifica-
tion model development vs. currently state-of-the-art.
The rest of the paper is organized as follows: Sec-
tion II presents a brief background on related work.
Then, Section III describes the data used herein, and
Section IV the methodology for the developed work-
flow and assumptions made. Section V holds the re-
sults, accompanied by the relative discussion, while
Section VI concludes the work and sets pointers to
future work.
2 RELATED WORK
During the last 40 years, the use of wrist-worn actig-
raphy and/or watch-like devices sensitive to motion,
have been investigated for their capabilities in distin-
guishing between sleep from wake. The approaches
that have been developed, have reported performances
on the basis of two levels of analysis. The first is
the epoch level, i.e. the ability of a device to cor-
rectly classify each sleep epoch (typically 30 secs),
while the second accounts for the night level, i.e. the
ability of the device to summarize the entire night of
sleep and the corresponding quantifications of sleep
stages. Actigraphy as the first and most employed
data acquisition for detecting sleep, exhibits high sen-
sitivity, between 0.87 to 0.99, while the correspond-
ing specificity is pretty low, between 0.28 to 0.67,
as reported in (Van De Water et al., 2011). Sev-
eral approaches, such as Sadeh (Sadeh, 1989), Cole-
Kripke (Cole et al., 1992), and UCSD algorithm
(Jean-Louis et al., 2001) among others have been pro-
posed throughout the years, but their low specificity
drove the research of alternative unobstructive tech-
niques of PSG towards devices that are able to provide
additional signal like heart rate, oxygen saturation
among others. Currently, the consumer generation
of wearable devices claim to measure sleep are using
multisensory data acquisition, typically microelec-
tromechanical systems (MEMS) accelerometers and
photoplethysmography (PPG) (Fonseca et al., 2017;
Goldstone et al., 2018). On top of the aforemen-
tioned rapid sensor advancements, machine learning
techniques that employ the offered capabilities (com-
puting power, memory) to the analysis of novel input
data are well-suited for the prediction of sleep met-
rics. Thus, it is apparent that the algorithms devel-
oped for the existing actigraphy are most likely to be
outperformed, since multimodal signals convey more
information. One such study is (Walch et al., 2019),
where the authors have reported good classification
metrics using a variety of algorithms and input fea-
tures. The work presented here is a follow up to
this paper (Walch et al., 2019), introducing the in-
formation of time dependence among of sequential
30secs epochs of the signal. This time dependend
information serves as the input for the classification,
performed via Long Short Term Memory (LSTM)
(Hochreiter and Schmidhuber, 1997) feature extrac-
tion from accelerometer data fused with the aligned
heart rate signal.
3 SLEEP MONITORING
DATASET USED
Although the importance of a “good night’s sleep” is
unquestionable in everyday life, the available state of
the art still remains limited especially in terms of eval-
uation towards PSG recordings. Nevertheless, there
are a few notable efforts appear that aim to bridge this
gap, but the difficulty of introducing such big-scale,
datasets remain unresolved. This is further intensi-
fied considering the amount of data that is paired with
both actigraphy and polysomnography. To the best of
our knowledge only (Walch et al., 2019; Zhang et al.,
2018b; Chen et al., 2015) are open source and tar-
geted to the scientific community available through
(Goldberger et al., e 13) and (Redline et al., 2014).
BIOSIGNALS 2023 - 16th International Conference on Bio-inspired Systems and Signal Processing
156

3
30
Accelerometer
1
Heart
Rate
LSTM
512
256
64
8
+
Concat
Sleep Stage
Classifier
1
Predictions
σ
Median Filter
Figure 1: Architecture of the proposed sleep stage classifier leading to the classified hypnogram.
As presented in (Walch et al., 2019), Apple Watch
dataset is a study of 31 individuals that had been mon-
itored using Apple Watches. More specifically, the
heart rate, daily steps and motion had been collected
for each patient. The sampling intervals are not con-
sistent for every metric and therefore further process-
ing needed to take place, in order for the data to be
aligned and refer to the same time slots.
Each sample consists of the three Cartesian di-
mensions (x, y, z) with a sample rate of approximately
50 Hz, accompanied by heart rate monitoring. Even
though the heart rate sampling frequency is varying,
the sample intervals tend to be shorter than 10 sec-
onds. Since sleep stage labels are provided for a con-
stant 30 seconds interval (Walch et al., 2019), the em-
ployed methodology tackles the specific interval. It
should be highlighted that the 30 seconds window is
also the preferred interval of choice for the medical
personnel of the sleep clinics for their analysis. These
consistent timestamps are used to properly align both
the heart and the accelerometer data. Although, infor-
mation for patients health (chronic diseases, etc.), we
chose not to include this information since it would
increase the class imbalance between samples. After-
wards, sleep stages classification is independent from
the health status; only the overall hypnogram is re-
lated to the physical health of the person under study.
To this end, as far as the alignment concerns,
the authors of the aforementioned publication pro-
vide a processing utility that aligns the PSG times-
tamps of the data and extracts features that can be
directly fed into machine learning models (Walch
et al., 2019). The proposed approach in this paper
is largely inspired by the tools presented in (Walch
et al., 2019) and integrates alternative data processing
and knowledge extraction techniques. As mentioned
in (Walch et al., 2019), the MEMS metric (te Lindert
and Van Someren, 2013) is used to narrow down the
high sampling rate of the accelerometer.
The initial experiments conducted are based on
the aforementioned features and employ all models
presented in (Walch et al., 2019). Finally, it is high-
lighted that the LSTM model has been employed for
feature extraction from the accelerometer sensor of
the device, as discussed in detail in Section 5.2.
4 PROPOSED APPROACH
In this section, the developed and adopted methods
for data transformation, along with the classification
algorithms and pipeline, are discussed in detail. First,
the data and their respective annotations have under-
gone a remapping, in terms of classes, due to the
heavy imbalance among the class distribution (Ta-
ble 1). Specifically, some of the original classes are
largely outnumbered (−1, 0, 1, 4), and thus merging
them in a rational way on the basis of the respective
sleep stage resemblance has been performed. This
resulted in wider classes, transforming the problem
to be solved into a three classes Wake/NREM/REM
classification problem. After the new classes were
formed, samples from classes that exceeding a per-
centage threshold were eliminated, in an attempt to
further balance the distributions among the samples
in terms of the classification labels.
Table 1: Distribution amongst classes.
-1 0 1 2 3 4 5
Default 438 2358 1761 12585 3303 356 5690
merge(-1, 0) - 2796 1761 12585 3303 356 5690
3 classes - 2796 17649 6046 - - -
3 classes
•
- 2796 11715 6046 - - -
•: Adjusted distribution.
These numbers correspond to a 30secs window epoch, as in (Walch et al., 2019).
AI and IoT Enabled Sleep Stage Classification
157

Under this classification reformulation, the ac-
celerometer data time stamps were used as reference
for the alignment of both heart rate signal and PSG
sleep stages annotations. For the experiments per-
formed to simulate the results from (Walch et al.,
2019), the described metric is applied before any
alignment, thus reducing the “accelerometer feature”
into a sample for every 15 seconds period. Other ex-
periments did not make use of this metric, instead
median subsampling was utilized to narrow down the
sampling rate to 1 sample per second. The latter en-
ables a deeper level of functionality since it allows for
far more experimentation in the time domain.
The proposed methodology presented herein, con-
sists of investigating two different approaches in or-
der to determine the more efficient one in terms of en-
capsulating the most informative aspects of the sleep
classification problem complexity. Specifically, ac-
cording to the simplest concept, each sample epoch is
treated as having no dependencies to the others. This
approach serves as a performance baseline for future
developments reference. It is evident that its simplis-
tic approach to the labyrinthine of sleep classification
problem, does not take into account neither the “per-
sonalized profile” of individual patients nor the time
signature; i.e. the prior and post- information inter-
correlation of the sleep stages.
The second, more complex, method is built upon
the time inherent property of the accelerometer, where
a deep learning model is introduced to capture pat-
terns hidden in the time domain. This model consists
of an LSTM and 4 fully connected layers (Fig. 1). To
be more specific, first and foremost an LSTM model
of 3 layers followed by a hidden layer with a size
of 512 dimensions, is initiated. This part is respon-
sible for predicting the sleep stage having as input
the three accelerometer parameters (the three dimen-
sions). Once the data have been propagated through
the LSTM model, a series of fully connected layers
attempt to narrow down the overall number of dimen-
sions, effectively functioning as a dimensionality re-
duction algorithm. The final layer scales down the
information to 8 dimensions, which is then concate-
nated with the heart rate signal for that given inter-
val. This final vector is fed into a final fully connected
layer that is responsible for inferring the Sleep Stage.
In order to suppress any delta function type out-
come, a smoothing post processing step has been ap-
plied on the resulted hypnogram so as to filter any in-
consistent classification outcome. For this, a median
filter of kernel size of 3 was applied on the result-
ing prediction labels for the entire timeseries (hypno-
gram). Finally, for the evaluation of the proposed
approach against the reported performance in (Walch
et al., 2019), Logistic Regression (LR), Support Vec-
tor Machine (SVM) and a Fully Connected model
have been considered.
5 RESULTS
5.1 Concept I: Individual Samples
In the first evaluation concept as described earlier,
each sample is treated as independent of the others,
resulting in a pool of all the different samples. Each
time, one sample is propagated through the network.
As already stated, the accelerometer signal consists
of 50 samples at the 3-dimensional Cartesian space
(x, y, z) per second, while heart rate by 1 sample per
10 seconds. Also, the annotations were provided by
a sample rate of 30 seconds, an epoch. The two dif-
ferent data pre-processing approaches adopted herein
(please refer to the Methods Section) have been used.
The first, the aggregation approach, is denoted with
(•) in Table 2 and implements the corresponding ag-
gregation method as it has been described in (Walch
et al., 2019). This approach combines the accelerom-
eter data in a 15 seconds time window; i.e. 750 ac-
celerometer samples are encoded in one single metric.
The second approach, proposed herein, aggregates the
accelerometer data within a time window of 1 sec-
ond utilizing median down-sampling. The advantages
posed by the latter approach towards the former are
that is more easily understood, more informative and
it is less time-consuming during the training phase.
At this point, it should be mentioned that the con-
cept of using individual samples as input data to the
classification models, is not applicable to the pro-
posed classification workflow since the latter requires
input batches of time-series signal and not individual
samples.
The resulting outputs for the aforementioned LR,
SVM, and NN models (Table II), show that NN cou-
pled with the first aggregation approach is more ef-
ficient in terms of accuracy and precision, while LR
performs equally well. The classification metric val-
ues reported here in terms of Wake/NREM/REM clas-
sification of samples when cross-checked with the re-
lated confusion matrices (not shown due to space lim-
itations) reveal that the correct classifications mainly
refer to either the classification of the NREM class
(the dominant class, Table I) or Wake (Fig. 2b, where
Fig. 2a shows the ground truth hypnogram). Thus,
as it will be shown later, the resulting output of a
subject’s hypnogram disregards, showing the inabil-
ity of the models to capture and illustrate the hypno-
gram’s structure, the main objective of sleep analy-
BIOSIGNALS 2023 - 16th International Conference on Bio-inspired Systems and Signal Processing
158
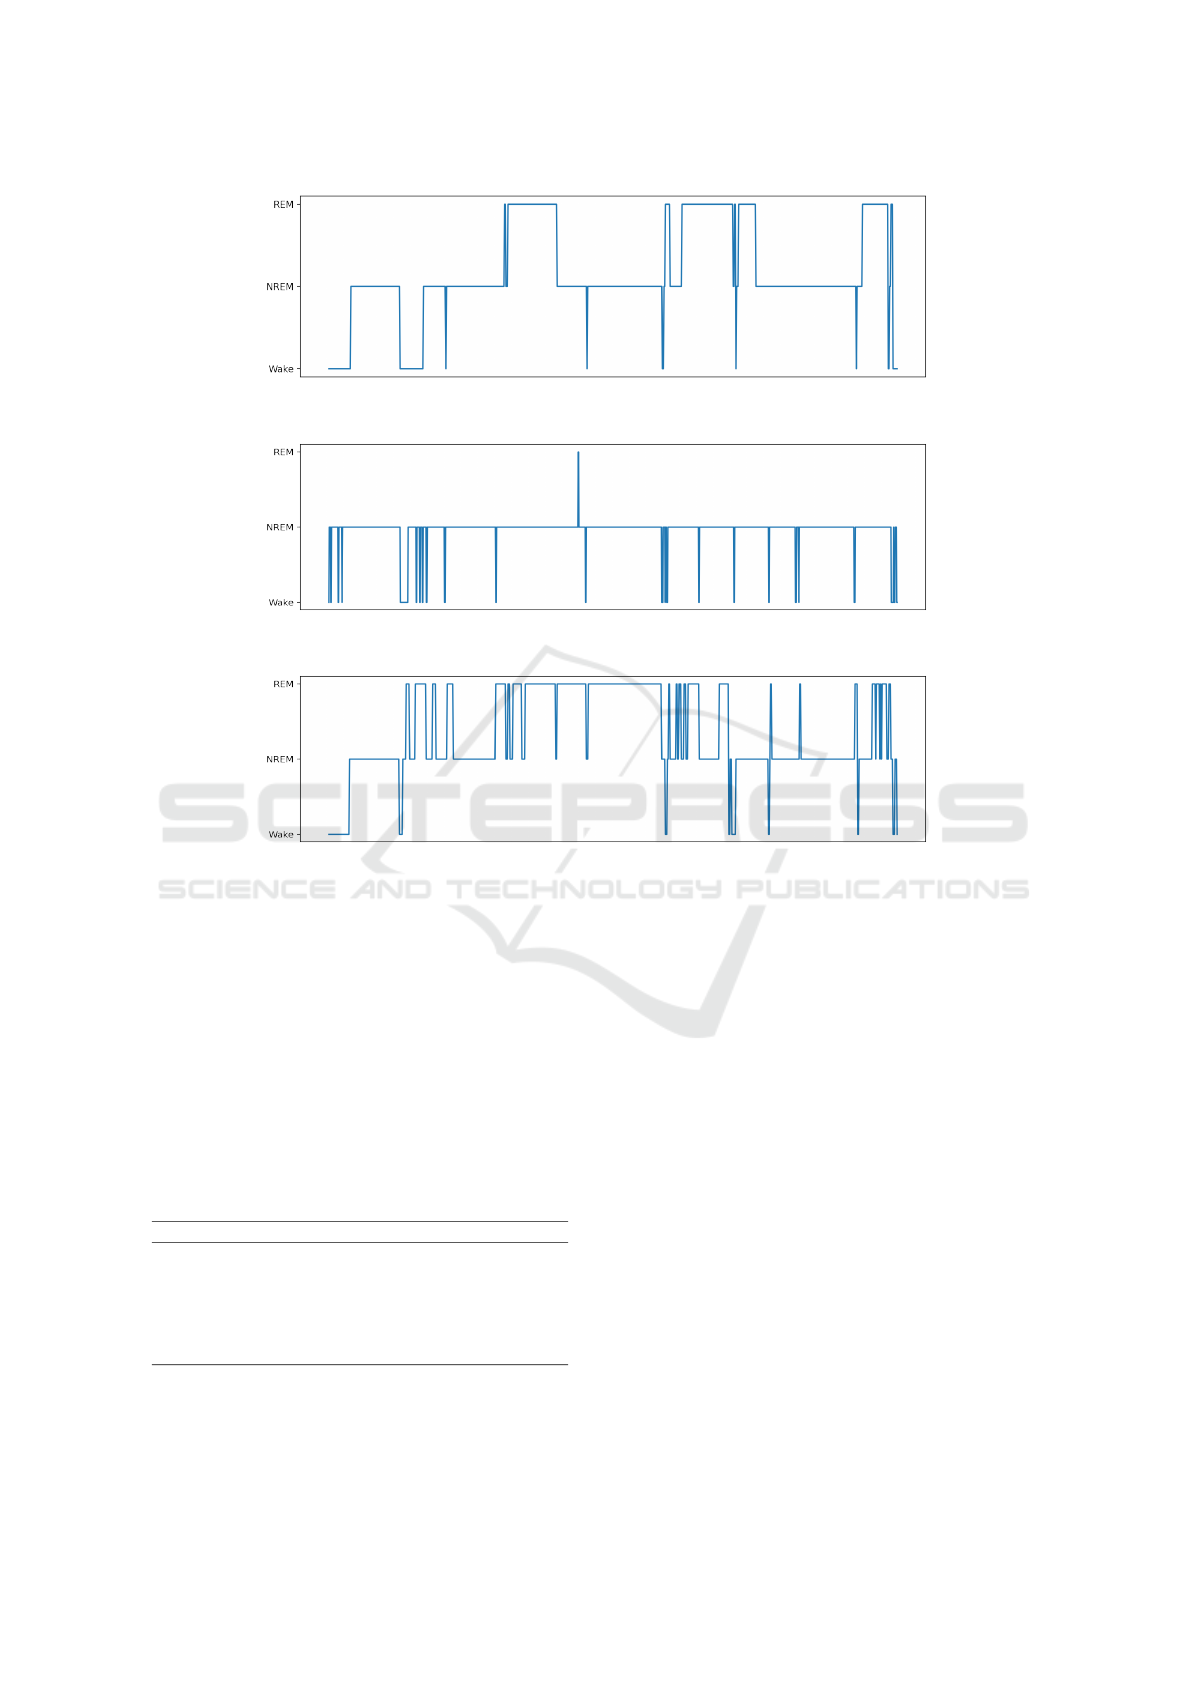
(a)
(b)
(c)
Figure 2: Patient’s Sleep Stages (a) Ground truth sleep stages along time (hypnogram), (b) reconstructed using the best
individual sampling model, (c) reconstructed using the proposed timeseries model.
sis. Rather, they reflect the distribution of the under-
lying sleep classes in the dataset, which is also the
real distribution of the stages during sleep. Finally, it
should be stated that concerning the results reported
in (Walch et al., 2019) and the relevance to those re-
ported here, fixed thresholds have been assigned for
the Wake (0.3) and REM (0.35) classes. Further, no
validation of the resulting hypnograms has been per-
formed.
Table 2: Concept 1 Classification Results.
Model Accuracy Precision
∗
Recall
∗
CK
LR
•
64.46 47.11 64.46 0.0875
SVM
•
29.07 35.84 29.07 0.0360
NN
•
66.62 48.81 66.62 0.1726
LR 63.26 40.03 63.26 0.0001
SVM 16.97 57.90 16.97 0.0584
NN 49.02 52.79 49.02 -0.093
∗
Weighted, •: (x, y, z) is aggregated into a single metric.
5.2 Concept II: Timeseries
The second concept considered herein builds on the
previous (Section 5.1) extended by the inclusion of
the time domain information into learning. Thus, the
number of samples being fed to the network is in-
creased in tandem with the introduction of the pro-
posed time-specific deep learning model, LSTM (Fig.
1). To this end 2 samples, each accounting for 15 sec-
onds in length aggregated samples (• in Table 3) are
fed into the classification modules at each propaga-
tion, representing a 30 seconds data frame. Appar-
ently, in the case of 1-second sampling, 30 samples
are fed simultaneously. The corresponding results for
all the considered classification models herein are pre-
sented in Table 3. As can be inferred by the results, it
is not obvious that the proposed scheme poses any ad-
vantage over the other classification model although
it presents a similar performance. In a second, more
holistic comparison, the hypnogram output of the pro-
posed approach (Fig. 2), compared to the ground
AI and IoT Enabled Sleep Stage Classification
159

truth (PSG) and the best performing model (accord-
ing to the reported metrics), the advantages are now
revealed. The sleep structure, i.e. the ordered se-
quence of the sleep stages along time, is much better
captured and reflected by the proposed methodology,
something that is also supported by the related confu-
sion matrices (not shown due to length restrictions).
This finding is very crucial in sleep assessment
studies since sleep analysis (sleep quality and sleep
disorder manifestation) is made upon the investiga-
tion of sleep stages’ chronical order and not solely
based on the correct classification of stages regardless
of the time of their incidence. Sleep stages onset and
offset, duration and the time sleep stages sequence are
of crucial importance. The proposed workflow is thus
performing better in terms of outlining and revealing
the real hypnogram structure than other models (with
the same concept of timeseries data input adopted).
Apparently, incorporating the underlying time infor-
mation enables more efficient capturing of the “hid-
den” pattern, i.e. the stages’ sequence. One way to
assess the concurrence and agreement of the predicted
hypnogram to the ground truth is using the Cohen’s
kappa (CK) (McHugh, 2012). CK is considered a
robust measure agreement metric that also takes into
account the possibility of the agreement occurring by
chance.
From Table 3 it is more than obvious that meth-
ods (LR, SVM and NNs) exhibiting higher accuracy
have near to zero CK values, while the proposed ap-
proach exhibits a value of 0.21, leading to the conclu-
sion that it provides more valuable information and
increased reliability than the other models, in terms
of sleep metrics that matter the most.
Table 3: Concept 2 Classification Results.
Model Accuracy Precision
∗
Recall
∗
CK
LR
•
64.39 46.65 64.39 0.1094
SVM
•
65.37 47.35 65.37 0.1490
NN
•
64.95 47.05 64.95 0.1180
LR 63.38 52.94 63.38 0.0257
SVM 63.26 40.01 63.26 0.0
NN 63.02 45.14 63.02 0.0158
DeepSleepLSTM 57.54 62.29 57.54 0.2127
∗
Weighted, •: (x, y, z) is aggregated into a single metric.
6 CONCLUSION & FUTURE
PLANS
Herein, a preliminary work on sleep stage classifica-
tion is presented, introducing a novel approach of fea-
ture engineering to incorporate time related informa-
tion of stages’ transition during sleep via LSTM en-
coding of accelerometer data. The results support the
advantages of the proposed methodology over exist-
ing approaches. Thus, although the performance met-
rics of the presented model seem equivalent to oth-
ers, the prediction of sleep stages’ transition has been
shown to be more closely related to the ground truth,
i.e.PSG-based annotations. There are several factors
that limit the performance mainly addressed to: the
data size, their high imbalance degree and the inher-
ent lower sensitivity of wearable sensors in compari-
son to PSG recording and monitoring. Another issue
that has been emerged is the appropriate evaluation
metrics that should be considered, since it is appar-
ent from this study, that due to the nature of the data,
common metrics are inappropriate. It is crucial to
understand and employ adequate, and not misleading
metrics, exhibiting the agreement of the output struc-
ture and stage transition sequence in the hypnograms
to the golden standards, i.e. the sleep clinic experts’
annotations based on PSG recordings.
Towards the advancement of the presented perfor-
mance, the future undergoing plans involve the inclu-
sion to the research, additional signals like breathing
rate, SpO2 levels and heart rate variability (HRV),
that has been recently reported as highly informative
for sleep analysis and towards reliable wearable based
sleep assessment in (Lujan et al., 2021). Those signals
are available by the current wearable device technol-
ogy. So, the first development of the current work
involves the incorporation of as many of this informa-
tion to enhance the decision making process. In addi-
tion, much larger datasets are going to be employed,
such as the MESA dataset (Zhang et al., 2018a). Fur-
thermore, experimentation with the models size, ac-
celerometer feature extraction and the modification
towards encompassing state of the art architectures
(i.e. Transformers) is another under investigation as-
pect of the ongoing research.
REFERENCES
Anderson, K. N. and Bradley, A. J. (2013). Sleep distur-
bance in mental health problems and neurodegenera-
tive disease. Nature and science of sleep, 5:61.
Chen, X., Wang, R., Zee, P., Lutsey, P. L., Javaheri, S.,
Alc
´
antara, C., Jackson, C. L., Williams, M. A., and
Redline, S. (2015). Racial/Ethnic Differences in Sleep
Disturbances: The Multi-Ethnic Study of Atheroscle-
rosis (MESA). Sleep, 38(6):877–888.
Cole, R. J., Kripke, D. F., Gruen, W., Mullaney, D. J., and
Gillin, J. C. (1992). Automatic sleep/wake identifica-
tion from wrist activity. Sleep, 15(5):461–469.
De Zambotti, M., Cellini, N., Goldstone, A., Colrain, I. M.,
and Baker, F. C. (2019). Wearable sleep technology in
clinical and research settings. Medicine and science
in sports and exercise, 51(7):1538.
BIOSIGNALS 2023 - 16th International Conference on Bio-inspired Systems and Signal Processing
160

de Zambotti, M., Cellini, N., Menghini, L., Sarlo, M.,
and Baker, F. C. (2020). Sensors capabilities, perfor-
mance, and use of consumer sleep technology. Sleep
medicine clinics, 15(1):1–30.
Dinges, D. F., Pack, F., Williams, K., Gillen, K. A., Pow-
ell, J. W., Ott, G. E., Aptowicz, C., and Pack, A. I.
(1997). Cumulative sleepiness, mood disturbance, and
psychomotor vigilance performance decrements dur-
ing a week of sleep restricted to 4–5 hours per night.
Sleep, 20(4):267–277.
Fonseca, P., Weysen, T., Goelema, M. S., Møst, E. I.,
Radha, M., Lunsingh Scheurleer, C., van den Heuvel,
L., and Aarts, R. M. (2017). Validation of
photoplethysmography-based sleep staging compared
with polysomnography in healthy middle-aged adults.
Sleep, 40(7).
Goldberger, A. L., Amaral, L. A. N., Glass, L., Hausdorff,
J. M., Ivanov, P. C., Mark, R. G., Mietus, J. E.,
Moody, G. B., Peng, C.-K., and Stanley, H. E.
(2000 (June 13)). PhysioBank, PhysioToolkit, and
PhysioNet: Components of a new research resource
for complex physiologic signals. Circulation,
101(23):e215–e220. Circulation Electronic Pages:
http://circ.ahajournals.org/content/101/23/e215.full
PMID:1085218; doi: 10.1161/01.CIR.101.23.e215.
Goldstein, C. (2020). Current and future roles of consumer
sleep technologies in sleep medicine. Sleep Medicine
Clinics, 15(3):391–408.
Goldstone, A., Baker, F. C., and de Zambotti, M. (2018).
Actigraphy in the digital health revolution: still
asleep? Sleep, 41(9):zsy120.
Herbst, E., Metzler, T. J., Lenoci, M., McCaslin, S. E., In-
slicht, S., Marmar, C. R., and Neylan, T. C. (2010).
Adaptation effects to sleep studies in participants
with and without chronic posttraumatic stress disor-
der. Psychophysiology, 47(6):1127–1133.
Hochreiter, S. and Schmidhuber, J. (1997). Long short-term
memory. Neural computation, 9(8):1735–1780.
Jean-Louis, G., Kripke, D. F., Mason, W. J., Elliott, J. A.,
and Youngstedt, S. D. (2001). Sleep estimation
from wrist movement quantified by different acti-
graphic modalities. Journal of neuroscience methods,
105(2):185–191.
Khosla, S., Deak, M. C., Gault, D., Goldstein, C. A.,
Hwang, D., Kwon, Y., O’Hearn, D., Schutte-Rodin,
S., Yurcheshen, M., Rosen, I. M., et al. (2018). Con-
sumer sleep technology: an american academy of
sleep medicine position statement. Journal of clini-
cal sleep medicine, 14(5):877–880.
Kwon, S., Kim, H., and Yeo, W.-H. (2021). Recent ad-
vances in wearable sensors and portable electronics
for sleep monitoring. Iscience, 24(5):102461.
Lujan, M. R., Perez-Pozuelo, I., and Grandner, M. A.
(2021). Past, present, and future of multisensory
wearable technology to monitor sleep and circadian
rhythms. Frontiers in Digital Health, page 104.
McHugh, M. L. (2012). Interrater reliability: the kappa
statistic. Biochemia medica, 22(3):276–282.
Oh, C.-M., Kim, H. Y., Na, H. K., Cho, K. H., and Chu,
M. K. (2019). The effect of anxiety and depression on
sleep quality of individuals with high risk for insom-
nia: a population-based study. Frontiers in neurology,
page 849.
Redline, S., Sotres-Alvarez, D., Loredo, J., Hall, M., Pa-
tel, S. R., Ramos, A., Shah, N., Ries, A., Arens, R.,
Barnhart, J., Youngblood, M., Zee, P., and Daviglus,
M. L. (2014). Sleep-disordered breathing in His-
panic/Latino individuals of diverse backgrounds. The
Hispanic Community Health Study/Study of Latinos.
Am J Respir Crit Care Med, 189(3):335–344.
Rundo, J. V. and Downey III, R. (2019). Polysomnography.
Handbook of clinical neurology, 160:381–392.
Sadeh, A. (1989). Actigraphically based automatic bedtime
sleep-wake scoring: validity and clinical application.
J Ambulatory Monitoring, 2:209–216.
Tahmasian, M., Samea, F., Khazaie, H., Zarei, M., Khara-
bian Masouleh, S., Hoffstaedter, F., Camilleri, J.,
Kochunov, P., Yeo, B., Eickhoff, S. B., et al. (2020).
The interrelation of sleep and mental and physi-
cal health is anchored in grey-matter neuroanatomy
and under genetic control. Communications biology,
3(1):1–13.
te Lindert, B. H. and Van Someren, E. J. (2013).
Sleep estimates using microelectromechanical sys-
tems (MEMS). Sleep, 36(5):781–789.
Van De Water, A. T., Holmes, A., and Hurley, D. A. (2011).
Objective measurements of sleep for non-laboratory
settings as alternatives to polysomnography–a system-
atic review. Journal of sleep research, 20(1pt2):183–
200.
Walch, O., Huang, Y., Forger, D., and Goldstein, C. (2019).
Sleep stage prediction with raw acceleration and pho-
toplethysmography heart rate data derived from a con-
sumer wearable device. Sleep, 42(12). zsz180.
Zhang, G.-Q., Cui, L., Mueller, R., Tao, S., Kim, M.,
Rueschman, M., Mariani, S., Mobley, D., and Redline,
S. (2018a). The national sleep research resource: to-
wards a sleep data commons. Journal of the American
Medical Informatics Association, 25(10):1351–1358.
Zhang, G. Q., Cui, L., Mueller, R., Tao, S., Kim, M.,
Rueschman, M., Mariani, S., Mobley, D., and Red-
line, S. (2018b). The National Sleep Research Re-
source: towards a sleep data commons. J Am Med
Inform Assoc, 25(10):1351–1358.
AI and IoT Enabled Sleep Stage Classification
161
