
Predicting Comorbidities in Diabetic Patients and Visualizing Data
for Improved Healthcare
Giridhar Krishnan
a
and Waqar Haque
b
Department of Computer Science, University of Northern British Columbia, Prince George, Canada
Keywords: Predictive Modeling, Health Informatics, Diabetes, Comorbidities, Health Care Systems.
Abstract: Diabetes is one of the most common chronic diseases in the world with patients being more susceptible to
develop additional comorbidities over time. In this research, we have used clinical data collected over six
years to perform predictive and visual analytics which enables healthcare professionals gain valuable insight
into early identification of the risk of developing comorbidities thereby resulting in effective diabetes
management and reduced burden on healthcare system. We first present predictive models developed to
forecast the likelihood of one of the three common comorbidities for diabetic patients – Benign Hypertension,
Congestive Heart Failure, and Acute Renal Failure. The models use advanced data mining algorithms such as
Logistic Regression, Neural Network, CHAID, Bayesian Network, Random Forest and Ensemble. Results
from these models are incorporated into an interactive assessment tool that can take user input and predict the
likelihood of developing one of these comorbidities. In addition, an interactive diabetes dashboard presents
aggregated data using visually appealing charts, graphs, and tables. The dashboard also provides drilldown
capabilities to allow navigation at finer granularities of various metrics.
1 INTRODUCTION
Diabetes is a chronic disease in which the body
cannot either produce or utilize insulin. Type 1
diabetes (T1D) occurs when body does not produce
enough insulin; Type 2 diabetes (T2D) starts with
insulin resistance and can progress to a lack of
insulin; and gestational diabetes occurs in pregnant
women with no history of diabetes. According to the
Public Health Agency of Canada (PHAC), 5 to 10%
of diabetes patients have T1D and the remainder have
T2D; four percent of all pregnant women are affected
by gestational diabetes. Diabetes puts a great burden
on patients as well as the healthcare system as it can
also lead to comorbidities including stroke, heart
attack, kidney failure, blindness, and amputations. In
Canada, 3.9 million people have been diagnosed with
diabetes and more than one million have the disease
but are yet to be diagnosed. Statistics for prediabetes
are also a great concern with an alarming number of
5.7 million Canadians. Cumulatively, this number is
expected to reach 33% of the population by 2025
(Diabetes Canada).
a
https://orcid.org/0000-0003-0061-307X
b
https://orcid.org/0000-0002-6921-8097
Early detection of prediabetes and early diagnosis
of T2D can be accomplished using predictive models
which analyze patterns and correlations in historical
data. Data mining is vital in discovering hidden
patterns which could potentially improve quality of
life of patients diagnosed with health conditions. Data
mining algorithms are used to identify correlations
between different variables and build predictive
models which provide insightful information for the
purpose of clinical administration, diagnosis as well
as management of diabetes. When interfaced with
data warehousing, this can enable data-driven
decision making by facilitating complex analyses and
visualization through multi-dimensional Online
Analytical Processing (OLAP) cubes.
The work presented in this paper has two major
contributions. First, predictive models were
developed to find the likelihood of one or more of
three representative diabetes comorbidities - Benign
Hypertension, Congestive Heart Failure, and Acute
Renal Failure, using data mining algorithms. The
results from these models could be used by healthcare
professionals to identify patients who are at higher
52
Krishnan, G. and Haque, W.
Predicting Comorbidities in Diabetic Patients and Visualizing Data for Improved Healthcare.
DOI: 10.5220/0011628800003414
In Proceedings of the 16th International Joint Conference on Biomedical Engineering Systems and Technologies (BIOSTEC 2023) - Volume 5: HEALTHINF, pages 52-63
ISBN: 978-989-758-631-6; ISSN: 2184-4305
Copyright
c
2023 by SCITEPRESS – Science and Technology Publications, Lda. Under CC license (CC BY-NC-ND 4.0)

risk of developing predicted comorbidities and ensure
effective management of the disease or development
of other complications. The results are incorporated
into an interactive web form which predicts the
probability of one of the three comorbidities based on
the inputs provided. The second contribution is the
design and development of an interactive dashboard
for a better and deeper understanding of the metrics
associated with the disease. The dashboard provides
aggregated statistics at facility and community levels
with drill-down and drill-through reporting at finer
granularities for various demographics, health
regions and diagnoses. Overall, the extracted
information can be useful to identify the gaps in
healthcare and enhance related services by making
informed decisions in a timely manner.
2 RELATED WORK
The cost and toll of diabetes on global healthcare
systems has prompted extensive research especially
with focus on early diagnosis and detection of the
disease. The literature review presented in this section
is grouped in three categories. Firstly, representative
studies on diabetes and data mining are presented.
This is followed by a review of the research-based
tools such as diabetes calculators. Finally, the use of
data visualization for enhanced and cost-effective
healthcare is explored.
Automated detection of diabetes mellitus using
artificial neural networks (ANNs) without patients
undergoing clinical tests was proposed (Kumari &
Singh, 2013). The neural network was built using the
backpropagation algorithm and 18 out of 20 datasets
tested produced results with an overall accuracy of
92.8%. The variables used to build the model
included age, gender, weight, height, weight loss,
thirst, hunger, appetite, nausea, fatigue, vomiting,
bladder and skin infections. Considering that the data
was collected using surveys and was self-reported,
the authenticity of the diagnosis becomes
questionable. Another study was conducted to
compare three data mining models (ANN, decision
tree and logistic regression) to predict diabetes or
prediabetes by various risk factors (Meng, Huang,
Rao, Zhang, & Liu, 2013). A questionnaire to obtain
information on demographics, family diabetes
history, anthropometric measurements and lifestyle
risk factors was given to 1457 participants, 735 of
whom had diabetes. The input variables used in this
study included age, gender, family history of
diabetes, marital status, education level, work stress,
duration of sleep, physical activity, preference for
salty food, eating fish, drinking coffee, and body mass
index. The output variable (a flag) indicated whether
the person had diabetes/prediabetes or not. It was
observed that the decision tree yielded the highest
classification accuracy, followed by logistic
regression and ANN. A limitation of this study was
that the sample population chosen was only from two
small communities in Guangzhou, China and was not
representative of any larger population. In a recent
study, data was collected from over 230,000
participants over a ten-year period to develop a T2D
risk prediction model using machine learning
algorithms (Zhang, et al., 2020). This research
excluded all diabetic participants as well as any
participants taking medication for diabetes. The
collected medical, behavioral, demographic and
incidence data was used to predict T2D in participants
at 3, 5, 7 and 10 years using a longitudinal study.
Three machine learning algorithms (random forest,
multilayer feedforward artificial neural network, and
a gradient boosting machine approach) were
compared with conventional logistic regression
model. The AUC (Area under Curve) in machine
learning models was higher than the conventional
regression model implying better prediction
capabilities of the former. The highest accuracy was
recorded by gradient boosting algorithm with an AUC
of 79% in 3-year prediction and 75% in 10-year
prediction. It was also noted that diabetes incidence
was higher among men than women over the ten-year
period. Limitations of this research were that it used
self-reported data and the exclusion of participants
was done by use of diabetes related medication
instead of a clinical diagnosis.
Diabetic patients have higher risk of being
diagnosed with multiple comorbidities which, in turn,
increases the complexity of treatment and care.
Mortality of diabetic patients in ICU was predicted
using three metrics: Charlson Comorbidity Index
(CCI), Elixhauser Comorbidity Index and Diabetes
Complications Severity Index (DCSI) (Anand, et al.,
2018). The results showed AUC values to be 0.694,
0.682 and 0.656 for DCSI, Elixhauser and CCI,
respectively. The AUC improved to 0.785 when all
three metrics were combined using logistic
regression. A limitation of this research was that it
used random sampling of 70/30 for analysis which
resulted in an imbalance of less than 10% of positive
cases. Also, it did not consider patients directly
admitted for diabetes related care because it was
complicated to identify using recorded diagnostic
codes. The authors recommend analyzing other
variables, such as Length of Stay (LOS), and use of
Predicting Comorbidities in Diabetic Patients and Visualizing Data for Improved Healthcare
53

other machine learning algorithms such as random
forest and ANN for better predictions.
A tool to predict T2D was developed to identify
individuals at risk without undergoing laboratory
tests (Lindström & Tuomilehto, 2003). The risk
factors taken into account included age, BMI, waist
circumference, history of antihypertensive drug
treatment, high blood glucose, physical activity, and
daily consumption of fruits, berries, or vegetables.
For this study, a random population sample between
ages 35-64 was selected and followed for 10 years.
Each category was assigned a score using
multivariate logistic regression model coefficients.
The cumulative sum of all scores represented the
Diabetes Risk Score. The research identified 182
cases of diabetes incidence in 4,435 subjects. The
limitations of this study include exclusion of family
history from the risk factors, inclusion of individuals
with high glucose levels and use of surveys and
national population register for the data.
A simple tool for detecting undiagnosed diabetes
and prediabetes was proposed using survey data
(Heikes, Eddy, Arondekar, & Schlessinger, 2008).
The models were built using two methods –
classification tree analysis and logistic regression.
The risk factors used include age, height, waist
circumference, gestational diabetes, race/ethnicity,
hypertension, family history, and exercise. ROC area
under curve for undiagnosed diabetes was 0.85, and
for prediabetes was 0.75. ROC is used to evaluate the
performance of models where the true positive rate is
represented by sensitivity and false positive is
represented by specificity. This research eliminated
the variables for BMI in favour of height and weight,
and the cholesterol variables were eliminated due to
missing fields and low predictor value. Another
important variable eliminated was diabetes in any
blood relative.
Data visualization can lead to enhanced patient care
and optimized diabetes management. Research has
shown that management of diabetes improves when
patients are provided with information and
knowledge about their health condition. In a study,
results were integrated with a user-friendly tool to
predict the risk of hypertension, cardiovascular (Lau,
Campbell, Tang, J S Thompson, & Elliott, 2014).
Patients were assessed by a diabetologist and given
access to a web portal which had information
regarding diabetes, their personal health status as well
as the ability to contact the diabetologist. The primary
goal of this research was to monitor the blood glucose
levels (A1C) and to observe differences between
users who had access to the web portal and those who
did not. The study found that the web portal users had
lower levels of A1C compared to the non-users. This
study did not explore the demographic factors that
would influence the usage of the web portal and did
not distinguish between patients with T1D and T2D.
A clinical decision support system (CDSS) was built
for a project designed to explore predictive models
and decision support for T2D care and management
(Dagliati, et al., 2018). The dashboard consisted of
three sections consolidating metabolic control,
frequent temporal patterns and drug purchase
patterns. An outcome assessment and research
support system was designed for clinicians. It was
observed that T2D patients who had access to CDSS
recorded shorter durations with their clinical visits
and screening for complications increased in the visits
indicating optimized patient care. The dashboard was
evaluated for patient management but not for any
clinical outcomes.
In summary, while there has been focus on early
diagnosis and management of the disease, there is an
obvious research gap when identifying risk factors
leading to diabetes comorbidities. A common
limitation prevalent in existing work is the use of less
reliable survey data and interviews which could lead
to erroneous predictive models. In contrast, clinical
data is more authentic as patient diagnosis has been
confirmed by qualified physicians. However,
obtaining clinical data for research can be
challenging as it is seldom available in the public
domain due to privacy concerns.
3 METHODOLOGY
The dataset used in our research represents six years
of clinical data for diabetic patients diagnosed with
either T1D or T2D across a broad range of
communities and facilities. This research has three
interrelated components. First, a model for predicting
diabetes comorbidities is proposed. The model
includes the lesser explored variables such as length
of stay and access to family physicians. Second, the
results were integrated with a user-friendly tool to
predict the risk of hypertension, cardiovascular
disease, and renal failure in a specific diabetic patient.
Finally, an interactive dashboard has been developed
to provide insights about diabetes using visual
analytics which uncovers hidden data patterns and
assists in effective decision making and improved
healthcare outcomes.
HEALTHINF 2023 - 16th International Conference on Health Informatics
54
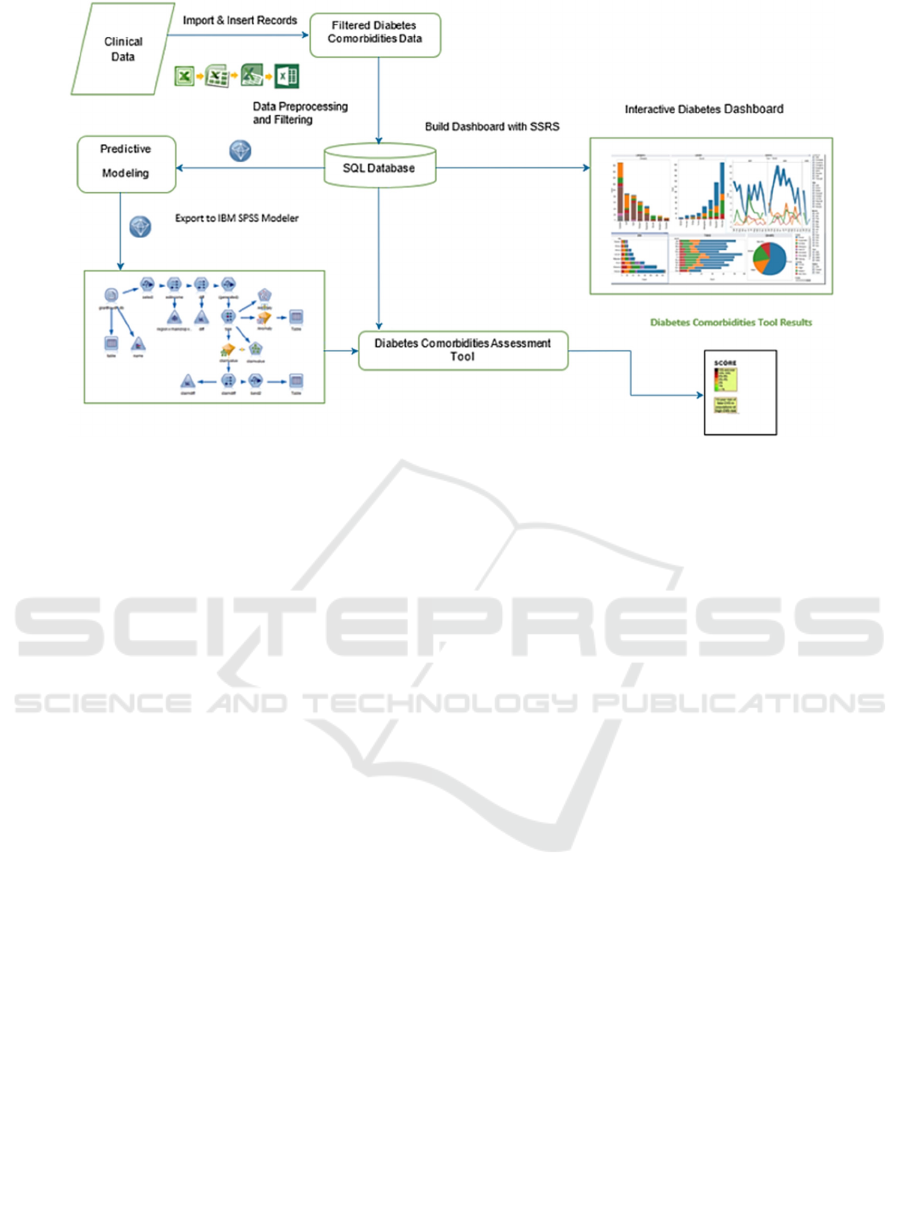
Figure 1: Components for Predictive Modeling and Data Visualization.
3.1 Proposed Model
The key components of the model are shown in
Figure 1. After importing the .csv data file into SQL
Server (Microsoft) database, the entire process can be
grouped into three distinct phases, namely, predictive
modeling, assessment tool and dashboard design. In
the first phase, data was cleansed and prepared for the
model before creating testing and training datasets for
the three comorbidities. Relationships were
established within the database to associate
demographic and diagnostic data for visualization.
Three predictor variables were chosen from the top
twenty diagnostic codes. A separate model was built
for each of these variables. The remaining diagnostic
codes together with demographic data then became
the input variables. Various data mining algorithms
such as logistic regression, decision tree and artificial
neural network together with their ensembles were
compared for relevance and accuracy. Secondly, the
results from predictive models were integrated with a
web-based, user-friendly assessment tool to predict
likelihood of comorbidities for individual patients.
The front end for the assessment tool consists of a
web form wherein the user enters information such as
age and diagnosis code. The tool then displays the
risk score for diabetes comorbidities based on the
selected backend predictive model. Finally, a visual
analytics dashboard was built to analyze/compare
various metrics together with drilldown capabilities
which allowed filtering by specific demographics and
at finer granularity.
3.1.1 Data Source, Pre-Processing &
Variable Selection
The clinical dataset used for this research represents
patients who had accessed one of the eighteen
facilities in three Health Service Delivery Areas
(hereinafter referred to as Areas A, B, and C). The
dataset consists of 141,900 records representing
34,824 unique admissions for the period 2012-2018;
there were no cases of gestational diabetes. The
dataset was anonymized to protect the privacy of
patients and International Classification of Disease
(ICD) codes have been used for the diseases.
To improve data quality, negative factors such as
missing values and inconsistencies were addressed
during pre-processing. For instance, pivot queries
were used to obtain unique admissions including
diagnosis codes for comorbidities. Three codes were
finally selected as predictor or target variables: 1)
I500 (Congestive Heart Failure), 2) I100 (Benign
Hypertension), and 3) N179 (Acute Renal Failure).
For each of these diagnosis codes, training and testing
datasets were initially created with a ratio of 70:30.
The final dataset combined patient’s multiple
admissions into a single record and retained all their
diagnosis codes to avoid data inconsistency. For
relevance, it was ensured that the data consisted of
only diabetic patients. Irrelevant and redundant codes
were eliminated using the Feature Selection (FS)
algorithm. The process was repeated for all three
target variables.
The ranking produced by the Feature Selection
algorithm for the three target variables is shown in
Predicting Comorbidities in Diabetic Patients and Visualizing Data for Improved Healthcare
55
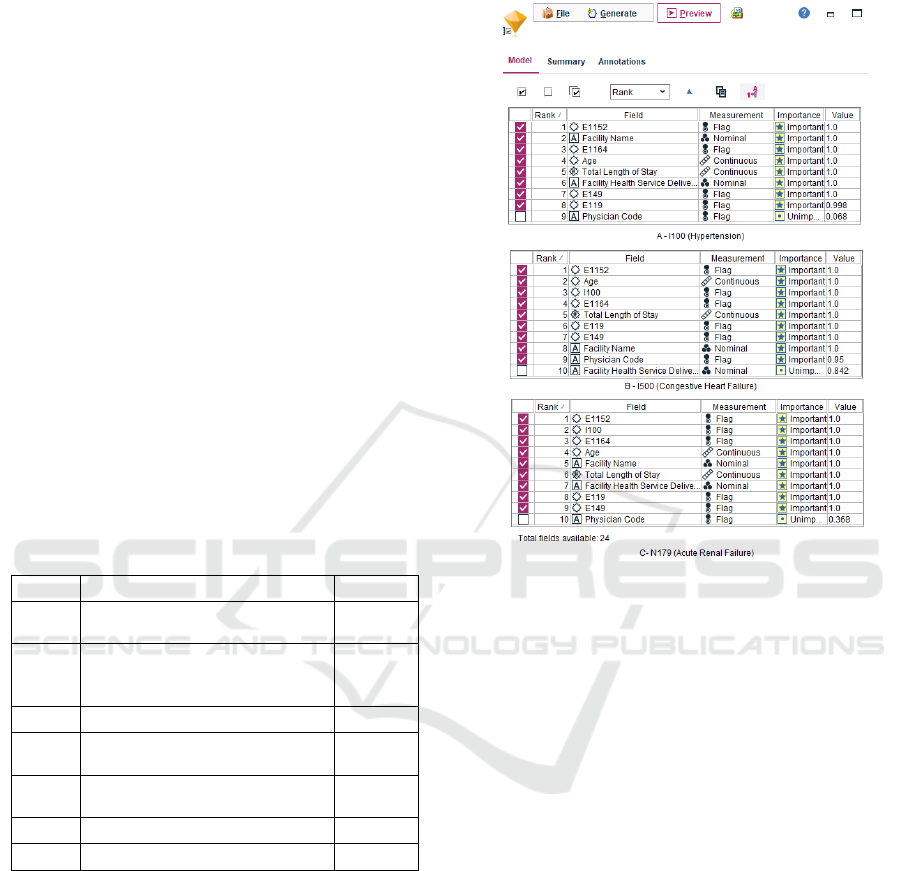
Figure 2. It can be observed that the diagnosis codes
E1152, E1164, E119 and E149 were identified among
the top ten variables consistently for all three target
variables. This can be attributed to the large number
of patients diagnosed with these codes (Table 1).
Interestingly, I100 is also included as one of the top
three important variables for predicting I500 as well
as N179. Codes E119 and E149 consistently rank
below the top five variables. These two codes specify
diabetes patients without mention of complications
which indicates that the probability of these patients
to be diagnosed with other comorbidities is relatively
low. It was also observed that 75% of E119 patients
and 78% of E149 patients did not have either of I100,
I500 and N179. Similarly, 49% of E1152 and 39% of
E1164 patients were diagnosed with at least one or
more of the three comorbidities (target variables)
resulting in both codes to be ranked in the top five.
Only two percent of the patients included all three
target variables in their diagnosis. This is the reason
N179 or I500 does not rank as important variables
while predicting the others. Finally, the average age
of patients in the dataset was 63 years and the average
Total Length of Stay was seven days. Both of these
variables were ranked as important.
Table 1: Top Seven Diagnostic Codes.
Code Diagnosis Description Patients
E119 Type 2 diabetes mellitus
without complications
7,956
E1152 Type 2 diabetes mellitus with
certain circulatory
complications
3,763
I100 Benign hypertension 2,656
E149 Unspecified diabetes mellitus
without complication
2,105
E1164 Type 2 diabetes mellitus with
p
oor control, so describe
d
1,674
I500 Congestive heart failure 1,385
N179 Acute renal failure 1,303
3.1.2 Predictive Modeling
The data mining algorithms used for this study
include Artificial Neural Network (ANN), Logistic
Regression, CHAID, Random Forest, Bayesian
Network and Ensemble. These algorithms have
unique characteristics and are available in IBM SPSS
Modeler v18.1 (IBM, 2020) which also contains other
desirable features such as advanced statistical
analysis, ease of use, support for multiple data
sources, feature selection algorithm, scalability,
automation, visual interface and multiple deployment
methods. An integration package was built to connect
the Modeler with MS SQL server (Microsoft)
backend database.
Figure 2: Feature Selection Results (I100, I500, N179).
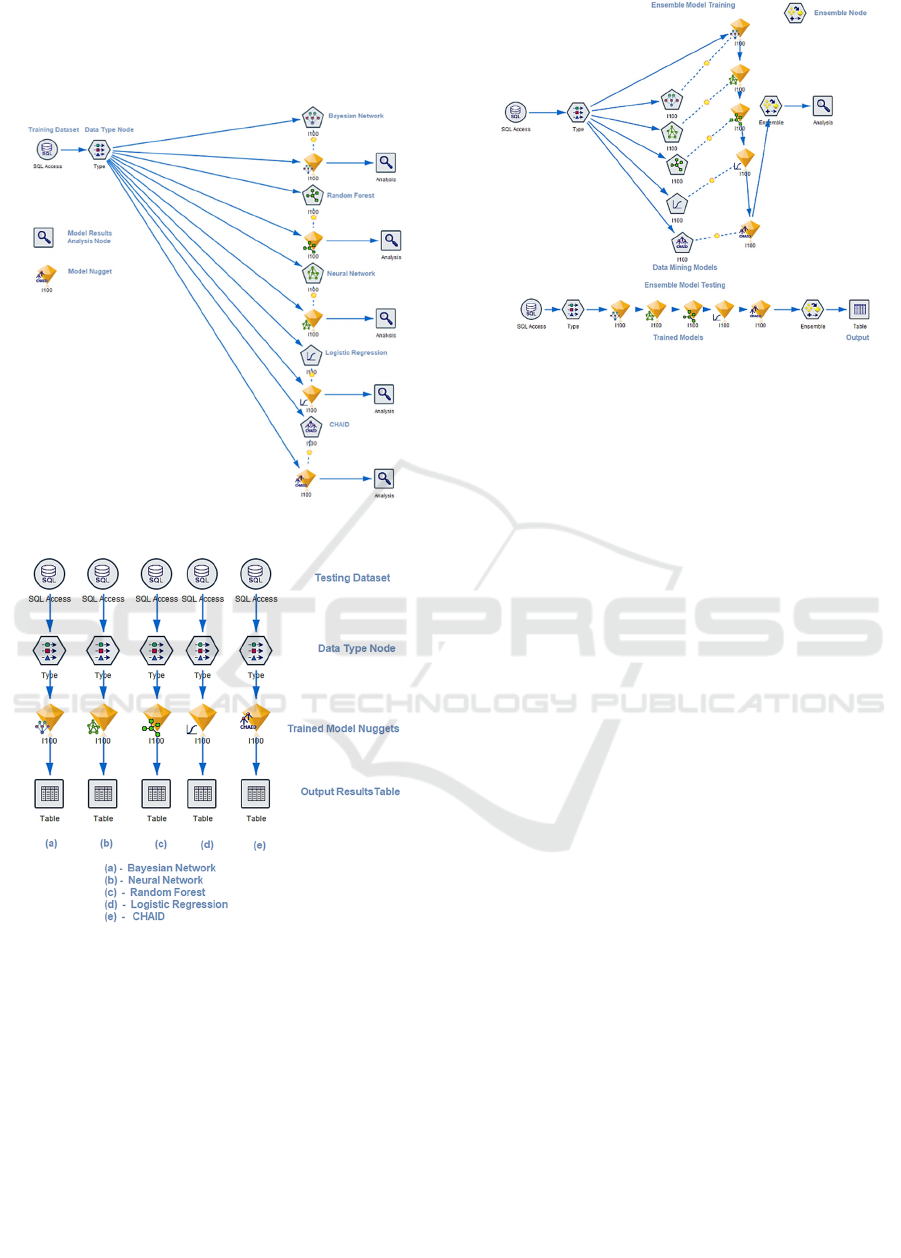
Figure 3 shows the training model for prediction
of I100 (hypertension) using five data mining
algorithms. The SQL Access data source node
establishes a connection to diabetes database and
extracts the dataset consisting of the finalized twenty-
six variables. Twenty-four of these variables were the
input variables and the remaining two variables were
excluded because they were either a unique identifier
(Patient Code) or the target variable (I100). The Type
node is used to specify the data type of the selected
variables as either nominal, categorical, continuous,
flag or ordinal. Additionally, this node allows to
specify whether a variable is input or target and
provides an option to specify a unique identifier
(Patient Code). The diagnosis codes, physician code
and the target variable were all assigned as a flag
datatype due to the binary values, such as 0 or 1.
Patient Code, Age, Average Length of Stay were
assigned as continuous which is used to describe
numeric values. Facility Health Service Delivery
Area and Facility Name were assigned as nominal
which is used for storing string values. The Type node
is connected to the data mining model nodes each of
which represent one of the five algorithms. Executing
these nodes generates the model nugget which
HEALTHINF 2023 - 16th International Conference on Health Informatics
56
contains the results of the trained model for the
selected algorithm. The results from the model nugget
are connected to the analysis node which calculates
the prediction accuracy of the model.
Figure 3: Predictive Model – Training.
Figure 4: Predictive Model – Testing.
Figure 4 shows the testing model used for predicting
one of the target variables (I100). In this figure, the
data sources represent the testing dataset which
includes 30% of patients with I100. A major
difference between the testing and training data
source / type is that the former does not contain
information of the corresponding target variable. The
trained model nuggets possess the required
information to predict the target variable using the
selected data mining algorithm. These results are
pushed to an output table for analysis.
Figure 5: Predictive Modeling Ensemble Training/Testing.
Figure 5 shows the training and testing models for the
Ensemble algorithm. The corresponding node
combines results from the five trained models and
generates a field containing the aggregated results
which are then passed to the analysis node. Note that
the Type node is connected to only one model nugget.
This is because the data types of the variables are
fetched from the first model nugget and then passed
to the other four model nuggets followed by the
Ensemble node. For testing, the five model nuggets
are connected to each other and then to the Ensemble
node which is connected to the Table node to generate
aggregated results for analysis.
The process described above is also implemented
for the other two target variables (I500, N179).
3.2 Model Accuracy
The results from the output table for all models were
pushed into the diabetes database. The predicted
column and the existing target variable information
was compared for each row and the statistical
accuracy of predictions was computed as the ratio of
accurate predictions and total values in the dataset. It
was observed that the accuracy of predictions for all
algorithms was consistently better for true negative
cases compared to true positives. This is due to the
comparatively fewer true positive cases in all
datasets.
Ensemble and Logistic Regression had the
highest accuracy for predicting patients with or
without hypertension (Figure 6). Both these
algorithms recorded identical accuracies of 84.15%.
The low accuracy (81.7%) of Random Forest can be
attributed to overfitting problem which is one of the
drawbacks of this algorithm. The dataset had 83%
.
Predicting Comorbidities in Diabetic Patients and Visualizing Data for Improved Healthcare
57
patients without hypertension and 17% patients who
were diagnosed with I100 hypertension. For patients
without hypertension, the six algorithms yielded an
average accuracy of 97.2%. However, the average
accuracy for those with hypertension was only 15%.
The reason for this low accuracy is the small number
of patients in this group for the training dataset.
Specifically, there were 2,656 patients with
hypertension which is only 18.9% of the total
patients.
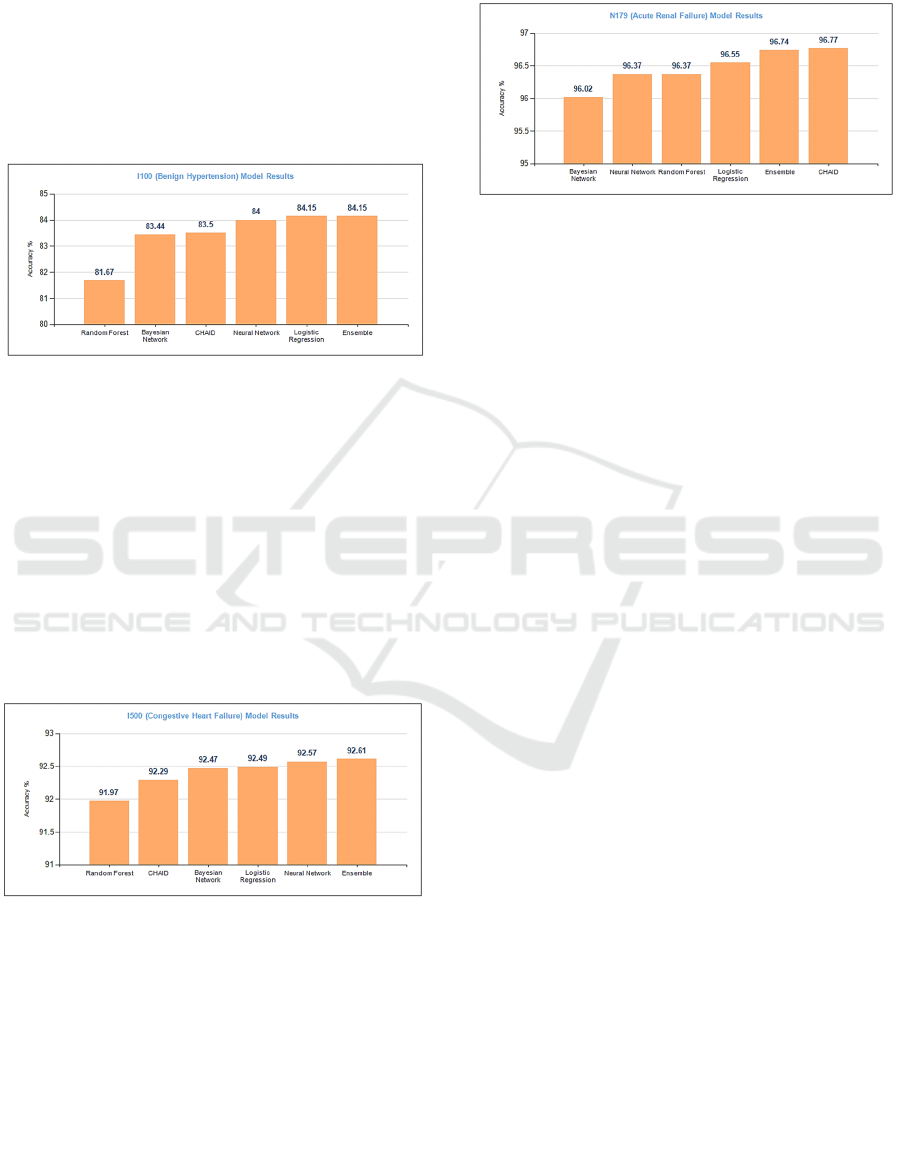
Figure 6: Predictive Model Results for I100.
Figure 7 shows the accuracy of the trained models
for target variable I500 (Congestive Heart Failure).
Both Ensemble and Neural Network demonstrated
similar accuracy of 92.6%. Logistic Regression,
Bayesian Network and CHAID had accuracies of
92.5%, 92.5%, and 92.3%, respectively. The average
accuracy to predict patients with and without
congestive heart failure was 29.1% and 98.7%,
respectively. As explained earlier, the smaller number
of patients in the training dataset for this group (<10%
patients diagnosed with I500) contributed to the low
accuracy.
Figure 7: Predictive Model Results for I500.
Figure 8 shows the overall accuracy of all algorithms
for target variable N179 (Acute Renal Failure).
CHAID, Ensemble and Logistic Regression had
accuracies of 96.77%, 96.74%, and 96.55%,
respectively. Random Forest and Neural Network
recorded an identical accuracy of 96.37% and
Bayesian Network had an accuracy of 96%. Within
the database, there were a total of 1,303 patients who
were diagnosed with N179; these patients were split
into training and testing datasets in the ratio of 70:30.
The average accuracy for predicting patients with and
without N179 is 63.7% and 98.8%, respectively.
Figure 8: Predictive Model Results for N179.
In summary, all algorithms perform relatively similar
for each of the three target variables. This is likely due
to the fact that 1) Auto Classifier node was used to
identify the data mining algorithms with high
accuracies for all three target variables, 2) only the
important variables identified by FS algorithm were
selected as input variables, and 3) all twenty diagnosis
codes, including the target variable, had binary data
(0,1). Random Forest occasionally suffered from
overfitting problem that trained the models to learn
the noise thereby leading to negative impact on
accuracy.
An interesting observation was made when
predicting true positive cases only. For instance, for
N179, CHAID had the highest accuracy of 67.7%
followed by Ensemble with 66.4%. Bayesian
Network, Logistic Regression and Neural Network
had accuracies of 63.8%, 63.6% and 61%,
respectively. For reasons mentioned earlier, Random
Forest had the lowest accuracy (59.7%) for predicting
patients diagnosed with N179.
As the percentage of
diagnosed patients for a target variable decreased,
there was an increase in accuracy of predicting true
positives across all algorithms. Since N179 consisted
of the lowest percentage of diagnosed patients, it had
a comparatively higher accuracy for predicting true
positive cases, followed by I500 and I100.
Overall, the accuracy of predictions for all
algorithms was consistently better for true negative
cases compared to true positives.
4 COMORBIDITY ASSESSMENT
TOOL
To predict the likelihood of a specific comorbidity for
an individual case, an interactive web form has been
developed which uses the predictive models on the
backend. Specifically, the source node is replaced by
HEALTHINF 2023 - 16th International Conference on Health Informatics
58
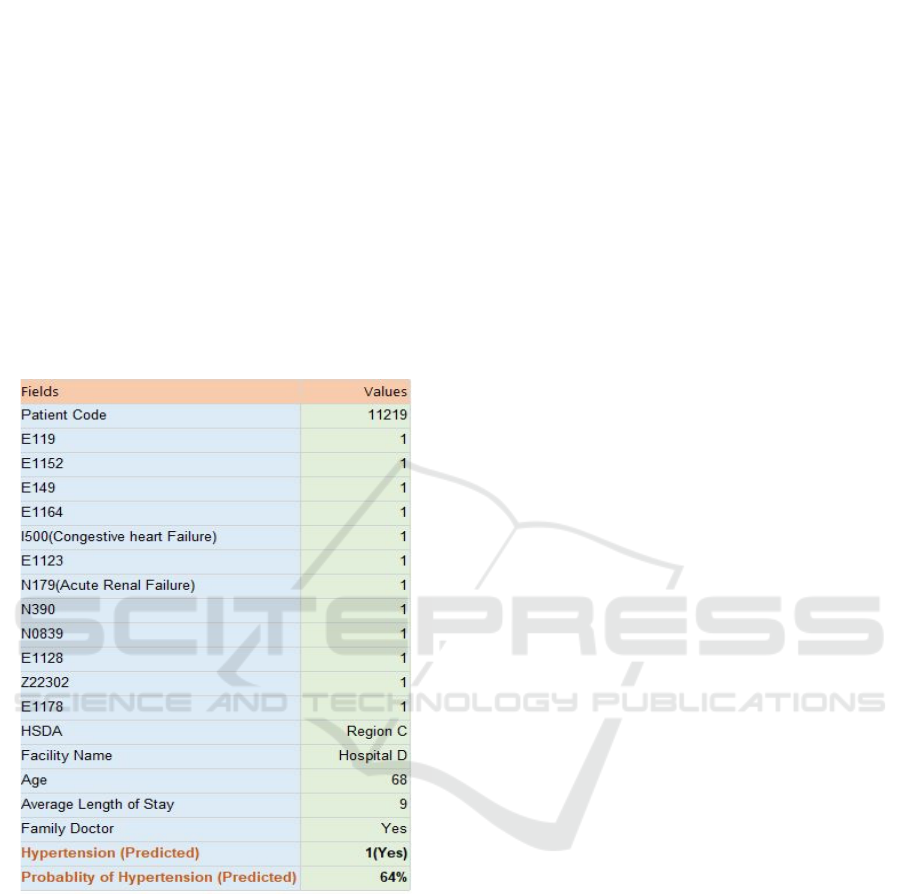
a User Input node which allows the user to enter
values of all variables for a specific patient and
generates the corresponding output instantly. An
example for predicting I100 (hypertension) using this
tool is shown in Figure 9. The Ensemble algorithm
has been used in this case because it had the highest
accuracy for predicting I100 among all six
algorithms. The predicted value of 1 indicates that the
patient will have hypertension in future, and there is
a probability of 64% for this to happen. This patient
was diagnosed with multiple comorbidities, which
included the other two target variables (I500, N179).
The prediction was in conformance with the actual
data for this patient who was in fact diagnosed with
hypertension. The web form can be connected to any
of the six algorithms running in the background.
Figure 9: Comorbidity Assessment Tool.
5 DATA VISUALIZATION
Dashboards are an effective tool which allow
visualization of large amounts of data in an intuitive
manner without delving into complex statistics.
Interactive data visualizations can help users to
quickly identify patterns and trends that can enable
effective decision-making. The Canadian Diabetes
Association established that health professionals
were more effective in treating diabetes patients when
using a dashboard which provided knowledge of
other risk factors and associated guidelines (Diabetes
Canada. (n.d.).). Similarly, patients who are presented
with a dashboard listing the risk factors tend to benefit
from the knowledge contained therein. For this
research, Microsoft’s SQL Server Reporting Services
(SSRS) was selected to build the dashboard due to its
simplicity, capability to produce interactive
visualizations and ability to adjust with fast changing
datasets. Among other things, SSRS provides features
including compatibility with a variety of data sources,
interactive sorting capabilities, drill-down/drill-
through reporting, security via access controls, and
export features. Microsoft SQL server was used as the
backend database and a wrapper to render reports.
The dashboard consists of three top-level reports
and several drilldown sub-reports. The top-level
aggregated reports show overall aggregated statistics
for the dataset, prominent comorbidities and primary
diagnosis codes for patients with different types of
diabetes, and a comparative analysis of aggregated
patients and admission statistics across all health
service delivery areas. Figure 10 shows the main
dashboard that displays the clinical data sliced along
various dimensions such as population, diagnosis
codes, diabetes types, average age, admissions, and
comorbidities for patients admitted in respective
facilities over the years. The dashboard allows
navigation to reports at a finer granularity via
drilldowns. The dashboard presents insightful
information such as obesity rates based on
geographical locations, food habits and the overall
trend for diabetes over the years. Such information
can educate the users about diabetes and its impact on
health. The charts in the top row show an overview of
aggregated statistics. The admitted patients recorded
an average of four diagnoses from the possible 4,592
diagnosis codes. The maximum number of diagnosis
codes recorded for a patient was 89, there were four
patients who recorded more than 80 comorbidities
and fifty patients who recorded between 50-80
comorbidities. The geographic distribution of
diabetic patients and admissions is also shown.
Drilldown from this chart shows a further breakdown
of these numbers for each local health region. The
number of patients diagnosed with diabetes and
number of admissions show an interesting correlation
over the years. The T2D patient count consistently
dropped until it reached a plateau in 2017/18. On the
other hand, the admissions trend is quite the opposite
with 2017/18 recording the highest number of
admitted patients. Overall, residents in this province
had a lower prevalence of diabetes (5.7-5.9%) than
the national average of 6.5-7.3% over the study
period. A similar pattern was observed for T1D
patients.
Predicting Comorbidities in Diabetic Patients and Visualizing Data for Improved Healthcare
59
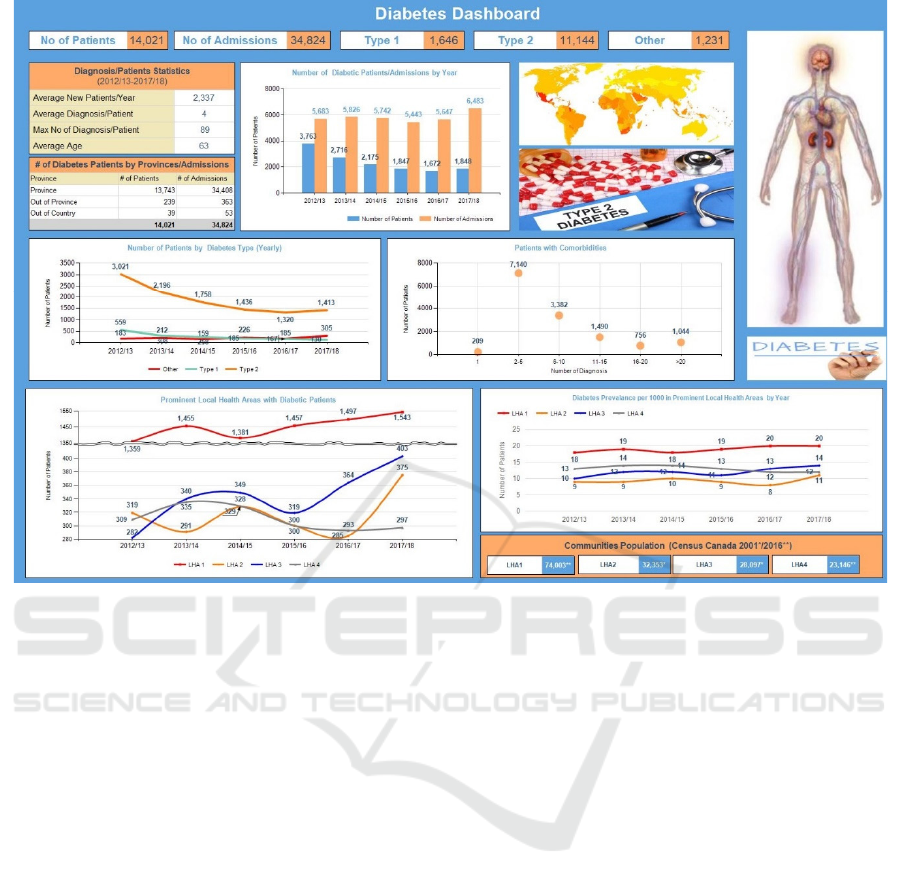
Figure 10: Diabetes Dashboard.
On average, a patient had four diagnosis codes
with the majority of patients having two to five
comorbidities. The lowest number of patients was
recorded for 16-20 comorbidities and then an increase
was observed for 20+ comorbidities. The next chart
shows the prominent communities that had the
highest number of diabetic patients. The dataset
consisted of 305 communities and seventy local
health regions of Community_1 recorded the
maximum number of patients consistently over the
years. The Hospital A in Community_1 accounted for
53% of the total patients and 47% of overall
admissions. Hospital B in Community_2 accounted
for 7% of the total patients and 13% of the overall
admissions. It was also observed that all communities
showed an increase of patients in the year 2017/18
from the previous year making it consistent with the
trends noted earlier. LHA_1, LHA_2, LHA_3 and
LHA_4 consist of 15, 3, 13 and 16 communities,
respectively. The last chart on this dashboard shows
prevalence of diabetes per thousand of the population.
LHA_1 recorded the maximum prevalence per
thousand residents over the study period. An
interesting observation is that while LHA_1 and
LHA_2 did not show any change between 2016/17
and 2017/18, both LHA_3 and LHA_4 showed a
slight increase over the same period. This is
consistent with the earlier observation where a spike
in the number of patients was observed for both LHAs
during this period.
5.1 Diabetes Types & Comorbidities
Figure 11 shows the overall aggregated statistics
broken down by diagnosis codes specific to the type
of diabetes and comorbidities. The clinical data has
been sliced along various patient groups (T1D, T2D
and other types of diabetes) and diagnosis. It was
interesting to note that 51% of the patients had been
diagnosed with between two to five comorbidities in
addition to diabetes.
The top chart shows vital statistics related to
comorbidities. It was observed that one in five
diabetic patients had hypertension and one in ten had
heart/renal failure. These three comorbidities
accounted for 39% of the total patients and 22% of
the total admissions. Further, comorbidities
accounted for 98% of the total diagnosis codes. Upon
admission, multiple diagnosis codes are normally
entered, one of which becomes the primary ‘most
responsible’ code. The top five primary diagnosis
codes which account for 23% of total patients and
HEALTHINF 2023 - 16th International Conference on Health Informatics
60
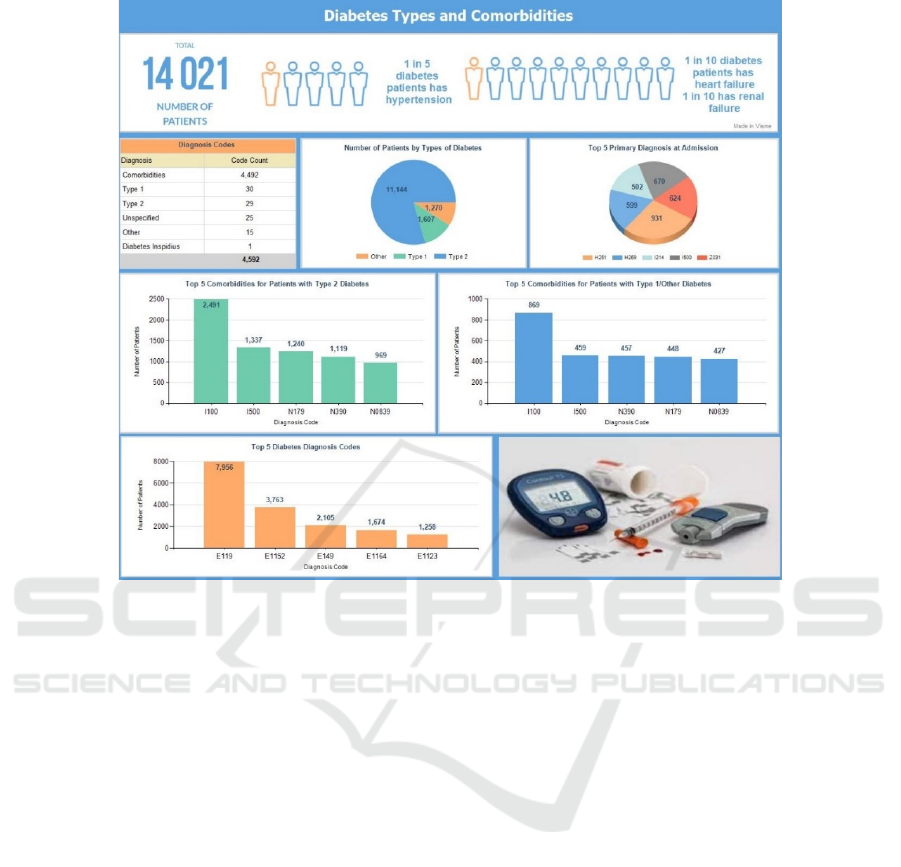
Figure 11: Diabetes Types/Comorbidities.
15% of total admissions are H251 (senile nuclear
cataract), H269 (unspecified cataract), I214 (acute
subendocardial myocardial infarction), I500
(congestive heart failure), and Z031 (suspected
malignant neoplasm). It is worth mentioning that
while H251 is showing the maximum number of
patients’ primary diagnosis, it is not the case when all
diagnosis types are included. For example, H251
accounted only for 4% of the total admissions and 7%
of the total patients. Thus, it was not identified as a
target variable when building the model. The top five
comorbidities for patients with T2D were benign
hypertension (I100), congestive heart failure (I500),
unspecified glomerular disorders (N0839), acute
renal failure (N179), and urinary tract infection
(N390). It was observed that 65% of the patients with
T2D were diagnosed with one or more of these
comorbidities, 48% were diagnosed with one or more
of the top three comorbidities (I100, I500, N179)
which were also selected as target variables for the
predictive model. The top five comorbidities
diagnosed for patients with T1D or any other types of
diabetes excluding T2D represented 95% of the total
patients in this group. The three target variables
accounted for 63% of patients. The top two
comorbidities (hypertension and congestive heart
failure) are the same in both sets (T2D and T1D);
however, the third and fourth comorbidities (N390
and N179) are reversed. Finally, the top five
diagnosis codes embedded with different types of
diabetes is shown. Four of these codes (starting with
‘E11’) represent T2D patients that can be attributed
to the fact that majority of the patients in this dataset
have been diagnosed with T2D.
Figure 12 shows a comparison of aggregated
statistics for each of the three HSDAs – A, B and C -
which recorded 24%, 57% and 19% of the total
patients, respectively. It was noted that 6% of the
patients migrated to other communities and were thus
counted more than once. This, however, does not
impact the number of visits because those are
recorded independent of the patient’s community. On
average, approximately two admissions per patient
were recorded across all HSDAs, including out-of-
province patients. Even though Region B recorded
majority of the patients as well as admissions, the
average length of stay (LOS) was very similar across
all HSDAs. A similar pattern was also observed for
patients who had family physicians. There was a total
of nineteen communities which recorded over 100
patients for the years 2012/13 to 2017/18. Among
these, Community_3 had 85% of patients without a
Predicting Comorbidities in Diabetic Patients and Visualizing Data for Improved Healthcare
61
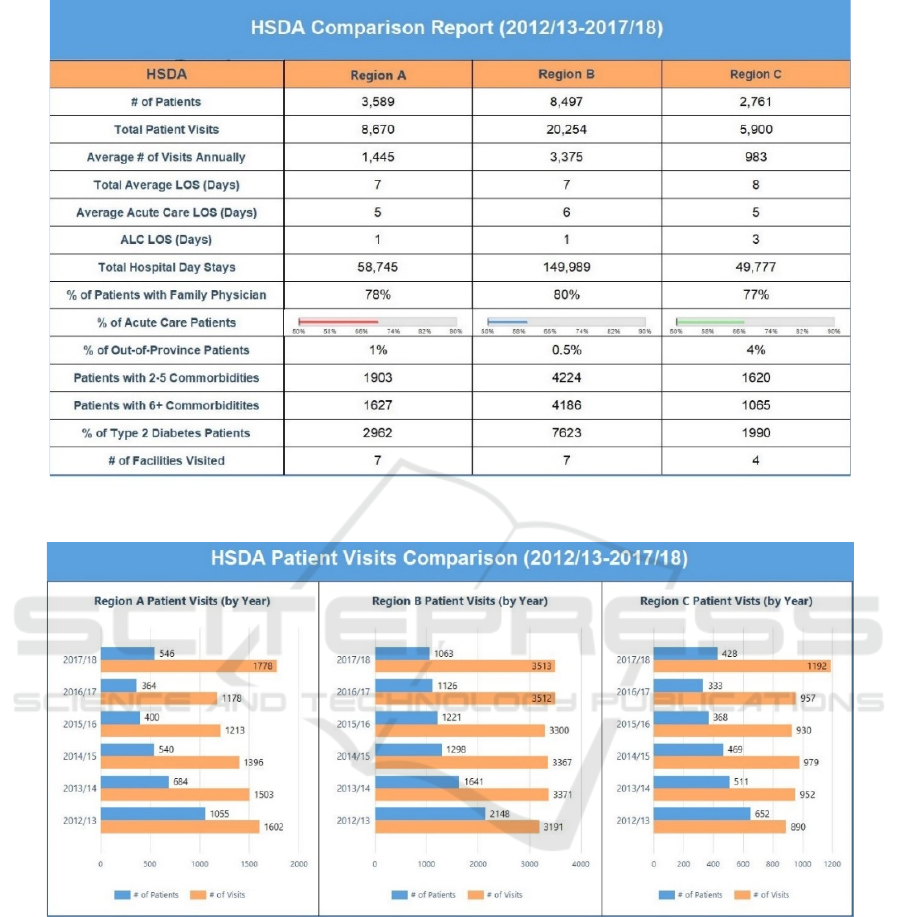
Figure 12: Comparison across regions.
Figure 13: Patient Visits Comparison Report.
family doctor followed by other communities where
73%, 42%, 40%, and 33% of patients had no family
doctor. The five communities with the highest
number of patients had 14%, 27%, 18%, 14% and
11% patients with no family doctors. Region C had
the highest number of patients visiting from outside
of the province. A breakdown of out-of-province
visits is also provided at the facility level.
The number of patients who were recorded with
only one diagnosis code was less than 2% in each of
the HSDAs. Patients with two to five comorbidities
represented 53%, 50% and 59% of the total number
of patients in Regions A, B and C, respectively.
Patients with six or more comorbidities were 45%,
49% and 39% for the same HSDAs, respectively. The
three HSDAs had a variation ranging from 72% (C)
to 90% (B) for number of patients with diagnosis code
related to T2D. Of the eighteen facilities across all
HSDAs, Hospital_A admitted 50% of the total
patients followed by Hospital_C (11%) and
Hospital_D (10%). The lowest number of patients
was admitted by Hospital_E (0.5%). Figure 13 shows
the drilldown for annual breakdown of cumulative
visits and number of patients across all HSDAs.
HEALTHINF 2023 - 16th International Conference on Health Informatics
62

6 CONCLUSION
Diabetes is a chronic disease whose prevalence is
growing at a rapid rate throughout the world. In
Canada, one person is diagnosed with diabetes every
three minutes, and one in ten deaths are attributed to
this disease. Due to this prevalence, it has received
global attention and vast amounts of data has been
collected. Unfortunately, this data exists in disparate
repositories and has not been harnessed to its full
potential. One of the key shortcomings of existing
research towards this cause is the use of non-clinical
data which is collected using surveys and self-
administered questionnaires. The dataset used for this
research was obtained from a health authority and
exclusively comprised of diabetic patients. In order to
make this clinical data valuable for physicians and
other stakeholders, several KPIs were identified
which provided insight into historical trends and
patterns for using visual analytics. These metrics are
then presented on a visually appealing dashboard
which consists of top-level reports and numerous
drill-down and drill-through reports for insights at
finer granularity. The data was mined for predictive
analysis. Six representative data mining algorithms
were evaluated for analysis of three target variables.
Overall, an accuracy of 83.5%, 92.4% and 96.5% was
observed for I100, I500 and N179, respectively. The
developed models were then incorporated into an
interactive assessment tool that takes input from the
user via an interactive web form and predicts the
likelihood of one of the three comorbidities in future.
In summary, the study methodology consists of
the following steps: integration of a clinical diabetes
dataset into SQL database, data preprocessing, data
analysis, selection of the input and three predictor
variables for diabetes comorbidities, evaluation of
relative performance of various data mining
algorithms, displaying results on an interactive
dashboard and building an integrated, user-friendly
tool to calculate the risk of developing comorbidities
for individual patients.
There is potential for future research in this area.
For instance, it would be more desirable to have an
exclusive code for recording the type of diabetes and
separate the comorbidities diagnosis of the patients.
Similarly, physicians could identify combinations of
different diagnosis codes for a potentially higher
prediction accuracy due to larger grouping. Finally,
adding time dimension to the metrics could allow a
longitudinal study leading to prediction of timelines
when a comorbidity is likely to occur.
REFERENCES
Anand, R. S., Stey, P., Jain, S., Biron, D. R., Bhatt, H.,
Monteiro, K., Chen, E. S. (2018). Predicting Mortality
in Diabetic ICU Patients Using Machine Learning and
Severity Indices. AMIA Joint Summits on Translation
Science Proceedings, 2018(1), 310-319.
Dagliati, A., Sacchi, L., Tibollo, V., Cogni, G., Teliti, M.,
Martinez-Millana, A., Be, R. (2018). A dashboard-
based system for supporting diabetes care. Journal of
the American Medical Informatics Association, 25(5),
538-547.
Diabetes Canada. (n.d.). Why Federal Leadership Is
Essential Concerning Diabetes. Retrieved Dec 20,
2017, from https://www.diabetes.ca/how-you-can-
help/advocate/why-federal-leadership-is-essential
Heikes, K. E., Eddy, D. M., Arondekar, B., & Schlessinger,
L. (2008). Diabetes Risk Calculator: A Simple Tool for
Detecting Undiagnosed Diabetes and Pre-Diabetes.
Diabetes Care, 5, 1040-1045.
IBM. (2020). SPSS Modeler - Overview. Retrieved
September 22, 2020, from https://www.ibm.com/ca-
en/products/spss-modeler
Kumari, S., & Singh, A. (2013). A data mining approach
for the diagnosis of diabetes mellitus. 2013 7th
International Conference on Intelligent Systems and
Control (ISCO). Coimbatore, India: IEEE.
Lau, M., Campbell, H., Tang, T., J S Thompson, D., &
Elliott, T. (2014). Impact of Patient Use of an Online
Patient Portal on Diabetes Outcomes. Canadian
Journal of Diabetes, 38(1), 17-21.
Lindström, J., & Tuomilehto, J. (2003). The Diabetes Risk
Score: A Practical Tool to Predict Type 2 Diabetes
Risk. Diabetes Care, 26(3), 725-731.
Meng, X.-H., Huang, Y.-X., Rao, D.-P., Zhang, Q., & Liu,
Q. (2013, February). Comparison of three data mining
models for predicting diabetes or prediabetes by risk
factors. The Kaohsiung Journal of Medical Sciences,
29(2), 93-99.
Microsoft. (n.d.). Microsoft SQL documentation. Retrieved
November 1, 2020, from https://docs.microsoft.com/
en-us/sql/?view=sql-server-ver15
Zhang, L., Shang, X., Sreedharan, S., Yan, X., Liu, J., Keel,
S., Wu, J., Peng, W., He, M. (2020). Predicting the
Development of Type 2 Diabetes in a Large Australian
Cohort Using Machine-Learning Techniques:
Longitudinal Survey Study. JMIR MEDICAL
INFORMATICS, 8(7).
Predicting Comorbidities in Diabetic Patients and Visualizing Data for Improved Healthcare
63
