
Turkish Sign Language Recognition Using CNN with New Alphabet
Dataset
Tu
˘
gçe Temel
1
and Revna Acar Vural
2
1
Department of Computer Engineering, Istanbul Technical University, Istanbul, Turkey
2
Department of Electronic and Communication Engineering, Yildiz Technical University, Istanbul, Turkey
Keywords:
Turkish Sign Language, Dataset, CNN, Sing Language Recognation.
Abstract:
Sign Language Recognition (SLR), also referred to as hand gesture recognition, is an active area of research
in computer vision that aims to facilitate communication between the deaf-mute community and the people
who don’t understand sign language. The objective of this study is to take a look at how this problem
is tackled specifically for Turkish Sign Language (TSL). For this problem, we present a system based on
convolution neural networks (CNN) in real-time however the most important part of this study to be underlined
is that we present the first open-source TSL alphabet dataset to our knowledge. This dataset focuses on
finger spelling and has been collected from 30 people. We conduct and present experiments with this new
and first open-source TSL dataset. Our system scores an average accuracy of 99.5
%
and the top accuracy
value is 99.9
%
with our dataset. Further tests were conducted to measure the performance of our model
in real time and added to the study. Finally, our proposed model is trained on a couple of American Sign
Language (ASL) datasets, the results of which turn out to be state-of-the-art. You can access our dataset from
https://github.com/tugcetemel1/TSL-Recognition-with-CNN.
1 INTRODUCTION
Language is the primary way of communication and
is either spoken, written or symbolic. It traditionally
consists of the use of words or signs. There are 45 mil-
lion hearing-impaired people, 34 million of whom are
children based on World Health Organization (WHO)
statistics(ba, ). In Turkey, there are over 4 million
people with hearing and speech disabilities accord-
ing to the National Turkish Statistical Institute (tik,
). Sign language doesn’t have an international form
which means that sign languages in different coun-
tries can be quite different from each other. Different
accents of sign languages exist just as it does for spo-
ken languages(for example American and British sign
languages). This is quite a difficult situation for both
using and understanding sign languages. There are not
many people who know sign language which is why
the deaf-mute community has a hard time communicat-
ing with the rest of the population. All these reasons
encouraged us to work on this project. Our aim with
this study is to help the lives of sign language users by
breaking down the communication barriers between
them and the rest of the population. Since sign lan-
guage is not in an international form we chose Turkish
sign language and focused on the fingerspelling part.
We explained in detail why we focus on fingerspelling
in section 3. Considering the studies with Turkish Sign
Language (TSL) in the literature, it has been seen that
almost all of them are word-based. Although a part of
the use of sign language consists of words, the person
uses fingerspelling too. We explained the usage area
of fingerspelling in section 3.
As we mentioned before, there are only a handful
of studies in this area despite there being many people
who use sign language in Turkey. Therefore, there was
no dataset for the TLS alphabet therefore we collected
a dataset, at the time of this study. We published our
collected dataset as open-source. In this regard, our
dataset is the first open-source TSL alphabet dataset.
Our collected dataset consists of 22 static letters of
the TSL alphabet. What we mean by static letter is that
it can only be represented by a single sign. Despite,
some letters having more than one representation sign
we collected only one of them per letter. After we
constructed the dataset, separated it according to its
classes. Following this, we proposed a CNN architec-
ture. To obtain stable and accurate results, we repeated
the training process 5 times and selected random data
for each time. The contribution of this study is was
highlighting as follows:
Temel, T. and Vural, R.
Turkish Sign Language Recognition Using CNN with New Alphabet Dataset.
DOI: 10.5220/0011628700003417
In Proceedings of the 18th International Joint Conference on Computer Vision, Imaging and Computer Graphics Theor y and Applications (VISIGRAPP 2023) - Volume 4: VISAPP, pages
179-186
ISBN: 978-989-758-634-7; ISSN: 2184-4321
Copyright
c
2023 by SCITEPRESS – Science and Technology Publications, Lda. Under CC license (CC BY-NC-ND 4.0)
179

•
The first open source, large-scale alphabet-based
TLS dataset was introduced.
•
State-of-the-art results were obtained for the tested
datasets.
2 RELATED WORK
Up until now a lot of work has been done in the fields
of American Sign Language (ASL), British Sign Lan-
guage (BSL), and Indian Sign Language (ISL). Sign
language studies are divided into two categories; static
and dynamic. So far two methods have been pro-
posed in the studies to recognize these hand gestures.
These proposed methods namely; are device-based and
vision-based approaches. In vision-based work, noth-
ing is needed except for a camera. And the user does
not need to use any additional mechanism. However,
device-based studies need data gloves, sensors and
capture devices. There are many sensor-based studies
in the literature(Wu et al., 2015; Bukhari et al., 2015;
Park and Kwon, 2021). This study is vision-based, so
we will focus on vision-based studies in this section.
Oz and Leu(Oz and Leu, 2011) have developed
an ASL hand signs identification system called cyber-
glove. In this study, a user wears sensor-based gloves
and gloves extracted a few features. These features are
processed and classified by an artificial neural network
(ANN). Oz and Leu(Oz and Leu, 2011)’s study is an
example of a device-based approach and reported that
the accuracy of 90%.
Nagi et al.(Nagi et al., 2011) designed a vision-
based system which used Max-pooling CNN. They
collected a dataset with coloured gloves for training
and testing. This data set consists of 6 classes and 6000
sign images. They employed color gloves to retrieve
hand contours. Although this study is not sensor-based,
the environment is kept very limited with the help of
coloured gloves. It is not very useful due to the use of
gloves as an additional material. This study achieved
an accuracy rate of 96
%
. Van den Berg et al.(Van den
Bergh and Van Gool, 2011) proposed a hand gesture
recognition system with Haar wavelets. This study
was carried out on a small dataset. The dataset con-
sists of 350 image samples from 6 classes. The system
extracts features using Haar wavelets and classifies
the inputs by database searching. Pigou et al.(Pigou
et al., 2014) proposed an Italian sign language recog-
nition system with CNN. They used the data set from
the ChaLearn Looking at People 2014(Escalera et al.,
2014) (CLAP14). The dataset consists of 20 classes.
Even though they reported 95.68
%
accuracy, they men-
tioned that the users in the test set could be in the
training and validation set.
Haberdar and Albayrak(Haberdar and Albayrak,
2005) developed a system that recognizes Turkish
word-based sign language using Hidden Markov Mod-
els. They started the study by collecting a dataset and
randomly selecting from the Turkish Sign Language
Manual for Adults(Hasan DIKYUVA, 1995) and came
up with 50 kinds of TSL words. In total, they collected
over 750 samples in video form. They detect skin tone
with transformations on the YCbCr colour space and
extracted the face and then hands in the video. After
finding the hands, they get 4 frames in the video and
formed 4 element feature vectors which represented
the x and y coordinates of both hands. Finally, they
used the Baum-Welch algorithm to train HMMs. They
reported an accuracy of 95.7
%
which was achieved as
a result of the final test. Demircioglu et al.(Mercanoglu
and Keles, 2020) presented a new large-scale dataset.
This dataset is composed of 38336 video samples in
total, consisting of 236 signs collected from 43 dif-
ferent people. 236 signs were chosen from the most
used words in everyday sign language. Each sample is
recorded with Microsoft Kinect v2 and contains RGB,
skeleton modality, and depth. The study created an
architecture in which structures such as CNN, LSTM,
and Attention modules are used together. 96.11
%
suc-
cess was achieved when the created architecture was
trained with the RGB-D dataset.
3 DATASET
The dataset was collected under different conditions
in the real world. Our dataset consists of static letters
of the TSL alphabet. We would like to underline that
although words are generally preferred in daily use,
specifically letters are preferred in the study. This is
because finger-spelling is quite important in real-life
use. When we consider the use of Finger-spelling, the
following important points emerge:
•
Learning sign language is quite difficult contrary to
popular belief. It is even more difficult for children.
For this reason, someone who has just started to
learn sign language uses letters instead of words.
•
If the individual who uses sign language does not
know the sign language equivalent of the word, or
if the word does not have a sign language equiva-
lent due to the rapidly developing language, letters
are used instead.
•
In general, the first question asked in communica-
tion between two people is the name of the person
and the person uses letters to say his name and
surname.(tak, )
VISAPP 2023 - 18th International Conference on Computer Vision Theory and Applications
180
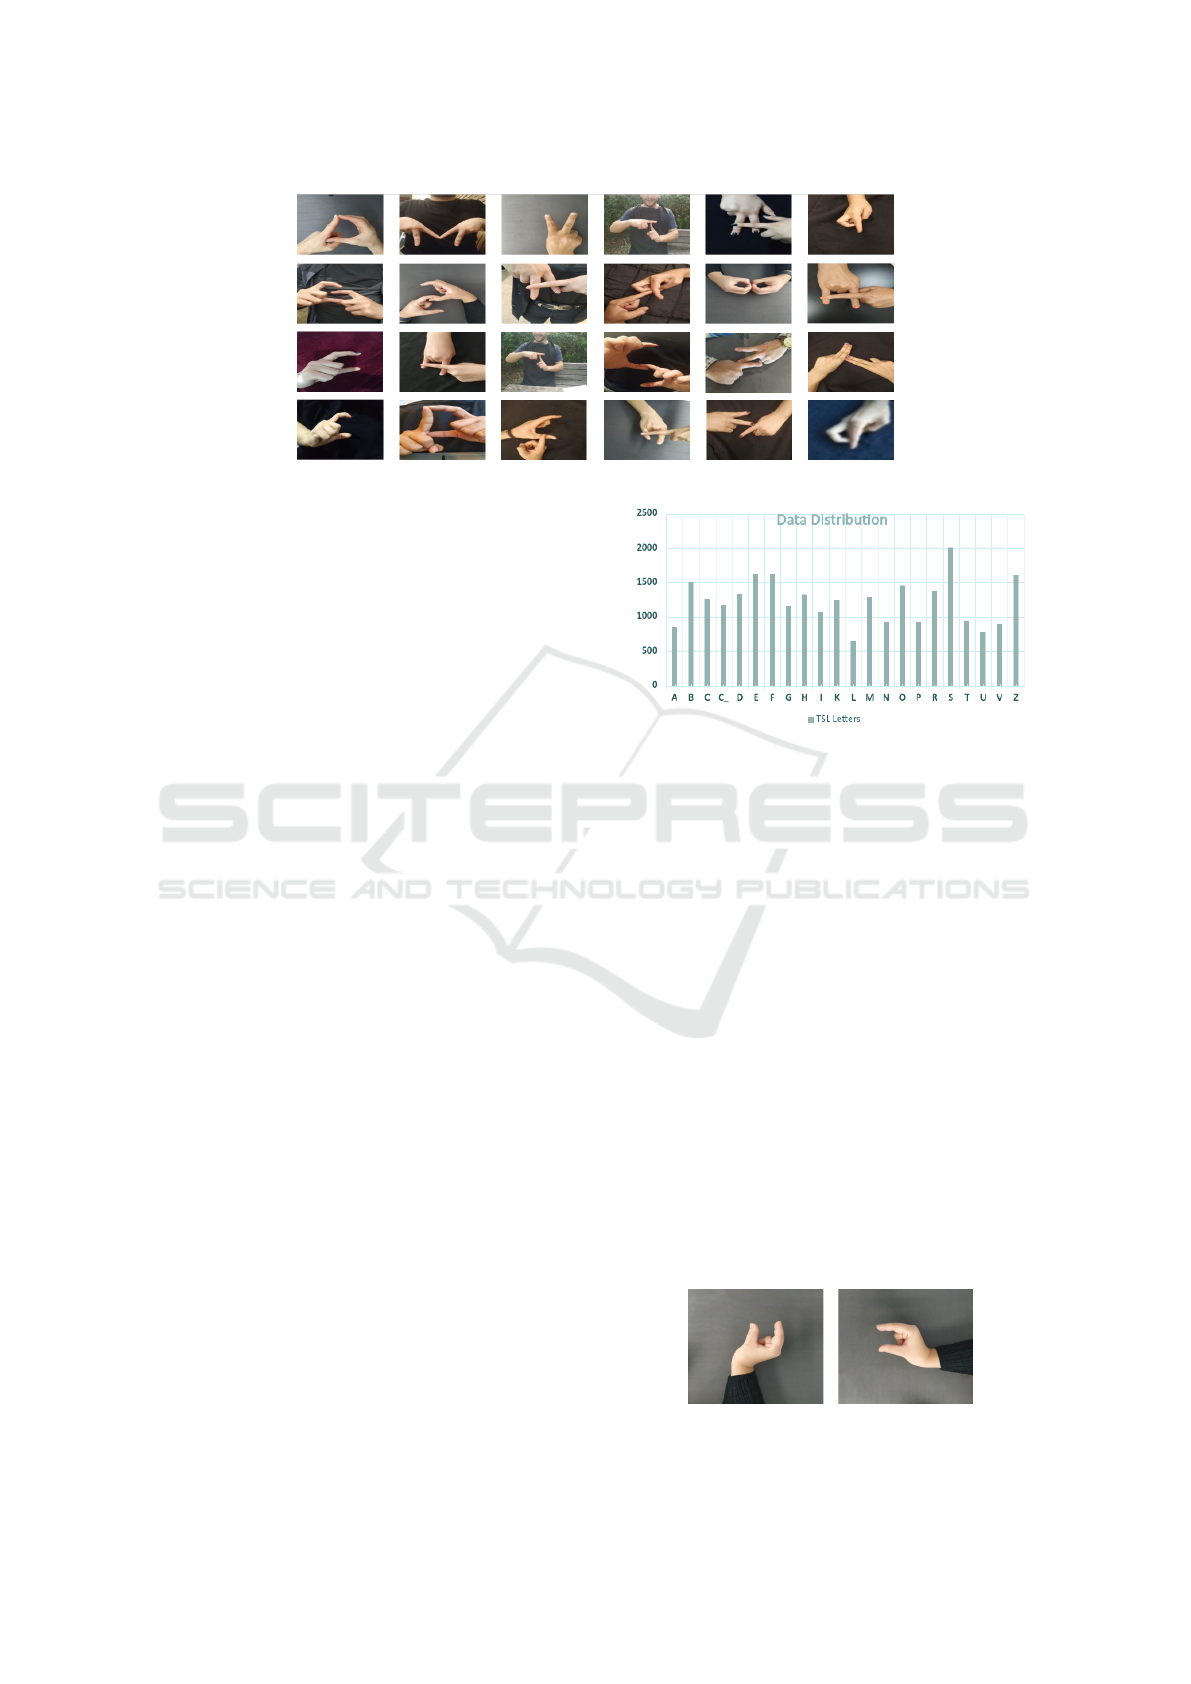
Figure 1: Collected dataset.
3.1 Volunteer Information
The dataset was collected from 30 different volun-
teers in a controlled environment. We mean by a con-
trolled environment that all data is collected on a dark
background with different tones, textures, and environ-
ments. These volunteers consisted of people between
the ages of 18- 45 who have different races. Some of
the volunteers are real sign language users, some know
fluent in sign language, and some are people who do
not know the language and imitate the sign with the
help of experts.
3.2 Dataset Collection
The TSL dataset was collected from either the right
or left hands and consists of these letters; A, B, C,
Ç, D, E, F, G, H, I, K, L, M, N, O, P, R, S, T, U,
V, and Z. We excluded 7 letters(
˘
G,
˙
I, J, Ö, ¸S, Ü, Y)
because they were the dynamic type which can’t be
described by a single image. For each static letter, we
collected about 30 images from each volunteer. Since
the representation of some signs of the letter is pretty
difficult(P, R, K, etc.)so we could not collect these
letters from some of the volunteers. Each data was
collected with 3 different cameras, more than one envi-
ronment, and different angles to have enough variance
between them. We saved the collected data as RGB in
64x64 pixel JPEG format. Ultimately, a total of 18100
images were collected from the volunteers. After this
step, we increased the dataset size with augmentation
techniques.
3.3 Data Augmentation
Data augmentation helps increase the diversity and
size of data available without collecting new data sam-
ples. We applied this technique with the same aims but
had a problem with augmented data. The problem is
that some letters(C, U, etc.) looked the same in some
Figure 2: Data distribution of our dataset.
conditions. We attached a figure below to explain the
problem in detail. This problem caused some letters
to be learned incorrectly by the model. That’s why
we didn’t use the augmented data directly in the next
training. We applied data augmentation for each class
separately and saved the newly created data in different
folders with the same name as its label. We controlled
and cleaned each folder for the mentioned problem
and concatenated it with the original data. The size
of our dataset is 27064 which should have been more
than now size in normal conditions, but we cleaned
some augmented data due to the mentioned problem.
We added a figure that displays the data distribution
in Figure 2.As seen in Figure 3 label for both of them
is the letter "U" despite the images seeming like two
different letters. Figure 3’s right side is the rotated
form of 3. Although the letter name and label are the
same in 3 they are not the same on the right side. If
the augmented data were used in the network directly,
training would have been done with data where the
label and letter do not match. This situation would
lead to incorrect classification.
Figure 3: Letter:U, Label:U and Letter:C, Label:U.
Turkish Sign Language Recognition Using CNN with New Alphabet Dataset
181

3.4 Pre-Processing
Specifically for this study, we avoided passing the
data through too many filters and doing too much
pre-processing. This was to ensure that the model
works as fast as possible keeping in mind real-time
use cases. Therefore the data has been exposed to a
limited amount of pre-processing. Images were shot
using a variety of different cameras. Therefore the
images consisted of many different sizes. CNN which
is most commonly used in computer vision and used
in this research work best with same-size images in
the training process(LeCun et al., 1998). Accordingly,
all data have been reshaped to 64x64. After that, the
resized images were normalized by dividing them by
the highest value pixel of 255.
4 CONVOLUTION NEURAL
NETWORK AND
ARCHITECTURE
4.1 Our CNN Architecture
CNN-based models have been very successful in im-
age recognition tasks. Sign language translation from
images is perfectly suited for using CNN which is a
combination of 3 architectural components which are
local receptive field, shared weight, and sub-sampling
(assume some degree of shift, scale, and distortion in
variance)(LeCun et al., 1995).
The core building block of CNN architectures is
a convolution layer. This layer performs feature ex-
traction with a combination of linear and nonlinear
operations(Yamashita et al., 2018). Convolution per-
forms a dot product between two matrices and sums all
the outputs then as a result of this operation, a feature
map is created. This procedure is applied to all of the
input matrices. One of the two previously mentioned
matrices is known as a kernel, the other matrix is a set
of learnable parameters. The kernel’s size is smaller
than an image but is more in-depth. This means that
if the input image consists of three channels (RGB),
although the kernel’s size is smaller, the depth extends
up to three channels.
CNN has been used for feature extraction in this
research. We created a new CNN architecture specific
to this research because it is a unique problem within
computer vision research. Our aim in creating a new
architecture was to create an architecture that is as
appropriate as possible to the dataset. In this way, we
aimed to increase accuracy(Shin et al., 2019).
Firstly, we tried a lot of different architectures for
our custom dataset. We also employed many methods
such as increasing and decreasing the number of con-
volution layers, changing hyperparameters and trying
different optimizers also error functions were applied
while creating our architecture. You can examine the
experimental models in the experiment section. Our fi-
nal architecture comprises seventeen layers, not count-
ing the input layer. Among the seventeen layers, 4
are convolution layers, 5 are normalization layers, 3
are pooling layers, and the last 5 are fully connected
layers. Convolution layers respectively have 32 filters
3x3 kernel size, 64 filters 3x3 kernel size, 128 filters
3x3 kernel size, and finally 256 filters and again 3x3
kernel size. The reason we keep the kernel size as
small as 3x3 is because we keep the input vector at a
small size like 64x64x3. Additionally, we set stride as
2 and the padding parameter to ’same’ in the pooling
layer.
We chose all activation functions as ReLU except
the one in the fully connected layer. As the network
structure gets deeper this makes models that can learn
very complex relationships between inputs. This cre-
ates a model that during training, works very well for
training data but does not show the same performance
in test data. This situation is defined as over-fitting.
Finally, we used the batch-normalization layer to help
prevent over-fitting of our created model(Ioffe and
Szegedy, 2015a).
5 EXPERIMENTAL SETUP
After the network architecture was designed, the train-
ing stage was started. The architecture created at this
stage is trained with the custom dataset. During the
training phase, many error functions and optimizers
were tried and many parameters have been fine-tuned.
While selecting the loss function for the created
network, experiments were made with many functions.
These functions are MSE (Mean Squared Error), cate-
gorical cross-entropy, and KL (Kullback-Leibler) di-
vergence. We got the best performance with KL di-
vergence. That’s why KL divergence was chosen as
the loss function. As the optimizer, experiments were
made with Adam, SGD (Stochastic Gradient Descent),
and others. Based on the results of the experiments
optimizer Adam was chosen for this research. For
learning rate, which is another important parameter,
has been tested by decreasing 0.002 at each step from
0.01 to 0.001. As a result, 0.002 was chosen as the
learning rate for the network. And finally, early stop-
ping was used to minimize the over-fitting. There are a
lot of techniques for fighting the over-fitting(Fahlman
VISAPP 2023 - 18th International Conference on Computer Vision Theory and Applications
182
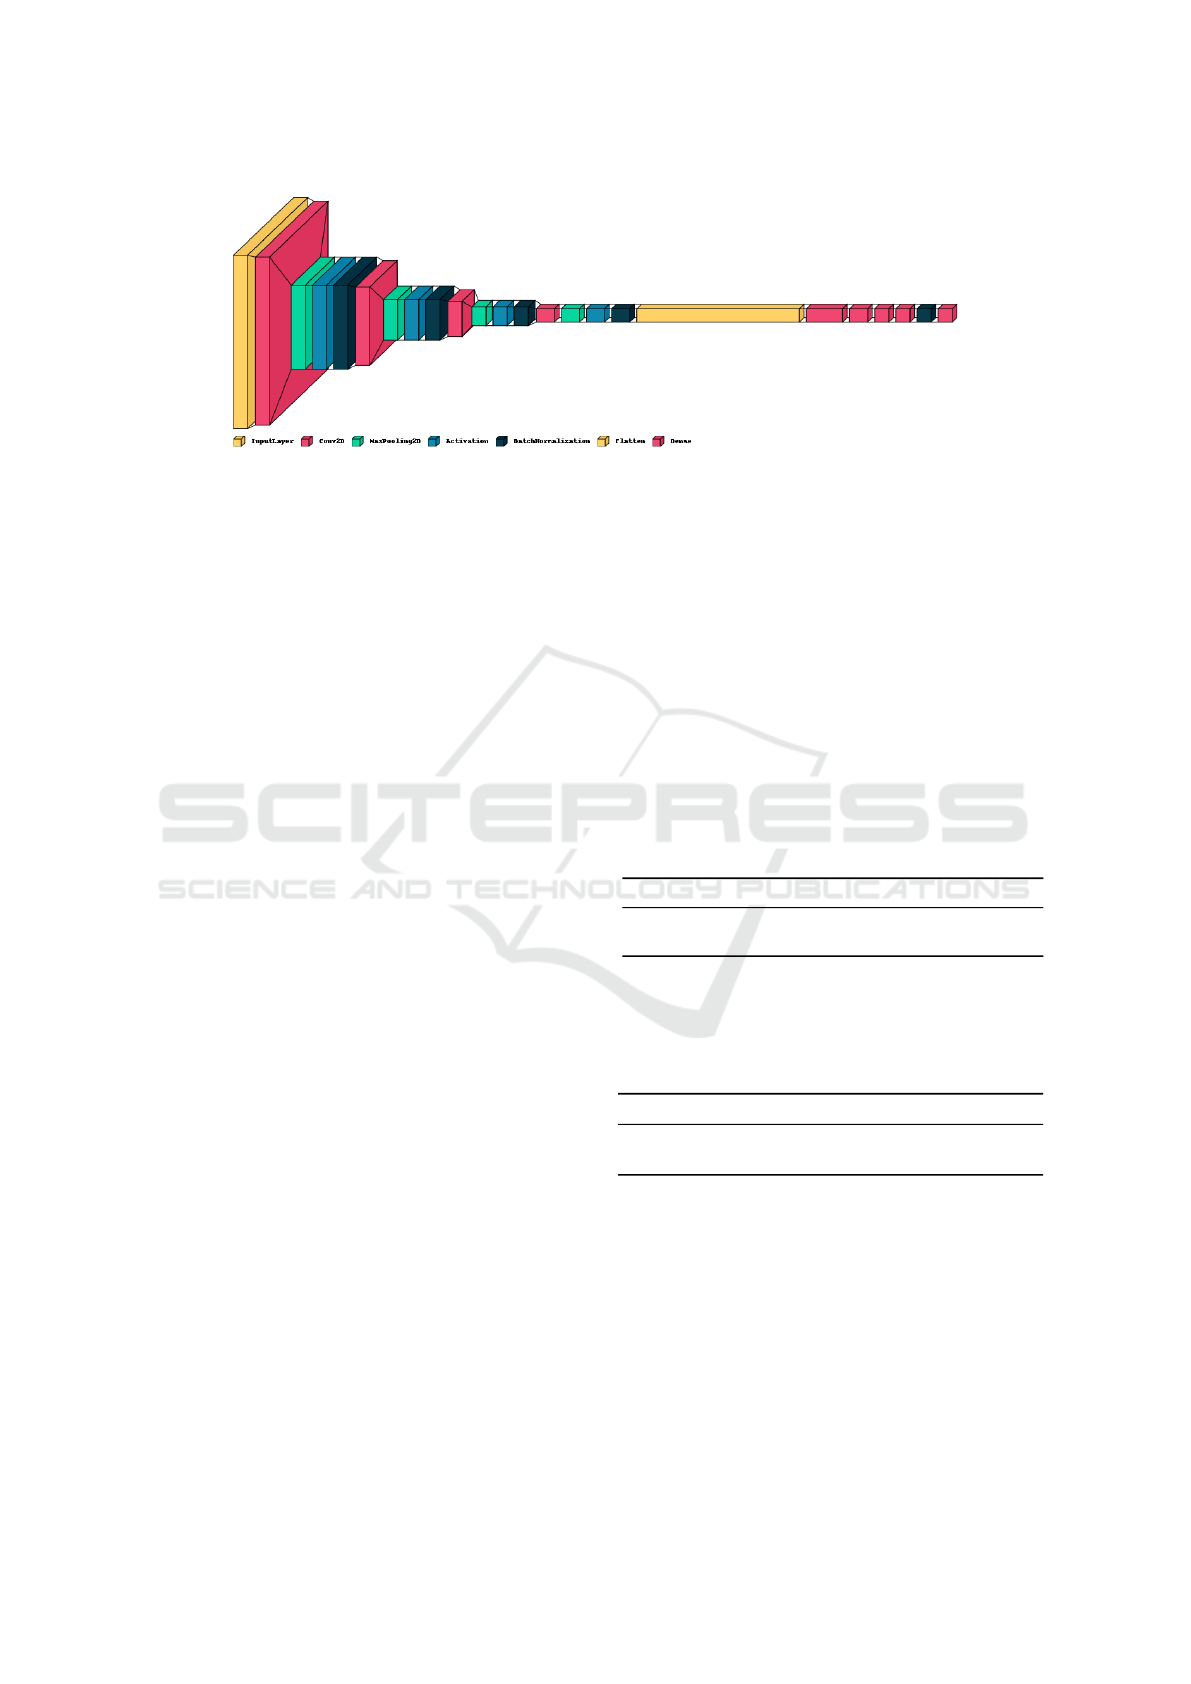
Figure 4: Our CNN Architecture.
and Lebiere, 1990; Krogh and Hertz, 1992; Weigend
et al., 1991; LeCun et al., 1990). The reason for choos-
ing early stopping is because it is simple to implement
and understand(Prechelt, 1998).
5.1 Training
We tried a lot of parameters and different size layers.
We created a lot of networks with different layers and
parameters. 99.5% accuracy has been achieved with
this neural network. Although the network does not
have a complex structure, better results were obtained
than in other studies. When designing a new network
and training we focused on two fundamentals:
•
Network was specifically designed to run in real-
time on the basic processor
•
It had to be effective for TSL letter prediction even
though it has a simple design
For the first item, a network of 23 layers was de-
signed and mentioned in detail in Section 4.2. We have
a different approach in the second item. Looking at
the other studies in this area, usually, the classification
layer comes after dense layers(Pigou et al., 2014; Wad-
hawan and Kumar, 2020; Rao et al., 2018a; Goswami
and Javaji, 2021). In this study, however, a different
approach was used. This approach is based on the
importance of the last layer before classification. The
idea is that if the features extracted by the network
are regularized before the classification layer, more
effective conclusions will be made because the classi-
fication is determined according to this layer’s output.
Based on this insight, batch normalization was added
before classification. The reason for choosing batch
normalization is that gamma and beta parameters are
learnable. These parameters are recalculated with the
derivatives in the backward pass.
Several experiments have been conducted to test
this intuition. First, features are used for classification
obtained by adding and removing the batch normaliza-
tion layer before the output is examined. These feature
values are visualized in Figure 5 As mentioned in the
batch-normalization article(Ioffe and Szegedy, 2015b),
most features are damped when batch normalization
is not used. This means that the classification process
classifies with fewer features. This can cause over-
generalization. Considering Figure 5, it is deduced that
this insight may be correct although it is not certain. If
this intuition is correct then it should produce worse
results when the batch normalization layer before the
classification layer is removed. This experiment was
performed by first removing all normalization layers,
then removing only the last normalization layer, and
finally removing none. The results of the experiment
are in Table 1. Each process was repeated 5 times. To
Table 1: Results.
REMOVED NRM. ACC.MEAN LOSS MEAN STD
ONLY LAST 0.9563% 0.22% 2.543
NONE REMOVED 0.9953% 0.0251% 0.03
prove our claim in item 2, our proposed network and
pre-trained VGG19 were compared and tested under
the same conditions. Considering the testing results2,
Table 2: Pretrained VGG19 vs. Proposed Network.
NETWORK TRAIN MEAN TEST MEAN
VGG19 0.9954% 0.9880%
PROPOSED NETWORK 0.9970% 0.9901%
our proposed network is slightly better under the same
conditions.
5.2 Testing
Figure 6 consists of the Grad CAM for each layer
of the input and their sum. Conv.+ max-pooling +
activation + batch normalization is called a block and
each column in the Figure 6 represents a block. In the
rows, the effect of the same operation on the image can
be seen as the network gets deeper. As can be clearly
Turkish Sign Language Recognition Using CNN with New Alphabet Dataset
183
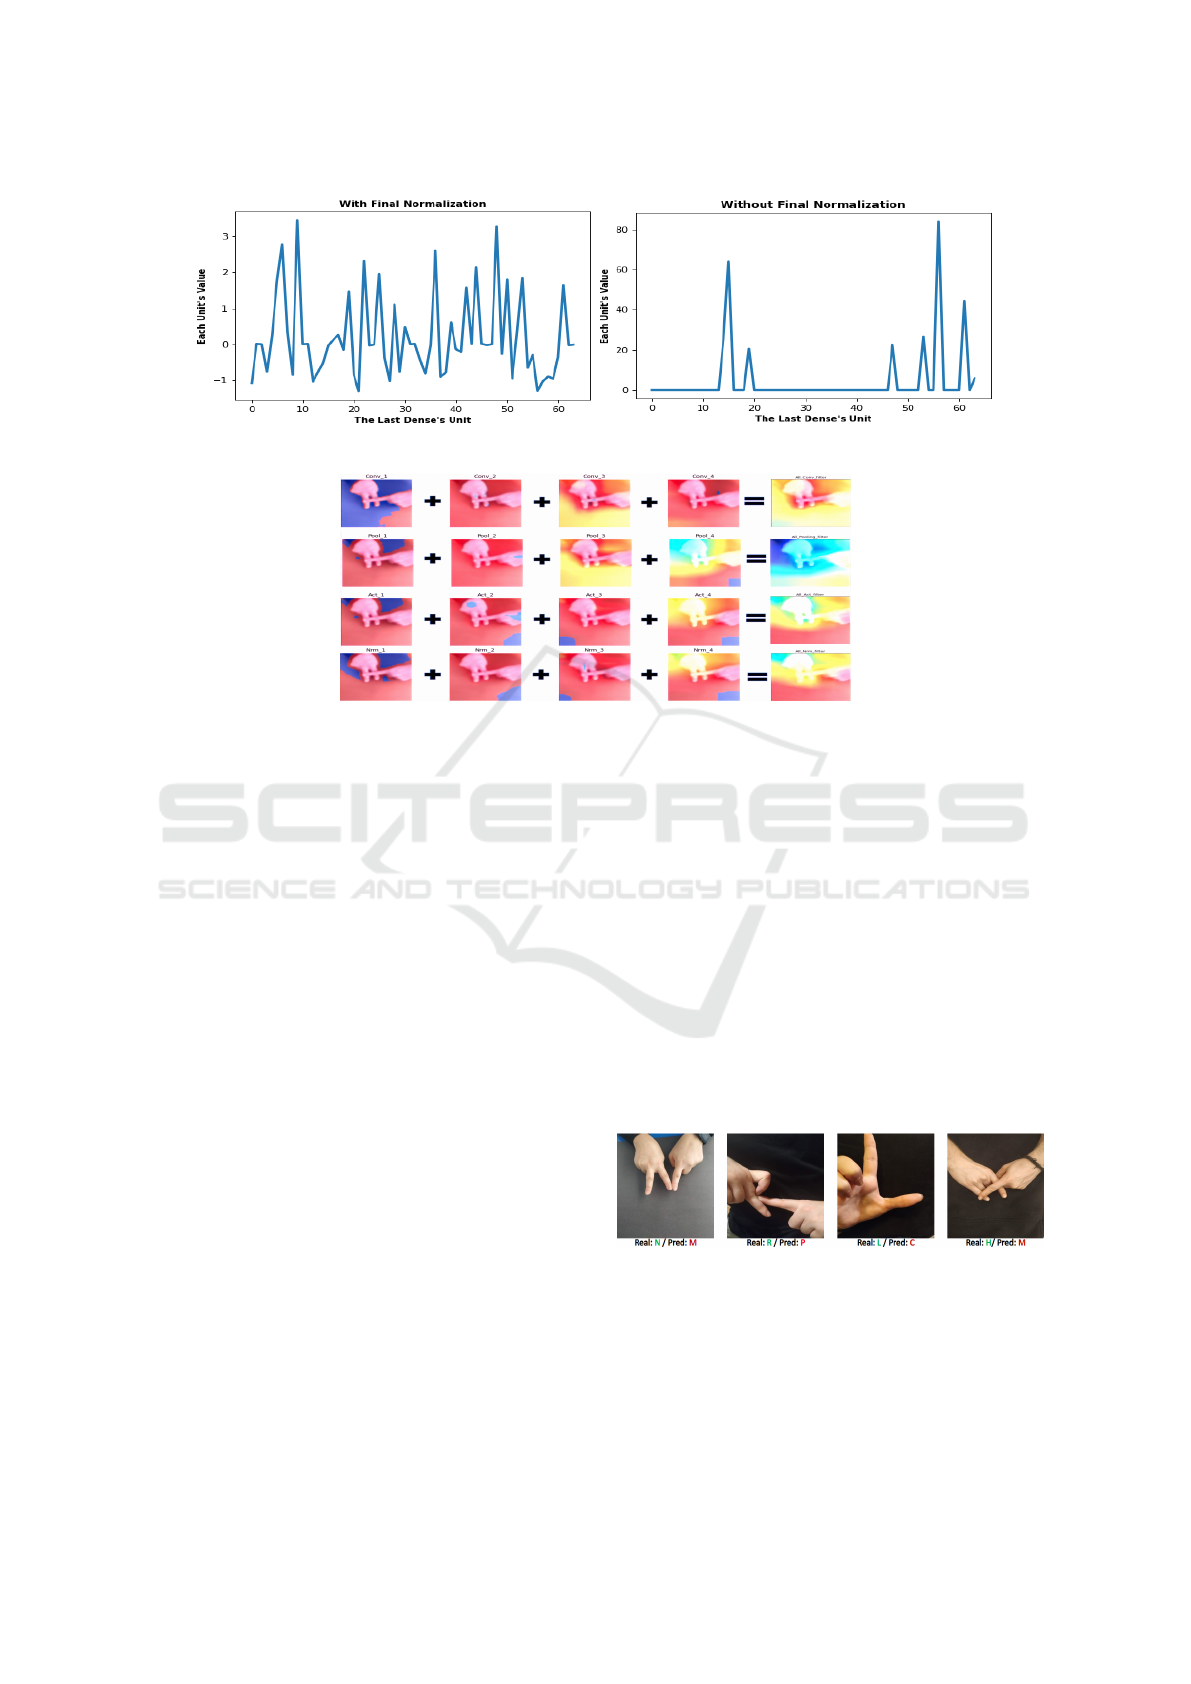
Figure 5: Feature Outputs The Last Dense Layer.
Figure 6: Output of each layer’s Grad CAM.
seen in Figure 6, the network is concentrated on the
hand.
On the trained network, which is seen to concen-
trate on the hand in Figure 6, the test process was
carried out by taking 20% of the total data at a time.
20% of the data corresponds to 5422 samples. Since
20% is taken for the test each time, as mentioned be-
fore the process is repeated 5 times.
The accuracy of the test is 99.9%. In addition to
this, since our dataset is not evenly distributed for each
sample, the data has also been tested for F1 score and
this score is 99.9% ..
The training network has performed pretty well in
both of accuracy and F1 score. When the false predic-
tions were examined, it is seen that this prediction’s
labels are mostly L, R, N and, rarely E, H, and, C
which has been concluded that the custom dataset in-
cludes differently angled images so that false predicted
letters seem like another letters. In addition, the rep-
resentation of some sign of letters are pretty difficult
like P, R, K, etc. This situation is a major challenge in
the data training and collection part.
While testing with data of 5442 samples, the pro-
posed network gave 5 false predictions. 4 of these are
shown in Figure 7. False positive predicted letters are
considered to be confused with other similar letters.
In addition, they have been collected from a different
angle, which may cause false positive predictions.
Finally, the proposed network was retrained with
other data sets, and the results were compared with
other studies in the literature. Unfortunately, since
there is no open-source TSL dataset, the model
could not be tested on a different Turkish dataset.
Two different datasets from other languages were
selected for comparison. These two datasets are
ASL dataset(Pugeault and Bowden, 2011)(mixed back-
ground and MU HandImage dataset(Barczak et al.,
2011)(basic background). ASL dataset built by
Pugeault and contains 24 of 26 alphabets except
for j and z since both of them are dynamic signs.
The dataset contains over 500 samples of each sign,
recorded from 4 different people. MU HandImage
dataset contains 2425 images of 5 individuals. The
two datasets were retrained with the proposed network
and compared to the other study. The results were
added to the table.
Figure 7: Misclassified images and their real and predicted
values.
Considering the tables, we can observe that a bet-
ter result was obtained from compared studies using
these two datasets. State-of-the-art results have been
achieved with the proposed network.
VISAPP 2023 - 18th International Conference on Computer Vision Theory and Applications
184
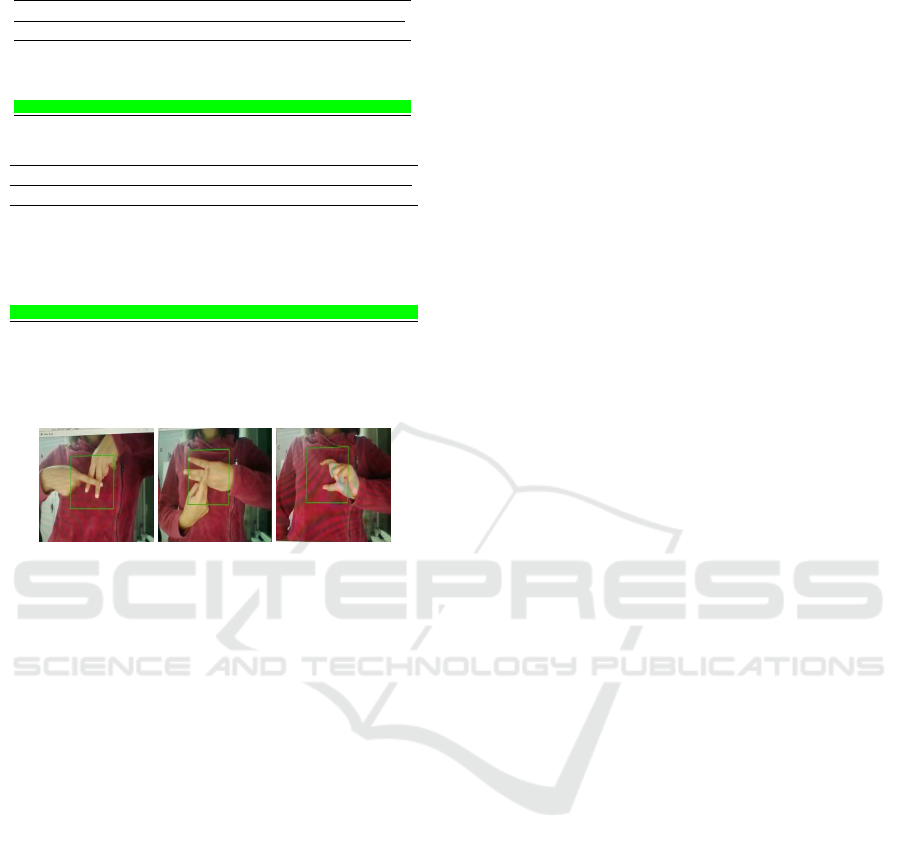
Table 3: Testing with ASL and MU HandImage Dataset.
Testing Model over ASL dataset(Pugeault and Bowden, 2011)
Model Name Accuracy Rate
Pugeault et al.(Pugeault and Bowden, 2011) 75%
Zhang et al.(Zhang et al., 2013) 98.90%
Shao-Zi Li et al.(Li et al., 2015) 97.34%
Keskin et al.(Keskin et al., 2012) 97.80%
Proposed Model 99.7%
Table 4: Testing with MU HandImage Dataset.
Testing over MU HandImages ASL dataset(Barczak et al., 2011)
Model Name Accuracy Rate
AlexNet 91.54%
SUNY deepCNN 78.46%
Stanford deepCNN(Garcia and Viesca, 2016) 72.0%
Rao deepCNN(Rao et al., 2018b) 92.88%
RF-JA+C(Dong et al., 2015) 90.0%
ESF-MLRF(Kuznetsova et al., 2013) 87%
Das P. et al.(Das et al., 2020) 94.3%
Proposed Model 99.35%
6 REAL-TIME TESTING
Figure 8: Real-time testing with respectively, A, E, and C
signs.
In our real-time test using dark clothes, the time our
network takes to classify is about 0.42(for 200 sam-
ples) seconds, and again, it has a success rate of around
80
%
. In general, when dynamic data that we do not
include in our dataset, the network makes an incorrect
definition.
7 RESULTS
In this study, the first Turkish sign language alphabet
dataset is presented as open-source. A CNN-based
network we offer is trained with this data. Although
the presented architecture is small, it has been claimed
to be effective and to prove this, it has been compared
with VGG-19 and achieved relatively better results.
The model we presented was tested in real-time and
achieved an accuracy of 80%. In trials with our own
dataset, around 99.9%, on other datasets (ASL etc.)
we get better results than many models. Its real-time
success is this. In future studies, we plan to prepare
a real-time system with the TSL letters with complex
backgrounds and combine it with the TSL words.
ACKNOWLEDGEMENTS
This research was supported by TUB
˙
ITAK 2209-A Re-
search Supporter Project. Special thank you to Deep-
Mind Company and the 30 volunteers who volunteered
to provide data.
REFERENCES
Turkish statistical institute. "https://data.tuik.gov.tr". "Ac-
cessed: 2021-03-10".
Turkish statistical institute. "https://data.tuik.gov.tr". "Ac-
cessed: 2021-03-10".
World healty organization. "https://www.who.int". "Ac-
cessed: 2021-03-10".
Barczak, A., Reyes, N., Abastillas, M., Piccio, A., and Sus-
njak, T. (2011). A new 2d static hand gesture colour
image dataset for asl gestures.
Bukhari, J., Rehman, M., Malik, S. I., Kamboh, A. M., and
Salman, A. (2015). American sign language transla-
tion through sensory glove; signspeak. International
Journal of u-and e-Service, Science and Technology,
8(1):131–142.
Das, P., Ahmed, T., and Ali, M. F. (2020). Static hand
gesture recognition for american sign language using
deep convolutional neural network. In 2020 IEEE
Region 10 Symposium (TENSYMP), pages 1762–1765.
IEEE.
Dong, C., Leu, M. C., and Yin, Z. (2015). American sign
language alphabet recognition using microsoft kinect.
In Proceedings of the IEEE conference on computer
vision and pattern recognition workshops, pages 44–
52.
Escalera, S., Baró, X., Gonzalez, J., Bautista, M. A., Madadi,
M., Reyes, M., Ponce-López, V., Escalante, H. J., Shot-
ton, J., and Guyon, I. (2014). Chalearn looking at
people challenge 2014: Dataset and results. In Euro-
pean Conference on Computer Vision, pages 459–473.
Springer.
Fahlman, S. E. and Lebiere, C. (1990). The cascade-
correlation learning architecture. Technical report,
CARNEGIE-MELLON UNIV PITTSBURGH PA
SCHOOL OF COMPUTER SCIENCE.
Garcia, B. and Viesca, S. A. (2016). Real-time american
sign language recognition with convolutional neural
networks. Convolutional Neural Networks for Visual
Recognition, 2:225–232.
Goswami, T. and Javaji, S. R. (2021). Cnn model for ameri-
can sign language recognition. In ICCCE 2020, pages
55–61. Springer.
Haberdar, H. and Albayrak, S. (2005). Real time isolated
turkish sign language recognition from video using hid-
den markov models with global features. In Yolum, p.,
Güngör, T., Gürgen, F., and Özturan, C., editors, Com-
puter and Information Sciences - ISCIS 2005, pages
677–687, Berlin, Heidelberg. Springer Berlin Heidel-
berg.
Turkish Sign Language Recognition Using CNN with New Alphabet Dataset
185

Hasan DIKYUVA, Bahtiyar MAKAROGLU, E. A. (1995).
Turkish Sign Language Manual for Adults. Turkish
Ministry of Education, Ankara (1995). Ankara.
Ioffe, S. and Szegedy, C. (2015a). Batch normalization: Ac-
celerating deep network training by reducing internal
covariate shift. In International conference on machine
learning, pages 448–456. PMLR.
Ioffe, S. and Szegedy, C. (2015b). Batch normalization: Ac-
celerating deep network training by reducing internal
covariate shift. In International conference on machine
learning, pages 448–456. PMLR.
Keskin, C., Kiraç, F., Kara, Y. E., and Akarun, L. (2012).
Randomized decision forests for static and dynamic
hand shape classification. In 2012 IEEE Computer
Society Conference on Computer Vision and Pattern
Recognition Workshops, pages 31–36.
Krogh, A. and Hertz, J. A. (1992). A simple weight decay
can improve generalization. In Advances in neural
information processing systems, pages 950–957.
Kuznetsova, A., Leal-Taixé, L., and Rosenhahn, B. (2013).
Real-time sign language recognition using a consumer
depth camera. In Proceedings of the IEEE interna-
tional conference on computer vision workshops, pages
83–90.
LeCun, Y., Bengio, Y., et al. (1995). Convolutional networks
for images, speech, and time series. The handbook of
brain theory and neural networks, 3361(10):1995.
LeCun, Y., Bottou, L., Bengio, Y., and Haffner, P. (1998).
Gradient-based learning applied to document recogni-
tion. Proceedings of the IEEE, 86(11):2278–2324.
LeCun, Y., Denker, J. S., and Solla, S. A. (1990). Opti-
mal brain damage. In Advances in neural information
processing systems, pages 598–605.
Li, S.-Z., Yu, B., Wu, W., Su, S.-Z., and Ji, R.-R. (2015).
Feature learning based on sae–pca network for human
gesture recognition in rgbd images. Neurocomputing,
151:565–573.
Mercanoglu, O. and Keles, H. (2020). Autsl: A large scale
multi-modal turkish sign language dataset and baseline
methods. IEEE Access, 8:181340–181355.
Nagi, J., Ducatelle, F., Di Caro, G. A., Cire¸san, D., Meier,
U., Giusti, A., Nagi, F., Schmidhuber, J., and Gam-
bardella, L. M. (2011). Max-pooling convolutional
neural networks for vision-based hand gesture recogni-
tion. In 2011 IEEE International Conference on Signal
and Image Processing Applications (ICSIPA), pages
342–347.
Oz, C. and Leu, M. C. (2011). American sign language
word recognition with a sensory glove using artificial
neural networks. Engineering Applications of Artificial
Intelligence, 24(7):1204–1213.
Park, J.-J. and Kwon, C.-K. (2021). Korean finger num-
ber gesture recognition based on cnn using surface
electromyography signals. Journal of Electrical Engi-
neering & Technology, 16(1):591–598.
Pigou, L., Dieleman, S., Kindermans, P.-J., and Schrauwen,
B. (2014). Sign language recognition using convolu-
tional neural networks. In European Conference on
Computer Vision, pages 572–578. Springer.
Prechelt, L. (1998). Early stopping-but when? In Neural
Networks: Tricks of the trade, pages 55–69. Springer.
Pugeault, N. and Bowden, R. (2011). Spelling it out: Real-
time asl fingerspelling recognition. In 2011 IEEE In-
ternational conference on computer vision workshops
(ICCV workshops), pages 1114–1119. IEEE.
Rao, G. A., Syamala, K., Kishore, P., and Sastry, A. (2018a).
Deep convolutional neural networks for sign language
recognition. In 2018 Conference on Signal Processing
And Communication Engineering Systems (SPACES),
pages 194–197. IEEE.
Rao, G. A., Syamala, K., Kishore, P., and Sastry, A. (2018b).
Deep convolutional neural networks for sign language
recognition. In 2018 Conference on Signal Processing
And Communication Engineering Systems (SPACES),
pages 194–197. IEEE.
Shin, H., Kim, W. J., and Jang, K.-a. (2019). Korean sign
language recognition based on image and convolution
neural network. In Proceedings of the 2nd Interna-
tional Conference on Image and Graphics Processing,
pages 52–55.
Van den Bergh, M. and Van Gool, L. (2011). Combining
rgb and tof cameras for real-time 3d hand gesture in-
teraction. In 2011 IEEE workshop on applications of
computer vision (WACV), pages 66–72. IEEE.
Wadhawan, A. and Kumar, P. (2020). Deep learning-based
sign language recognition system for static signs. Neu-
ral computing and applications, 32(12):7957–7968.
Weigend, A. S., Rumelhart, D. E., and Huberman, B. A.
(1991). Generalization by weight-elimination with
application to forecasting. In Advances in neural infor-
mation processing systems, pages 875–882.
Wu, J., Tian, Z., Sun, L., Estevez, L., and Jafari, R. (2015).
Real-time american sign language recognition using
wrist-worn motion and surface emg sensors. In 2015
IEEE 12th International Conference on Wearable and
Implantable Body Sensor Networks (BSN), pages 1–6.
IEEE.
Yamashita, R., Nishio, M., Do, R. K. G., and Togashi, K.
(2018). Convolutional neural networks: an overview
and application in radiology. Insights into imaging,
9(4):611–629.
Zhang, C., Yang, X., and Tian, Y. (2013). Histogram of
3d facets: A characteristic descriptor for hand gesture
recognition. In 2013 10th IEEE International Confer-
ence and Workshops on Automatic Face and Gesture
Recognition (FG), pages 1–8.
VISAPP 2023 - 18th International Conference on Computer Vision Theory and Applications
186
