
Wearable EEG-Based Cognitive Load Classification by Personalized and
Generalized Model Using Brain Asymmetry
Sidratul Moontaha
1 a
, Arpita Mallikarjuna Kappattanavar
1
, Pascal Hecker
1,2
and Bert Arnrich
1 b
1
Digital Health – Connected Healthcare, Hasso Plattner Institute, University of Potsdam, Potsdam, Germany
2
audEERING GmbH, Gilching, Germany
{firstname.lastname}@hpi.de
Keywords:
Wearable EEG, Cognitive Load Classification, Personalized Model, Generalized Model, Brain Asymmetry.
Abstract:
EEG measures have become prominent with the increasing popularity of non-invasive, portable EEG sensors
for neuro-physiological measures to assess cognitive load. In this paper, utilizing a four-channel wearable
EEG device, the brain activity data from eleven participants were recorded while watching a relaxation video
and performing three cognitive load tasks. The data was pre-processed using outlier rejection based on a
movement filter, spectral filtering, common average referencing, and normalization. Four frequency-domain
feature sets were extracted from 30-second windows encompassing the power of δ, θ, α, β and γ frequency
bands, the respective ratios, and the asymmetry features of each band. A personalized and generalized model
was built for the binary classification between the relaxation and cognitive load tasks and self-reported labels.
The asymmetry feature set outperformed the band ratio feature sets with a mean classification accuracy of
81.7% for the personalized model and 78% for the generalized model. A similar result for the models from
the self-reported labels necessitates utilizing asymmetry features for cognitive load classification. Extracting
high-level features from asymmetry features in the future may surpass the performance. Moreover, the better
performance of the personalized model leads to future work to update pre-trained generalized models on
personal data.
1 INTRODUCTION
Cognitive load is a term from cognitive psychology
which refers to the amount of working memory used
in the brain. The ratio of the occupied processing
capability of the working memory and the amount
required by the task can be referred to as cognitive
workload (Hart and Staveland, 1988). Therefore,
identifying a potential cognitive overload is essen-
tial, especially for professionals such as drivers, pi-
lots, medical professionals, emergency workers, and
air traffic control. Furthermore, systems with the abil-
ity to adapt to the user’s cognitive state could improve
work performance and help avoid mistakes.
Additionally, complex cognitive tasks alone or
combined with other factors like time or social pres-
sure can release cortisol resulting in psychological
stress (Reinhardt et al., 2012). Stress can build up
to long-term stress, leading to high blood pressure,
anxiety, anger, helplessness, and reduced resilience
a
https://orcid.org/0000-0001-7509-0088
b
https://orcid.org/0000-0001-8380-7667
(Marschall, 2020). Moreover, some patients suffer-
ing from epilepsy report stress as premonitory symp-
toms or seizure trigger way before the seizure oc-
curs (Moontaha et al., 2020). Across disciplines, re-
searchers are actively working on providing objective
measurement techniques to monitor, predict or detect
stress-related events with the ultimate goal of provid-
ing pre-emptive therapy for these diseases.
For the subjective ratings of the cognitive load, the
Nasa Task Load Index (Nasa-TLX) (Hart and Stave-
land, 1988) is widely used in the literature, and so is
in this work. For the objective load measure, the data-
driven neuro-physiological measures are mostly skin
conductance (Setz et al., 2010), anterior cingulate
cortex signal, blood volume pulse, temperature, and
magnetoencephalography (Chen et al., 2016). The
growing popularity of wearable devices measuring
galvanic skin response (GSR), eye activity, respira-
tion, and electrocardiography activity (ECG) has be-
come increasingly prominent for less obtrusive online
assessment of cognitive load (Verwey andVeltman,
1984; Boucsein, 1992). The review on the mental
state classification provides extensive information on
Moontaha, S., Kappattanavar, A., Hecker, P. and Arnrich, B.
Wearable EEG-Based Cognitive Load Classification by Personalized and Generalized Model Using Brain Asymmetry.
DOI: 10.5220/0011628300003414
In Proceedings of the 16th International Joint Conference on Biomedical Engineering Systems and Technologies (BIOSTEC 2023) - Volume 5: HEALTHINF, pages 41-51
ISBN: 978-989-758-631-6; ISSN: 2184-4305
Copyright
c
2023 by SCITEPRESS – Science and Technology Publications, Lda. Under CC license (CC BY-NC-ND 4.0)
41

the multi-modality used in this domain (Anders and
Arnrich, 2022).
In the past two decades, the measurement of men-
tal states with neuro-physiological activity, particu-
larly EEG measurements, has become quite popular.
One reason being EEG measures electrical correlates
directly from the brain rather than the indirect mea-
surement of other physiological responses initiated by
the brain. Since 1998 (Gevins et al., 1998) until today
(Asif et al., 2019), several publications have shown
that EEG is a viable source of information regard-
ing a person’s cognitive load, by achieving classifi-
cation accuracy of up to 95%. However, these re-
sults are highly dependent on the different number
of EEG channels used, the amount of train and test
data for machine learning (ML), the length and nature
of the tasks performed, time-domain or frequency-
domain features, and personalized or generalized
models (Grimes et al., 2008). Most importantly, very
few of the existing experimental paradigms for cogni-
tive load assessment utilize wearable EEG with four
channels or less (Katmah et al., 2021), (Ahn et al.,
2019), (Fangmeng et al., 2020). Additionally, when it
comes to the dry electrode measurement, even fewer
studies have been found for cognitive load assessment
(Arpaia et al., 2020). Another study using four elec-
trodes to classify stress is limited to detecting per-
ceived stress rather than instantaneous stress (Arsalan
et al., 2019). Therefore, one of the novelties of this
paper is to use a low-cost wearable device with only
four dry electrodes to assess cognitive load in a con-
trolled environment. Eventually, this will help as a
baseline to monitor the user’s cognitive performance
in daily life scenarios.
To detect cognitive load from EEG data, the ex-
traction of spectral components is well-known in
the literature (Ismail and Karwowski, 2020; Longo
et al., 2022). Primarily, band powers from delta (0.5-
4Hz), theta (4-7Hz), alpha (8-12Hz), beta (12-30Hz)
and gamma (30-50Hz) frequency components are ex-
tracted. As such, a promising correlation has been
found between mental fatigue and the power ratio fea-
tures from the different band powers (Borghini et al.,
2014). Theta and alpha features are well-established
features for cognitive load measurement (Antonenko
et al., 2010). The authors found a correlation between
cognitive load and the alpha-to-theta ratios and theta-
to-alpha ratios by applying machine learning methods
(Raufi and Longo, 2022). Frontal alpha asymmetry
(Barros et al., 2022) (Sun et al., 2017) along with the
asymmetry between each frequency band (Ahn et al.,
2019) are also significantly related to the cognitive
load. However, the related work is limited to either
stationary EEG setups and insufficient amounts of dif-
ferent cognitive load tasks (Kutafina et al., 2021), or
fails to investigate on ML algorithms (Negi and Mitra,
2018).
The performance of ML classifiers depends on the
training paradigm and other factors. Using 24 chan-
nels of EEG, (Pang et al., 2021) achieved 75.9% of
classification accuracy for personalized models while
with clinical grade EEG, (Jim
´
enez-Guarneros and
G
´
omez-Gil, 2017) achieved 91% of classification ac-
curacy by developing a generalized model. Another
publication also used a personalized model to esti-
mate cognitive load across affective contexts (M
¨
uhl
et al., 2014) with different classifiers using different
time- and frequency-domain features.
In summary, the contributions of this paper to the
study of cognitive load are:
• The evaluation of cognitive load classifier using
wearable EEG devices with four channels of dry
electrodes to be transferable to daily life cognitive
load measurement.
• Feature extraction and exploration from θ
α,
θ α ratio, and asymmetry features, providing that
the classification performance is higher with the
asymmetry features.
• The comparison of personalized models with gen-
eralized models for different feature sets to state-
of-the-art.
• The correlation between self-report and physio-
logical data by evaluating personalized and gen-
eralized models based on self-reported labels.
The following sections provide an overview of the
study protocol, the classification results, and the con-
clusions of the findings of this paper.
2 MATERIALS AND METHODS
In this paper, an experiment was designed to induce
cognitive load to participants. This section discusses
the materials and methods used in building and eval-
uating this experiment.
2.1 Materials
Data Acquisition: The local ethics committee from
the University of Potsdam approved the experimen-
tal paradigm. Eleven participants (six male and five
female) were recruited for cognitive load measure-
ments. Participants were university students with
Asian or European backgrounds (24 to 34 years, mean
of 28.1 years) and were fluent in either English or
German. To collect EEG data we used the Muse
HEALTHINF 2023 - 16th International Conference on Health Informatics
42
S
1
headband together with the Mind-monitor
2
ap-
plication. The Muse S headband is an unobtrusive
consumer-grade device with four channels TP9, AF7,
AF8, and TP10 following the international 10-20 sys-
tem. While Mind-monitor already offers some sig-
nal processing, we used the four raw EEG signals and
the acceleration data for each axis. The data was col-
lected at the sampling frequency of 256Hz.
Psychopy: We built the experiment in Psychopy
(Peirce et al., 2022) to show the cognitive load stim-
uli, extract the Nasa-TLX questionnaire scores, and
record the timestamps of the start and end of every
step of the experiment. This time tracking allows us
to label the recorded sensor data later. The Psychopy
was developed in the builder view for this experiment.
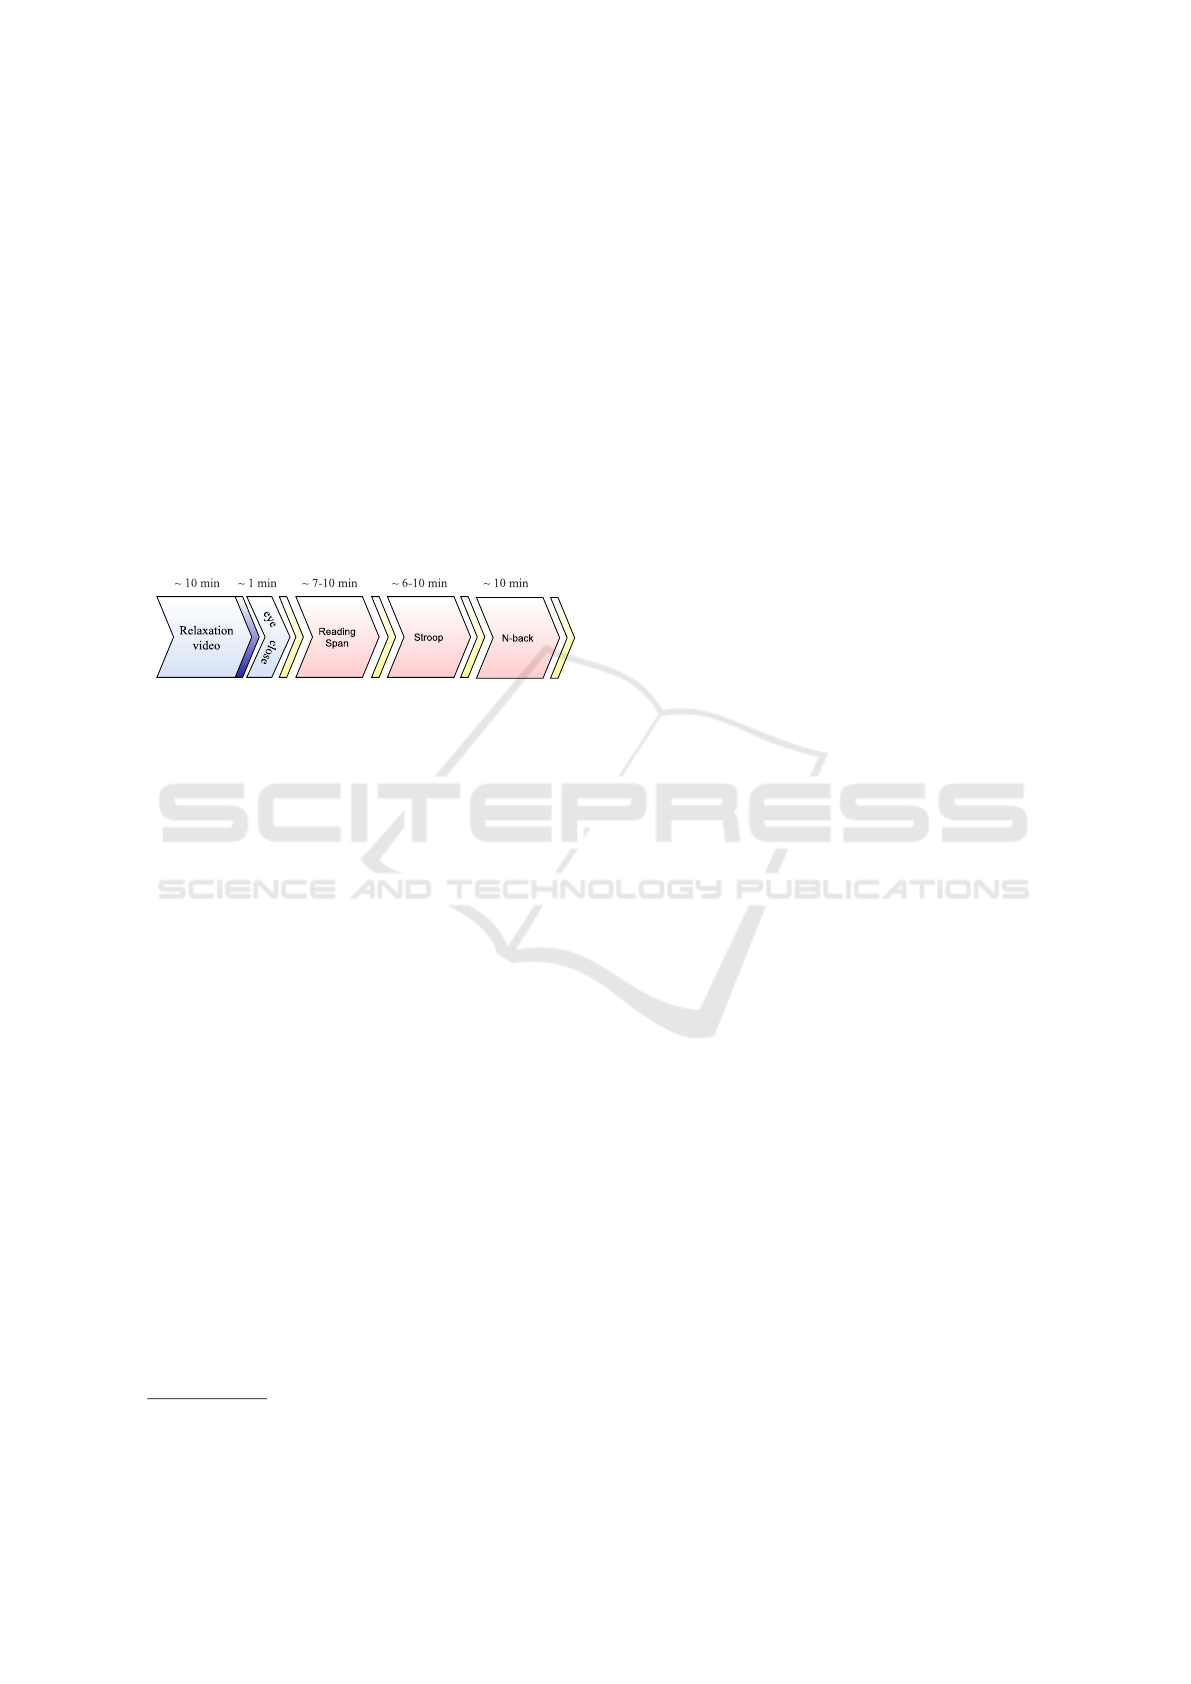
Figure 1: The study protocol followed in this paper. The
three tasks: Reading Span, Stroop, and N-back, were self-
paced. The time range is mentioned above each block. The
yellow bar represents the Nasa-TLX questionnaire. The
dark blue bar represents audio data and another question-
naire which are not relevant for this paper.
Study Protocol: Figure 1 shows the study protocol
in detail. We welcomed the participants in a quiet
room with no external interference. Only one exper-
imenter was present during the experiment sitting on
the opposite side of the participant with no visibil-
ity of the participant’s screen. At the beginning of
the experiment, the participants were asked to sign an
informed consent. Then, we briefed the participant
about the tasks, how to handle the devices, and the
Psychopy platform. The participants’ comfort with
the study environment, e.g., room temperature, seat
height, and computer volume, was ensured. After-
ward, we showed the participant a relaxation video for
10 minutes to record each individual’s baseline. The
participants then closed their eyes and relaxed for 1
minute, which provided a baseline phase to use as a
reference to analyze changes in the EEG signal when
the subject is communicating with the environment,
i.e., subtracting the mean of the baseline from the raw
signal. Next, the participants were asked by us to per-
form the cognitive tasks described below:
1
https://choosemuse.com/muse-s/
2
https://mind-monitor.com/
Reading Span (RS) Task: In the RS task (Task1)
(Stone and Towse, 2015), the participant needed to
read the sentence aloud and answer logical questions
about that task. The participant must remember the
numbers between the reading task and enter the pre-
viously read three numbers when asked in between
the reading task.
Stroop Task: In Stroop Task (Task2) (Stroop,
1935), the participant reads a list of words for colors,
but the words are printed in colors different from the
word itself. For example, the word “orange” would be
listed as text but printed in “green”. The participant’s
reading time of the words on the list is then recorded.
Next, the participant will repeat the test with a new
list of words and name the colors that the words are
printed. So, when the word “orange” is printed in
green, the participant should say “green” and move
on to the next word.
N-back Task: In the N-back task (Task3) (Kane
and Engle, 2002), participants are presented with two
stimuli, one audio and one visual. Participants need
to match the stimulus n trials before. For example, in
a 2-back task, in the audio stimuli, participants have
to decide whether the current audio letter is the same
as the letter in trial n–2. In the visual stimuli, par-
ticipants have to determine whether the current visual
box is in the same position as in trial n–2.
Nasa-TLX: In between the three tasks mentioned,
we prompted the Nasa-TLX questionnaire. The ques-
tionnaire consists of six questions about a previously
finished task to capture the self-assessment of the
task’s mental, physical, and temporal demands and
the overall performance, needed effort, and frustration
level. The participants answered each question on a
visual scale ranging from ”very low” to ”very high,”
which corresponds to 0 and 100, respectively. After-
ward, the participants are asked to weigh each dimen-
sion pairwise, allowing the computation of a weighted
score of the previously answered question. We saved
the individual answers of the different dimensions as
floating-point values between 0 and 100 with their
corresponding weights. The weighted scores and the
corresponding mean score is depicted in table 1
2.2 Methods
The methods followed in the paper are depicted in the
figure 2 and explained as follows.
Wearable EEG-Based Cognitive Load Classification by Personalized and Generalized Model Using Brain Asymmetry
43
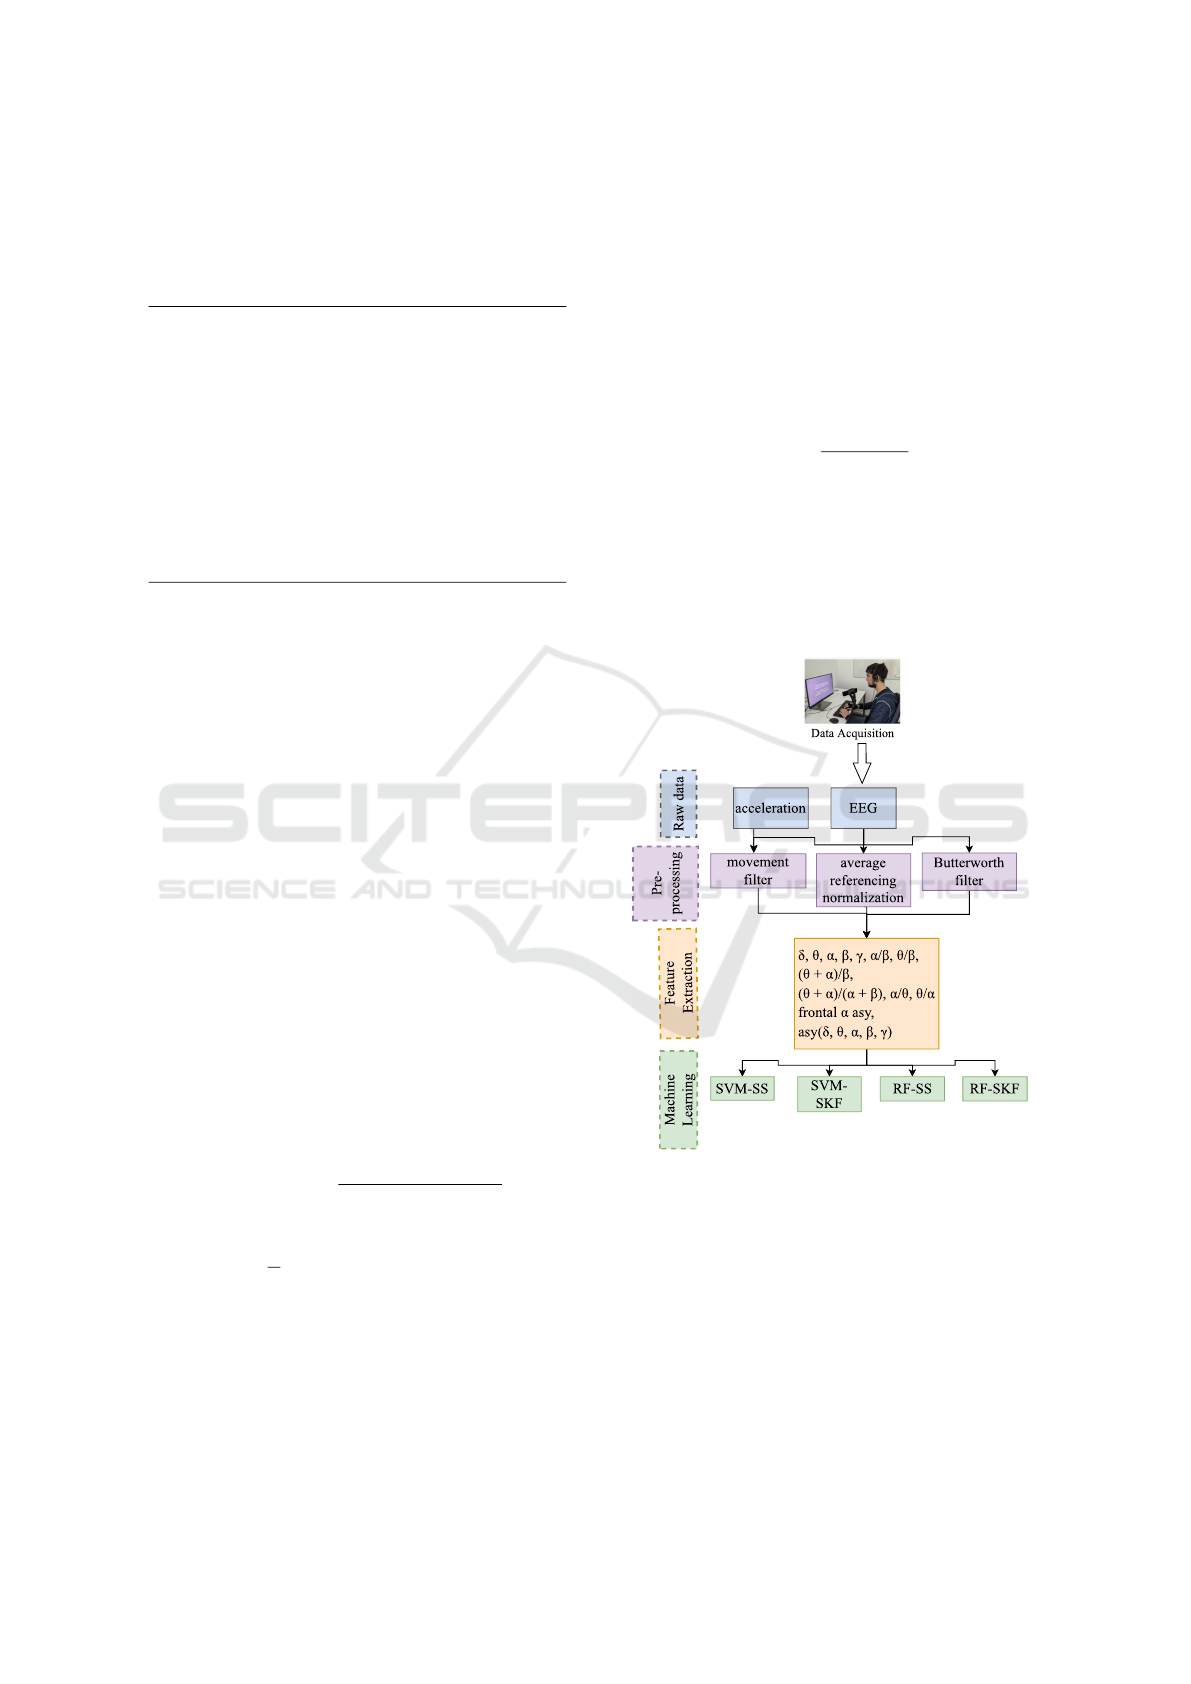
Table 1: Scores from the Nasa-TLX questionnaire (scale
from 0 to 100) for the subjective cognitive load indicated
by each participant. The right-most column indicates mean
score across the three tasks.
Participant ID Task1 Task2 Task3 mean
1 68.47 70.8 50.9 63.39
2 71.5 40.17 86.43 66.03
3 77.47 77.33 84.87 79.89
4 35.67 40.23 38.37 38.09
5 76.5 86.93 81.4 81.61
6 86.2 33.37 58.57 59.38
7 45.37 51.3 67.53 54.73
8 66.17 48.0 47.03 53.73
9 49.4 62.27 70.7 60.79
10 46.97 45.0 45.87 45.94
11 73.4 39.8 65.5 59.57
Filtering: The recorded EEG signals contain phys-
iological artifacts, e.g., eye blinks, eye movements,
head movements, and heartbeats. These raw signals
also contain non-physiological artifacts, e.g., power
line interference, electrode artifacts due to poor elec-
trode placement, and more. Activation of muscles on
the scalp creates high-frequency noise. Additionally,
disturbances like heart activity and the slow change
of electric conductivity of the skin caused by sweat-
ing can create low-frequency noise. Therefore, we ap-
plied a low pass Butterworth filter of the sixth order
at 50 Hz to remove higher-frequency noise and a high
pass filter at 0.5 Hz to remove low-frequency noises.
Movement Filter: To detect and remove the addi-
tional head movement, we used a movement filter us-
ing the acceleration data recorded via Muse S to de-
tect and remove additional noise from the head move-
ment. At first, we applied a high pass filter at 0.5 Hz
and a low pass filter at 20 Hz to remove noise and
the gravitational component of the acceleration sig-
nal. We calculated the overall movement as the square
root of the sum of the squared acceleration magni-
tudes:
movement =
q
Acc
2
X
+ Acc
2
Y
+ Acc
2
Z
.
Then, by visually analyzing the data, we set a fixed
threshold at 20
m
s
2
to remove EEG artifacts due to high
(unwanted) acceleration. When the acceleration data
exceeds the given threshold, we interpolated the EEG
data with the average of the previous and next values
of the given data points.
Normalization: While general patterns of the dif-
ferent features are shared among the participants, the
exact values usually differ for everyone. Therefore,
we performed two steps of normalization. Firstly,
for baseline normalization, we use the one-minute
eye closing session as a baseline measurement. We
calculated the mean of every feature for this period
as a baseline value and subtracted it from the whole
recording for every participant. Secondly, min-max
feature scaling is used by subtracting the minimum
from each feature and dividing by the range of each
feature all the values:
x
scaled
=
x − x
min
x
max
− x
min
.
Common Average Referencing: The EEG data
was average-referenced after filtering, i.e., the over-
all average potential is subtracted from each channel.
This method relies on the statistical assumption that
multichannel EEG recording is uncorrelated and as-
sumes an even potential distribution across the scalp.
Figure 2: The data analysis framework followed in this pa-
per.
Feature Extraction: We segmented the pre-
processed data into 30-second windows with 80%
overlap to extract spectral features. Using Welch’s
method and Hann window function, the power
spectral density (PSD) of the five frequency band
was calculated for each of the four channels. The
mean across the four channels was extracted and
named as δ, θ, α, β and γ features. Additionally,
we have also calculated the ratio of the band powers
HEALTHINF 2023 - 16th International Conference on Health Informatics
44

of α/β, θ/β, (θ + α)/β, (θ + α)/(β + α) from the
mean PSD across the electrodes (Barua et al., 2020).
These ratios were used for detecting fatigue since
an increase in the ratio is a good indicator of EEG
activity compared to individual PSDs (Jap et al.,
2009). Additionally, θ/α and α/θ ratios were also
extracted since these two band ratios are proven as
indexes of mental workload (Raufi and Longo, 2022).
Finally, α power of EEG electrodes AF8 and AF7
was log-transformed, and the asymmetry score of
frontal alpha was calculated by subtracting the value
at AF8 from the value at AF7 (log-transformed
spectral power at AF8 — log-transformed spectral
power at AF7) (Sun et al., 2019). The correlation
between the psychological stress and frontal EEG
asymmetry is an ongoing promising study (Arpaia
et al., 2020). We have also calculated the left and
right hemisphere asymmetry of the brain of the five
band power (log-transformed spectral power of left
hemisphere — log-transformed spectral power of
right hemisphere) (Ahn et al., 2019). The definition
of the features is summarized in table 2.
Table 2: Feature names and the description of the extracted
features from EEG power bands.
Feature name Description
θ α PSD of θ, α
θ α ratio PSD of θ/α, α/θ
asy
asymmetry of frontal α, δ, θ,
α, β, γ
all
PSD of δ, θ, α, β and γ,
θ α, θ α ratio, asy
2.3 Classifier Models
In this paper, we have built a binary classification
models using each feature set mentioned in table 2
to classify between the relaxation baseline and each
of the three cognitive load tasks mentioned above.
We implemented a Support Vector Machine (SVM)
and a Random Forest (RF) classifier in Python us-
ing sklearn
3
. SVM was selected as the most widely
used classifier for mental state detection (Anders and
Arnrich, 2022), whereas Decision trees, e.g., the RF
model was selected with better interpretability and
faster. For both classifiers, we used nested Stratified
K-fold cross-validation (SKF) with K = 8 and Shuffle
Split (SS) cross-validation with 9-splits and test size
of 0.25. Using the four classifiers named as svm-skf,
rf-skf, svm-ss, and rf-ss we developed personalized
and generalized model.
Therefore, for personalized model, in each itera-
3
https://scikit-learn.org/stable/
tion of the SKF, the data of one participant is divided
into 8-folds, where one fold is used for the test and the
rest of them for the train. The train set is again divided
into 8-folds, where one fold is the validation, and the
other is for the train set. For the SS, the data from one
participant is randomly sampled during 9 iterations to
generate test set of 25% of the data of one partici-
pant. The remaining data is again randomly sampled
to generate the validation set of the 25% of the re-
maining data set and rest for the training. For gen-
eralized models, data from all participant was taken
into account while diving into 8-folds and sampling
into test for SKF and SS, respectively.
For both, personalized and generalized models,
we tuned the hyper-parameters of the models to avoid
over-fitting. Using sklearn’s GridSearchCV method,
we defined a grid of hyper-parameter ranges, ran-
domly sampled from the grid, and performed cross-
validation with each combination of values.
For SVM we tuned the Linear kernel with multiple
value of the regularization strength C (0.01, 0.05, 0.1,
0.5, 1, 10, 100, 1000). For the Radial bias kernel
(RBF), we also tuned the γ kernel coefficient and the
regularization parameter C. The parameters were cho-
sen differently for each fold of the iteration for each
participant.
For the tree-based RF classifier, we adjusted the
number of trees (n estimators = 50, 100, 200, 400,
800), minimum number of data points allowed in a
leaf node (min samples leaf = 1, 2, 3, 4, 5, 6), min
number of data points placed in a node before the
node is split (min samples split = 2, 4, 6, 8).
In order to evaluate the classification tasks, we
used the accuracy of the prediction, which is the num-
ber of correctly predicted samples ˆy
true
divided by the
number of all samples ˆy
total
:
accuracy =
ˆy
true
ˆy
total
.
We calculated the mean accuracy over all the folds
for each participant for the personalized model and
displayed only the mean accuracy over all participant.
For generalized model, we showed the mean accuracy
over all the folds.
3 RESULTS
3.1 Feature Exploration
At the beginning of the data analysis, as depicted in
figure 3, we performed feature exploration by cal-
culating the logarithm of the ratio of α band power
(α log ratio) and the negative logarithm of the ratio of
θ band power (θ log ratio) of the baseline relaxation
Wearable EEG-Based Cognitive Load Classification by Personalized and Generalized Model Using Brain Asymmetry
45
session to each of the three cognitive load sessions
mentioned in figure 1. Due to the different lengths of
the relaxation and cognitive load sessions for shorter
sessions, we trimmed the starting of the correspond-
ing sessions because the data points toward the end
are more relevant for mental state detection from the
self-reported labels. Figure 3 shows a total of eleven
participants’ θ log ratio (left) and α log ratio (right)
with the corresponding tasks in different colors. Out
of the 33 sessions across all participants, the positive
θ log ratio and α log ratio for 21 and 25 sessions, re-
spectively, indicates an increase in θ activity and a
decrease in α activity with increasing cognitive load.
These findings are completely aligned with the find-
ings of the neuroscience literature. The visualization
of the α of all the cognitive load sessions consecu-
tively across all participants in figure 4 explains the
negative α log ratio of participant 4 and participant
5. The shorter time window to finish the tasks and
self-report (see table 1) interprets that the designed
tasks were too easy for participant 4 to perform, and
too difficult for participant 5 to give up. Nevertheless,
further investigation is needed for the justification of
the negative α
log ratio for participant 6.
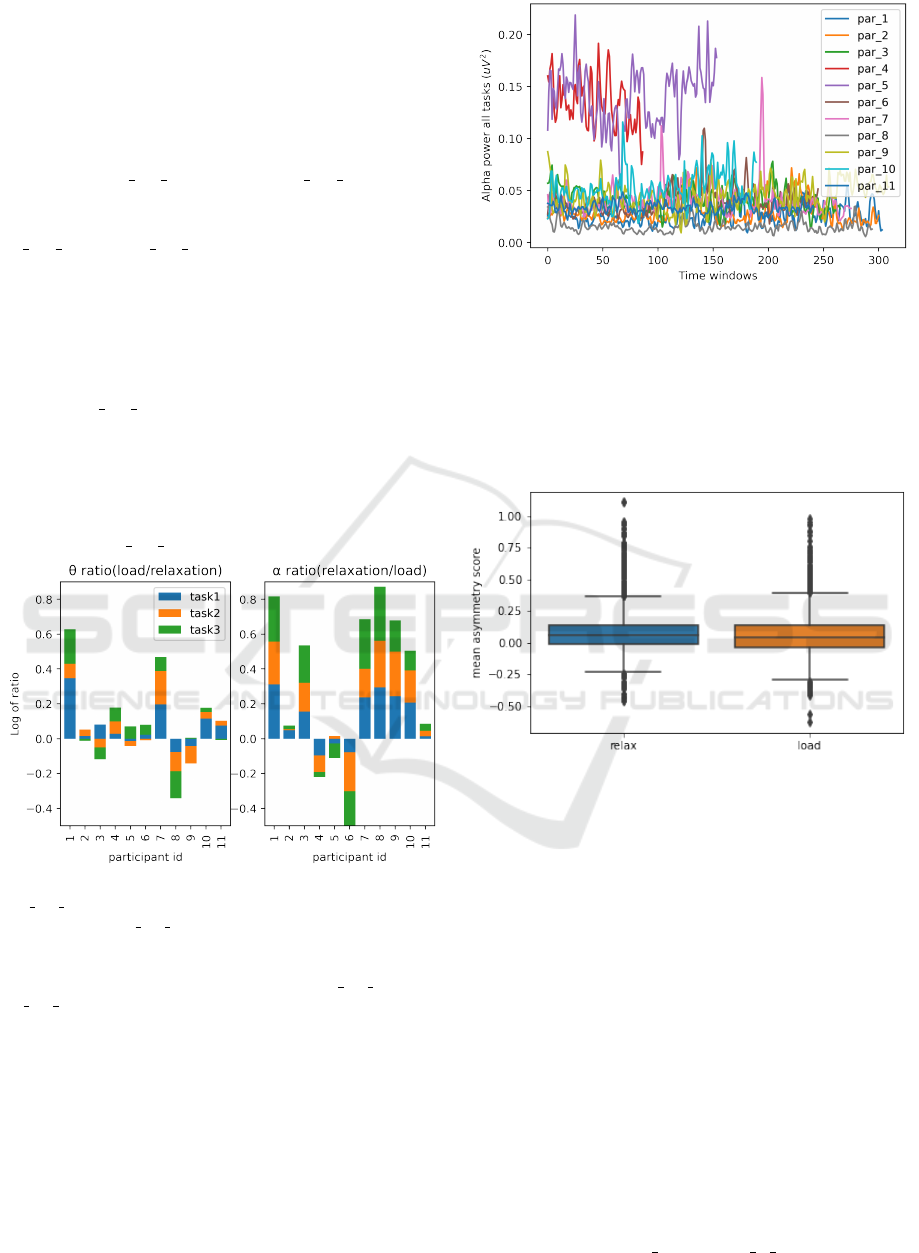
Figure 3: Left: logarithm of the ratio of α band power
(α log ratio) and right: negative logarithm of the ratio of
θ band power (θ log ratio) of the baseline relaxation ses-
sion to each of the three cognitive load sessions is plotted in
the y-axis, whereas x-axis represents each participant. The
color bar represents each task. The positive θ log ratio and
α log ratio depicts the increase of θ activity and decrease
of α activity with the increased cognitive load, respectively.
Figure 5 demonstrates the distribution of the
asymmetry features of the baseline relaxation session
and the all cognitive load session together. The mean
asymmetry score for the relaxation session is higher
by 0.02 than the cognitive load sessions indicating
that the right alpha power was reduced than the left
alpha power under the load condition. The finding is
consistent with the physiological assumptions. How-
ever, no statistically significant difference was found
Figure 4: Alpha power for all participants for all three tasks
consecutively. Participant 4 and participant 5 took shorter
time window to finish the tasks and exhibits higher alpha
power compared to other participants.
between the scores may be due to the imbalanced
data. Nevertheless, as mentioned in the following sec-
tions, the asymmetry features greatly contribute to the
machine learning model.
Figure 5: Mean score of the asymmetry features is plotted in
the y-axis whereas the x-axis indicates the relaxation base-
line session and the cognitive load sessions. The average
of the mean asymmetry score is 0.08 for relaxation session
and 0.06 for cognitive load session.
3.2 Personalized Model
Based on the personalized variations of the extracted
features, so do other brain dynamics and the self-
rating of cognitive load, the first experimental eval-
uation was performed on the personalized model for
the binary classification between relaxation baseline
and each of the cognitive tasks. For every participant,
we applied four different feature sets to SVM and
RF classifiers with both SKF cross-validation with 8-
folds and SS cross-validation with 9-splits and test
size of 0.25. The results depicted in table 3 shows that
for each feature set the SVM classifier with SS cross-
validation performed the best (marked in bold) among
each set of four classifiers. The asymmetry feature
set outperforms the θ α and the θ α ratio feature sets
HEALTHINF 2023 - 16th International Conference on Health Informatics
46
by achieving the the best mean classification accu-
racy of 82% for both task1 and task2, and 81% for
task3, respectively. However, the accuracy increased
by 9%, 7%, and 10% for task1, task2, and task3, re-
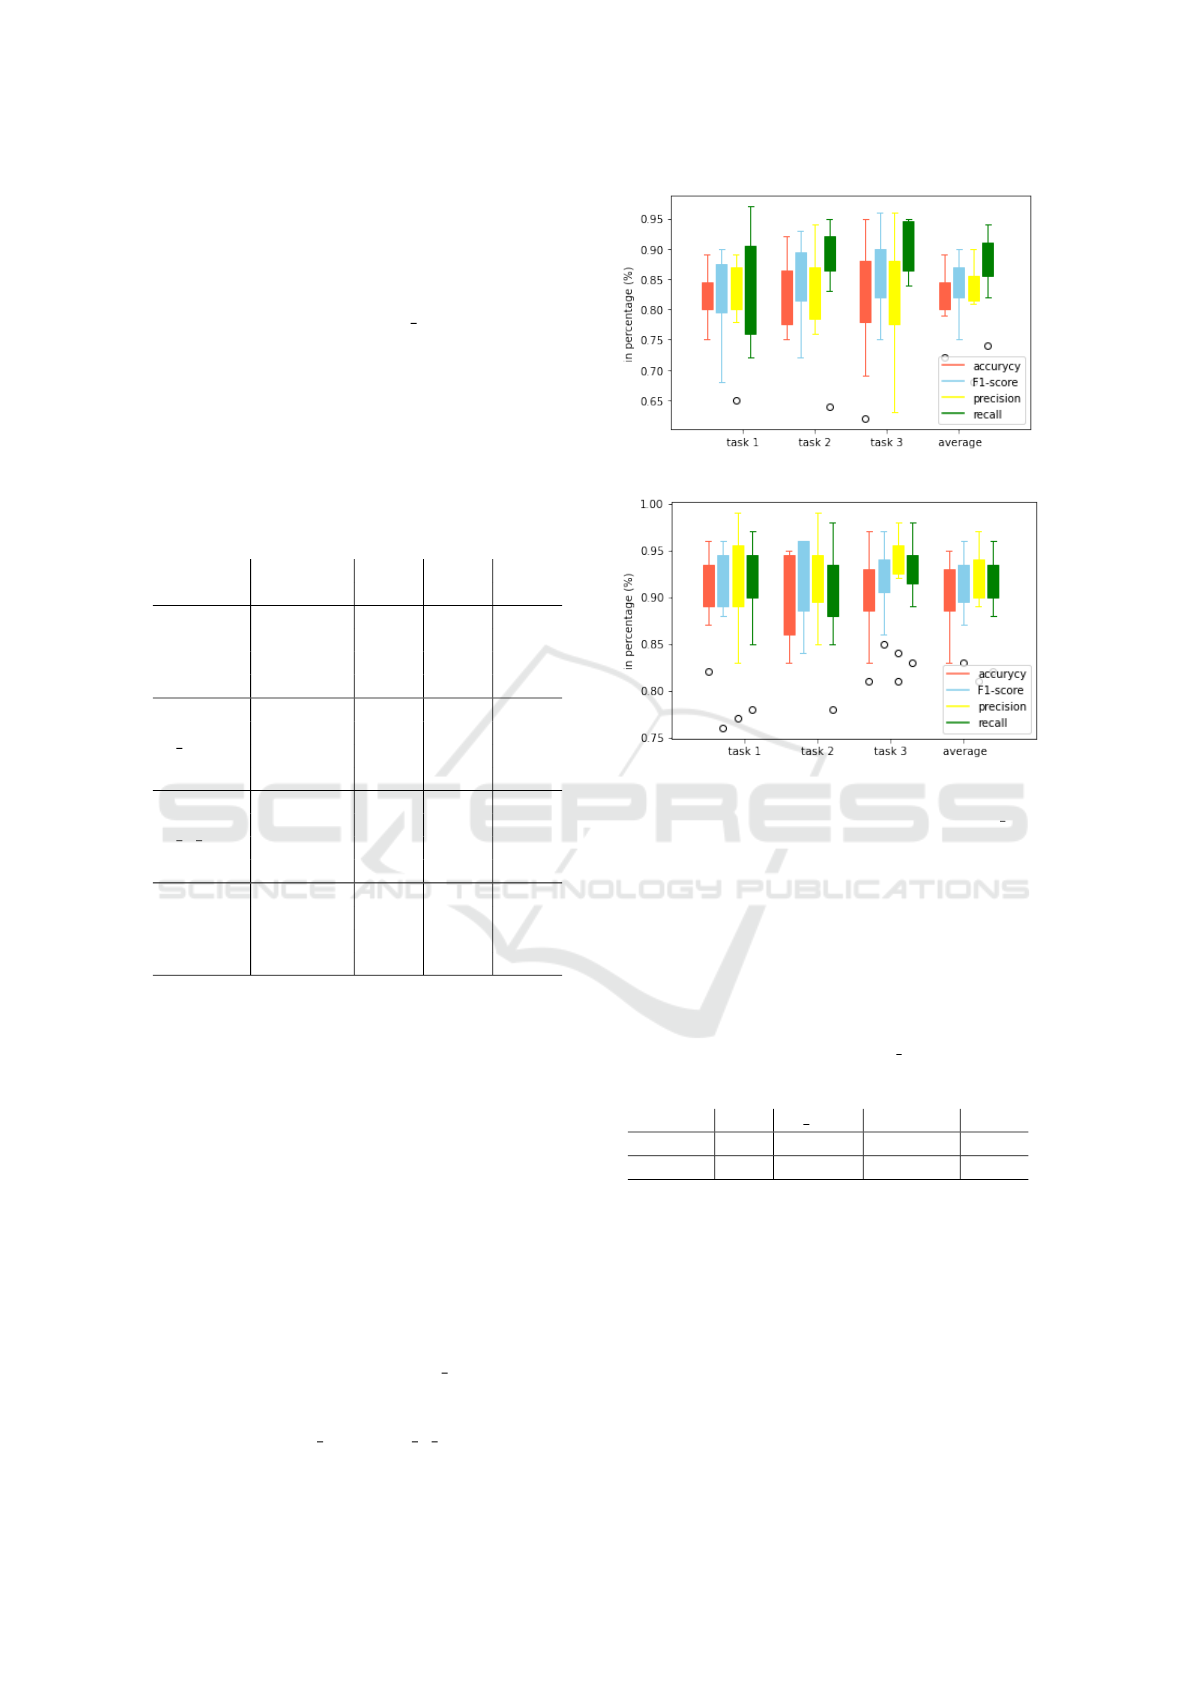
spectively, while using all the feature set. The distri-
bution of test accuracy (red), f1 score (blue), preci-
sion (yellow), and recall (green) over all participants
for the best model, SVM-SS is shown in figure 6 for
both asymmetry features 8a and all the features 8b.
Each block represents each task, and also the right-
most block represents the average.
Table 3: The mean accuracy over all participant results
from a personalized model for each cognitive load task with
respect to the relaxation baseline for SVM and RF using
four feature sets with both the SKF and SS cross-validation.
Features Classifier task1 task2 task3
-cv
all
rf-skf 0.87 0.84 0.84
rf-ss 0.90 0.86 0.88
svm-skf 0.88 0.84 0.85
svm-ss 0.91 0.89 0.91
θ α
rf-skf 0.75 0.72 0.75
rf-ss 0.76 0.73 0.76
svm-skf 0.78 0.73 0.75
svm-ss 0.8 0.73 0.76
θ α ratio
rf-skf 0.7 0.67 0.66
rf-ss 0.73 0.67 0.66
svm-skf - - -
svm-ss 0.75 0.69 0.69
asy
rf-skf 0.78 0.77 0.74
rf-ss 0.82 0.81 0.8
svm-skf 0.79 0.78 0.76
svm-ss 0.82 0.82 0.81
3.3 Generalized Model
The second experimental evaluation was performed to
develop a generalized model by applying mentioned
feature sets in table 2 to create a generalized model
using SKF cross-validation with 8-folds and SS cross-
validation with 9-splits and a test size of 0.25 for both
SVM and RF classifiers for all participants. Figure 7
provides the average accuracy over the three tasks for
all the models which were generated with the respec-
tive cross-validation. Since figure 7 shows that there
is no significant difference between the performance
of the RF-SS and SVM-SS classifier, to maintain the
homogeneity with the personalized model we report
the results from SVM-SS classifier to show the com-
parison between the test accuracy, f1
score, precision
and recall of using asymmetry features and all the fea-
tures in table 4. As indicated, the asymmetry features
surpass both the the θ α and the θ α ratio feature with
(a) asymmetry features
(b) all features
Figure 6: The distribution of test accuracy (red), f1 score
(blue), precision (yellow) and recall (green) over all par-
ticipants is depicted for the best model SVM-SS using a)
asymmetry features and b) all features. Each three task and
their average is shown.
the mean classification accuracy of 78% which coin-
cides with the findings from the personalized model.
Additionally, the classifiers outperforms when all the
feature set is used with the mean accuracy of 88%.
Table 4: Mean of the accuracy (acc), f1 score, precision and
recall of the generalized model using asymmetry features
and all the features.
features acc f1 score precision recall
asy 0.78 0.81 0.79 0.84
all 0.88 0.90 0.86 0.94
3.4 Self-Reported Labels
The third experimental evaluation was performed by
labelling the data as high and low cognitive load by
applying a threshold over the mean of self-reported
Nasa-TLX score from table 1 for each participant. We
developed both personalized model and generalized
model as mentioned in section 3.2 and 3.3, respec-
tively. As illustrated in table 5, the SVM-SS showed
the best accuracy across all the features sets for both
Wearable EEG-Based Cognitive Load Classification by Personalized and Generalized Model Using Brain Asymmetry
47
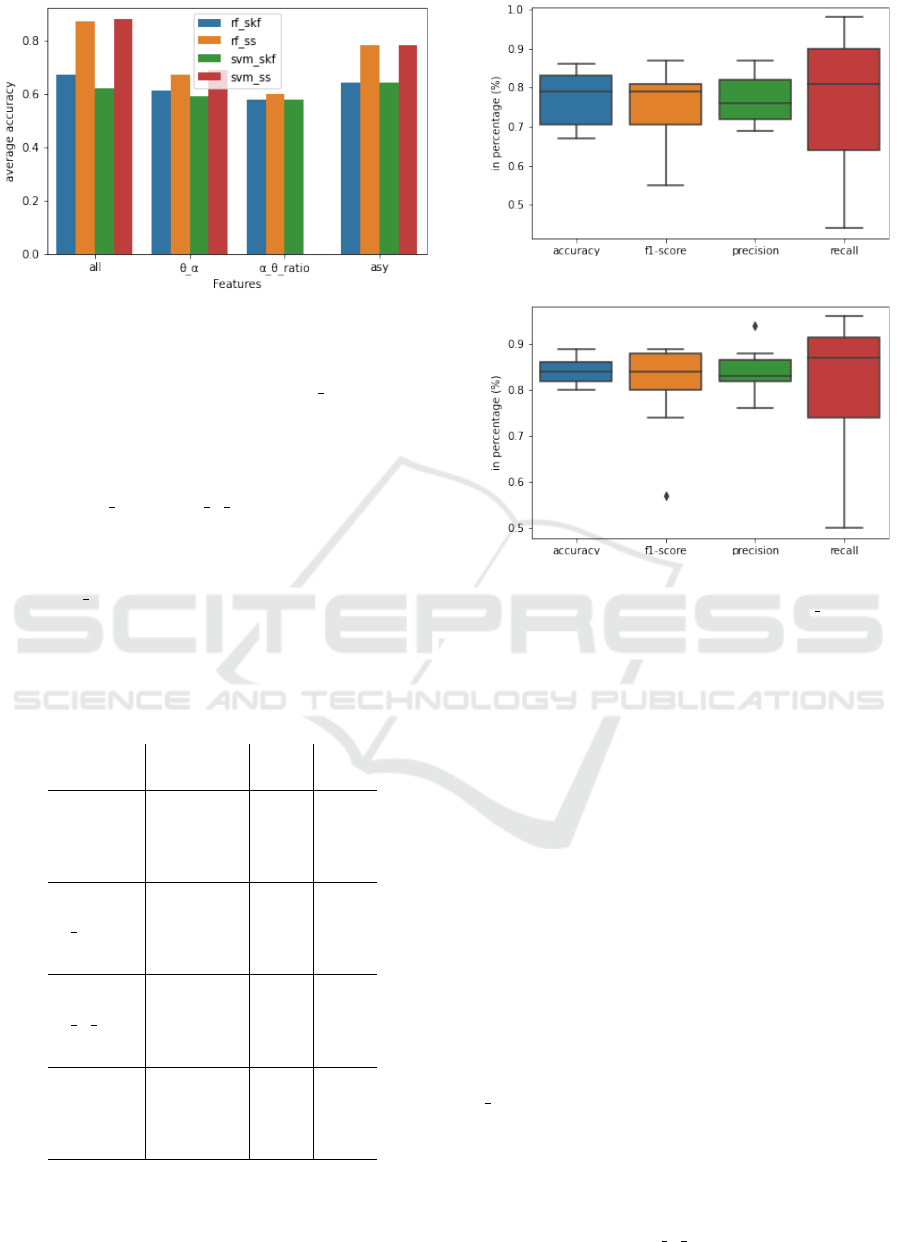
Figure 7: The features (x-axis) and the corresponding mean
classification accuracy over all the tasks (y-axis) is plotted
for all the four classifier.
models. For the personalized model θ α and asym-
metry features provides similar performance of the
model evaluation whereas the model using all the fea-
tures performed better. Furthermore, for the general-
ized model the accuracy barely reached chance level
while using θ α and the θ α ratio features but reached
to 73% using asymmetry features which further in-
creased by 10% while using all the features. The dis-
tribution of the personalized classification accuracy
and the f1
score, precision and recall over all the par-
ticipants is provided in the figure 8.
Table 5: Classification results for personalized and general-
ized model using self-reported labels for the three cognitive
load tasks for SVM and RF classifiers with both the SKF
and SS cross-validation using four feature sets.
Features Classifier Per. Gen.
-CV
all
rf-skf 0.77 0.53
rf-ss 0.83 0.81
svm-skf 0.78 0.52
svm-ss 0.84 0.83
θ α
rf-skf 0.67 0.47
rf-ss 0.69 0.54
svm-skf 0.68 0.48
svm-ss 0.7 0.57
θ α ratio
rf-skf 0.66 0.51
rf-ss 0.66 0.52
svm-skf 0.67 0.52
svm-ss 0.69 0.56
asy
rf-skf 0.77 0.51
rf-ss 0.78 0.73
svm-skf 0.74 0.73
svm-ss 0.77 0.73
(a) asymmetry features
(b) all features
Figure 8: The distribution of test accuracy, f1 score, pre-
cision, and recall over all participants are depicted for the
best model SVM-SS using a) asymmetry features and b) all
features.
4 DISCUSSION
This paper evaluates cognitive load classifiers by ac-
quiring data using wearable EEG devices contain-
ing only four dry electrodes. Within the exper-
imental protocol, the brain activity data and the
self-reported questionnaires (e.g., Nasa-TLX) from
eleven participants were recorded while watching a
relaxation video and performing three cognitive load
tasks: Reading Span, Stroop, and N-back. After
pre-processing the raw EEG data using outlier re-
jection based on a movement filter, spectral filter-
ing, common average referencing, and normalization,
frequency-domain features were extracted from 30-
second windows. The features were grouped into four
different sets to perform the binary classification. The
θ α feature contains mean θ and mean α band powers
across all four channels. According to the literature,
the α band power decreases with increasing cogni-
tive load, and the θ band power behaves oppositely
(Antonenko et al., 2010). Since lately the ratio of
these two frequency bands was also studied, we in-
cluded the ratio in the θ α ratio feature set (Raufi and
HEALTHINF 2023 - 16th International Conference on Health Informatics
48

Longo, 2022). Additionally, according to the physio-
logical assumptions, the right alpha power is reduced
than the left alpha power under the load condition.
Therefore, we extracted the asymmetry features from
all five frequency bands and the frontal asymmetry of
the α frequency band.
To begin with the evaluation, we performed fea-
ture exploration that the θ power increases and α
power decreases in a personalized manner for most
tasks. These individual feature characteristics are
aligned with the literature. Moreover, the mean asym-
metry score across all tasks and participants was
higher for relaxation sessions than cognitive load ses-
sions. Though the difference in the asymmetry score
is statistically insignificant, internal testing shows that
for some of the sessions, the score is significantly
higher in the relaxation session.
After feature exploration, we evaluated personal-
ized and generalized models utilizing the four feature
sets for binary classification using SVM and RF clas-
sifier with both SKF cross-validation with 8-folds and
SS cross-validation with 9-splits and test size of 0.25,
respectively. The SVM-SS classifier performed best
for the personalized model for all the feature sets and
for most feature sets of the generalized model. There-
fore, for a fair comparison we considered explaining
the results from SVM-SS classifier. Further results
show that the asymmetry feature set outperforms the
θ α and the θ α ratio feature sets with a mean classi-
fication accuracy of 81.7% for the personalized model
and 78% for the generalized model. Moreover, the au-
thors report 77.9% of accuracy while using only EEG
asymmetry features (Ahn et al., 2019). Another group
of authors reported higher classification accuracy us-
ing the asymmetry features, but they fell short of re-
porting other evaluation matrices, and the work also
needs to be validated for a larger cohort (Arpaia et al.,
2020). However, while using all the features, the
mean classification accuracy was 90.3% for the per-
sonalized models and 88% for the generalized model.
The performance of the personalized model is signifi-
cantly better, considering the fact that the authors used
24-channel EEG data and achieved 75.9% accuracy
(Pang et al., 2021). While considering the general-
ized model, the authors achieved only 3% higher ac-
curacy than the reported results in this paper while us-
ing a clinical-grade EEG device (Jim
´
enez-Guarneros
and G
´
omez-Gil, 2017).
It is concluded that a combination of physiological
and subjective measures is most effective in detecting
changes in intrinsic cognitive load. Furthermore, to
evaluate the correlation between self-report and phys-
iological data, we evaluated personalized and general-
ized models based on self-reported labels. The binary
classification accuracy of the three tasks for the per-
sonalized and generalized models was 84% and 83%,
respectively. The results objectify the findings of the
literature of including both physiological and subjec-
tive methods to measure cognitive load (Ayres et al.,
2021). These findings will support the daily life use
cases where we will not have an explicit cognitive
load sessions other than self-report.
As a future work, different window lengths can be
analysed for classification since the literature show
the best performance on a 120-second window us-
ing the same device as in this paper (Bashivan et al.,
2016). The fixed threshold movement filter used in
the pre-processing step can be replaced by more ad-
vanced filtering techniques, such as adaptive filtering,
in the future. Moreover, the findings on the asym-
metry features lead to work more on extracting high-
level features (e.g., mean, median, kurtosis) from the
asymmetry features to outperform the classification
accuracy using all features. Additionally, the find-
ings on the feature exploration and classification on
the personalized models will be considered to pro-
vide a solution to develop a pre-trained generalized
model to update the individual data received. The re-
sults could also be evaluated on the individual demo-
graphics(i.e., age, gender) of the participants. More-
over, the randomization of the tasks in the future ex-
perimental protocol can reduce the bias of cumulative
load and may pave the way to improve the self-report
label for classification. The experimental paradigm
will be made more robust by utilizing the coder view
of Psychopy and be publicly available in the future.
Eventually, the usage of commercial-grade EEG sen-
sors only with fewer electrodes will provide a way for
the extensive use of the EEG devices in daily life.
ACKNOWLEDGMENTS
We appreciate Hendrik W
¨
olert, and Florian M
¨
uller
for helping us in the data collection, organization
and labelling. We thank everyone who participated
in the experiment of this study. We thank, Kristina
Kirsten, and Christoph Anders for their comments on
our manuscript. This research was (partially) funded
by the HPI Research School on Data Science and En-
gineering and the Federal Ministry of Economic Af-
fairs and Energy (funding number ZF4776601HB9).
REFERENCES
Ahn, J. W., Ku, Y., and Kim, H. C. (2019). A novel wearable
eeg and ecg recording system for stress assessment.
Wearable EEG-Based Cognitive Load Classification by Personalized and Generalized Model Using Brain Asymmetry
49

Sensors, 19(9):1991.
Anders, C. and Arnrich, B. (2022). Wearable electroen-
cephalography and multi-modal mental state classifi-
cation: A systematic literature review. Computers in
Biology and Medicine, page 106088.
Antonenko, P., Paas, F., Grabner, R., and Van Gog,
T. (2010). Using electroencephalography to mea-
sure cognitive load. Educational psychology review,
22(4):425–438.
Arpaia, P., Moccaldi, N., Prevete, R., Sannino, I., and
Tedesco, A. (2020). A wearable eeg instrument
for real-time frontal asymmetry monitoring in worker
stress analysis. IEEE Transactions on Instrumentation
and Measurement, 69(10):8335–8343.
Arsalan, A., Majid, M., Butt, A. R., and Anwar, S. M.
(2019). Classification of perceived mental stress using
a commercially available eeg headband. IEEE jour-
nal of biomedical and health informatics, 23(6):2257–
2264.
Asif, A., Majid, M., and Anwar, S. M. (2019). Human stress
classification using eeg signals in response to music
tracks. Computers in biology and medicine, 107:182–
196.
Ayres, P., Lee, J. Y., Paas, F., and van Merri
¨
enboer, J. J.
(2021). The validity of physiological measures to
identify differences in intrinsic cognitive load. Fron-
tiers in Psychology, 12.
Barros, C., Pereira, A. R., Sampaio, A., Buj
´
an, A., and
Pinal, D. (2022). Frontal alpha asymmetry and neg-
ative mood: A cross-sectional study in older and
younger adults. Symmetry, 14(8):1579.
Barua, S., Ahmed, M. U., and Begum, S. (2020). Towards
intelligent data analytics: A case study in driver cog-
nitive load classification. Brain sciences, 10(8):526.
Bashivan, P., Rish, I., and Heisig, S. (2016). Mental
state recognition via wearable eeg. arXiv preprint
arXiv:1602.00985.
Borghini, G., Astolfi, L., Vecchiato, G., Mattia, D., and Ba-
biloni, F. (2014). Measuring neurophysiological sig-
nals in aircraft pilots and car drivers for the assessment
of mental workload, fatigue and drowsiness. Neuro-
science & Biobehavioral Reviews, 44:58–75.
Chen, F., Zhou, J., Wang, Y., Yu, K., Arshad, S. Z., Khawaji,
A., and Conway, D. (2016). Robust multimodal cog-
nitive load measurement. Springer.
Fangmeng, Z., Siriaraya, P., Choi, D., and Kuwahara, N.
(2020). Textile eeg cap using dry-comb electrodes
for emotion detection of elderly people. International
Journal of Advanced Computer Science and Applica-
tions, 11(4).
Gevins, A., Smith, M. E., Leong, H., McEvoy, L., Whit-
field, S., Du, R., and Rush, G. (1998). Monitoring
working memory load during computer-based tasks
with eeg pattern recognition methods. Human factors,
40(1):79–91.
Grimes, D., Tan, D. S., Hudson, S. E., Shenoy, P., and Rao,
R. P. (2008). Feasibility and pragmatics of classifying
working memory load with an electroencephalograph.
In Proceedings of the SIGCHI Conference on Human
Factors in Computing Systems, pages 835–844.
Hart, S. G. and Staveland, L. E. (1988). Development of
nasa-tlx (task load index): Results of empirical and
theoretical research. In Advances in psychology, vol-
ume 52, pages 139–183. Elsevier.
Ismail, L. E. and Karwowski, W. (2020). Applications of
eeg indices for the quantification of human cognitive
performance: A systematic review and bibliometric
analysis. PLoS One, 15(12):e0242857.
Jap, B. T., Lal, S., Fischer, P., and Bekiaris, E. (2009). Us-
ing eeg spectral components to assess algorithms for
detecting fatigue. Expert Systems with Applications,
36(2):2352–2359.
Jim
´
enez-Guarneros, M. and G
´
omez-Gil, P. (2017). Cross-
subject classification of cognitive loads using a
recurrent-residual deep network. In 2017 IEEE Sym-
posium Series on Computational Intelligence (SSCI),
pages 1–7. IEEE.
Kane, M. J. and Engle, R. W. (2002). The role of prefrontal
cortex in working-memory capacity, executive atten-
tion, and general fluid intelligence: An individual-
differences perspective. Psychonomic bulletin & re-
view, 9(4):637–671.
Katmah, R., Al-Shargie, F., Tariq, U., Babiloni, F., Al-
Mughairbi, F., and Al-Nashash, H. (2021). A review
on mental stress assessment methods using eeg sig-
nals. Sensors, 21(15):5043.
Kutafina, E., Heiligers, A., Popovic, R., Brenner, A., Han-
kammer, B., Jonas, S. M., Mathiak, K., and Zweer-
ings, J. (2021). Tracking of mental workload with a
mobile eeg sensor. Sensors, 21(15):5205.
Longo, L., Wickens, C. D., Hancock, P. A., and Hancock,
G. M. (2022). Human mental workload: A survey and
a novel inclusive definition. Frontiers in psychology,
13.
Marschall, J
¨
org, H. S. K. K.-M. N. H.-D. (2020). Gesund-
heitsreport 2020 stress in der modernen arbeitswelt
sonderanalyse: Digitalisierung und homeoffice in der
corona-krise.
Moontaha, S., Steckhan, N., Kappattanavar, A., Surges, R.,
and Arnrich, B. (2020). Self-prediction of seizures in
drug resistance epilepsy using digital phenotyping: a
concept study. In Proceedings of the 14th EAI Interna-
tional Conference on Pervasive Computing Technolo-
gies for Healthcare, pages 384–387.
M
¨
uhl, C., Jeunet, C., and Lotte, F. (2014). Eeg-based work-
load estimation across affective contexts. Frontiers in
neuroscience, 8:114.
Negi, S. and Mitra, R. (2018). Eeg metrics to determine
cognitive load and affective states: a pilot study. In
Proceedings of the 2018 ACM international joint con-
ference and 2018 international symposium on perva-
sive and ubiquitous computing and wearable comput-
ers, pages 182–185.
Pang, L., Guo, L., Zhang, J., Wanyan, X., Qu, H., and
Wang, X. (2021). Subject-specific mental workload
classification using eeg and stochastic configuration
network (scn). Biomedical Signal Processing and
Control, 68:102711.
Peirce, J., Hirst, R., and MacAskill, M. (2022). Building
experiments in PsychoPy. Sage.
HEALTHINF 2023 - 16th International Conference on Health Informatics
50

Raufi, B. and Longo, L. (2022). An evaluation of the eeg
alpha-to-theta and theta-to-alpha band ratios as in-
dexes of mental workload. Frontiers in Neuroinfor-
matics, 16.
Reinhardt, T., Schmahl, C., W
¨
ust, S., and Bohus, M. (2012).
Salivary cortisol, heart rate, electrodermal activity and
subjective stress responses to the mannheim multi-
component stress test (mmst). Psychiatry research,
198(1):106–111.
Setz, C., Arnrich, B., Schumm, J., La Marca, R., Troster, G.,
and Ehlert, U. (2010). Discriminating stress from cog-
nitive load using a wearable eda device. IEEE Trans-
actions on Information Technology in Biomedicine,
14(2):410–417.
Stone, J. M. and Towse, J. (2015). A working memory test
battery: Java-based collection of seven working mem-
ory tasks. Journal of Open Research Software, 3.
Stroop, J. R. (1935). Studies of interference in serial ver-
bal reactions. Journal of experimental psychology,
18(6):643.
Sun, L., Jin, B., Yang, H., Tong, J., Liu, C., and Xiong, H.
(2019). Unsupervised eeg feature extraction based on
echo state network. Information Sciences, 475:1–17.
Sun, L., Per
¨
akyl
¨
a, J., and Hartikainen, K. M. (2017).
Frontal alpha asymmetry, a potential biomarker for
the effect of neuromodulation on brain’s affective
circuitry—preliminary evidence from a deep brain
stimulation study. Frontiers in human neuroscience,
11:584.
Wearable EEG-Based Cognitive Load Classification by Personalized and Generalized Model Using Brain Asymmetry
51
