
Deep Distance Metric Learning for Similarity Preserving Embedding of
Point Clouds
Ahmed Abouelazm, Igor Vozniak, Nils Lipp, Pavel Astreika and Christian Mueller
Deutsches Forschungszentrum f
¨
ur K
¨
unstliche Intelligenz (DFKI), Saarbruecken, Germany
{first name.last name}@dfki.de
Keywords:
Point Clouds, 3D Deep Learning, Distance Metric Learning, Similarity Preserving Embedding.
Abstract:
Point cloud processing and 3D model retrieval methods have received a lot of interest as a result of the recent
advancement in deep learning, computing hardware, and a wide range of available 3D sensors. Many state-
of-the-art approaches utilize distance metric learning for solving the 3D model retrieval problem. However,
the majority of these approaches disregard the variation in shape and properties of instances belonging to the
same class known as intra-class variance, and focus on semantic labels as a measure of relevance. In this work,
we present two novel loss functions for similarity-preserving point cloud embedding, in which the distance
between point clouds in the embedding space is directly proportional to the ground truth distance between them
using a similarity or distance measure. The building block of both loss functions is the forward passing of n-
pair input point clouds through a Siamese network. We utilize ModelNet 10 dataset in the course of numerical
evaluations under classification and mean average precision evaluation metrics. The reported quantitative and
qualitative results demonstrate enhancement in retrieved models both quantitatively and qualitatively by a
significant margin.
1 INTRODUCTION
Point Cloud Data (PCD) is a data representation ob-
tained by LiDAR sensors, and is one of the most
prominent 3D data structures. PCD depicts a scanned
object as a set of discrete points scattered in a Eu-
clidean space. Compared to 2D images, PCDs are
substantially more resistant to changes in lighting
conditions and accurately capture object depth. Due
to the obvious inherent advantages of PCDs, they
have been used in a variety of application domains
such as robotics and autonomous driving. PCDs have
been employed in a range of applications, including
classification, scene segmentation, model retrieval,
and reconstruction (Qi et al., 2017a; Qi et al., 2017b;
Wang et al., 2019; Uy and Lee, 2018; Mescheder
et al., 2019; Peng et al., 2020; Park et al., 2019).
In the scope of this work, we are particularly in-
terested in classification and reconstruction applica-
tions of PCDs. The majority of these pipelines re-
quire efficient and meaningful encoding of the PCDs
(Qi et al., 2017a; Mescheder et al., 2019). Encoding
PCD into a feature space is thus a bottleneck of such
approaches, motivating us to explore further into the
resulting embedding and strategies to improve their
quality. One of the most dominant methods for judg-
ing the quality of an embedding space is investigating
(a) Query Model
(b) Retrieved Models
Figure 1: Problem description: the row-wise retrieval of the
query model on the left (a) is presented on the right (b). The
upper row results in (b) are from the same class but don’t
incorporate any visual similarity. In contrast, the bottom
row in (b) accounts for intra-class similarity and is a desir-
able retrieval result. Note: in this work, a sampled point
cloud from ModelNet 10 mesh models is used, whereas
mesh models are depicted for explanatory purposes only.
the model retrieval problem over such a space (Had-
sell et al., 2006). Model retrieval is a search prob-
lem in which a query model is given, and its most
relevant counterparts are retrieved from a large-scale
dataset. In deep learning, features are extracted from
N training objects using an encoder architecture (Had-
sell et al., 2006; Melekhov et al., 2016; Wang et al.,
2014; Hoffer and Ailon, 2015). A data structure, e.g.,
kdtree, octree is used to fit these features into memory
570
Abouelazm, A., Vozniak, I., Lipp, N., Astreika, P. and Mueller, C.
Deep Distance Metric Learning for Similarity Preserving Embedding of Point Clouds.
DOI: 10.5220/0011627100003417
In Proceedings of the 18th International Joint Conference on Computer Vision, Imaging and Computer Graphics Theory and Applications (VISIGRAPP 2023) - Volume 4: VISAPP, pages
570-581
ISBN: 978-989-758-634-7; ISSN: 2184-4321
Copyright
c
2023 by SCITEPRESS – Science and Technology Publications, Lda. Under CC license (CC BY-NC-ND 4.0)

Figure 2: Sample of intra-class variance of the class chair
based on ModelNet 10 dataset.
and a query database efficiently. When given a query
model, the same network is used to extract a feature
vector. A distance metric is then utilized to extract
the most relevant objects from the feature database.
However, relevance is commonly satisfied when the
query object and the matched object are of the same
semantic class (Qi et al., 2017a). Based on figure (1),
we can conclude that this relevance metric is flawed
because it ignores intra-class variation, resulting in an
embedding space that disregards similarity between
instances of the same class. Intra-class variance is
the variance of similarity in structure, appearance, and
properties between instances in the same class, an ex-
ample of such variance on chairs is illustrated in fig-
ure (2). This shortcoming encouraged us to investi-
gate the well-established distance metric learning ap-
proaches toward improving embedding space quality
by accounting for intra-class variance. The ultimate
target is to achieve a fine-grained model retrieval over
a PCD dataset that takes structural similarity between
instances in the same class into account.
The contribution of this work is threefold. First,
the loosely defined retrieval relevance metric which
merely takes the labels of the instances into account
is replaced by a tighter metric which only accepts
a retrieval if it belongs to the nearest neighbors of
the query given a ground truth similarity measure.
Chamfer distance is used as a similarity measure be-
tween PCDs in this work. Second, the deep distance
metric learning is utilized for performing the learn-
ing directly on the feature space. Finally, we pro-
pose two novel loss functions, based on contrastive
and triplet losses from the state-of-the-art literature
(Hadsell et al., 2006; Wang et al., 2014; Hoffer and
Ailon, 2015), that take into consideration both, inter-
and more essentially intra-class variance, and clarify
their training process inside the distance metric learn-
ing paradigm, to accomplish our fine-grained model
retrieval goal. To the best of our knowledge, there is
no instance of a loss function used for distance metric
learning that explicitly accounts for intra-class vari-
ance prior to this work.
2 RELATED WORK
Model retrieval problem as a search problem is com-
monly solved by applying distance metric learning
on a feature embedding space according to (Hadsell
et al., 2006). Distance Metric Learning is a ma-
chine learning task that involves automatically in-
ferring a discriminative similarity or distance mea-
sures over data instances as defined in (Xing et al.,
2002). A discriminative measure has a small distance
between similar objects and pushes different objects
away from each other. This learning technique has
been utilized in a wide range of applications, includ-
ing nearest-neighbor models, clustering, dimension-
ality reduction, and model retrieval as will be clari-
fied in this section. The first work on inferring such
measures is presented in (Xing et al., 2002), where
Mahalanobis distance and linear transformation are
used as a distance metric as in equation (1). This ap-
proach was further extended in (Chatpatanasiri et al.,
2010) by employing kernel learning to learn non-
linear transformations over input data.
D(x
i
, x
j
) =
q
(x
i
− x
j
)
T
M (x
i
− x
j
)
=
q
(L x
i
− L x
j
)
T
(L x
i
− L x
j
)
(1)
where x
i
, x
j
are two input data instances. M is a
positive definite matrix which can be decomposed as
M = L
T
L with L representing the linear transforma-
tion over the input data.
According to (Hadsell et al., 2006), classical dis-
tance metric learning has two major drawbacks: it re-
quires meaningful and computable distance measures,
and it does not provide an explicit function to map
new input data whose relationship to the training data
is unknown. Due to the aforementioned limitations,
several attempts have been made to address distance
metric learning within a deep learning framework.
To accomplish distance metric learning, a network is
trained to learn non-linear transformations over input
data guided by a custom loss function. The majority
of deep distance metric learning algorithms feed N
instances of training to a neural network and compare
between them using the aforementioned loss function.
(Hadsell et al., 2006) is a pioneer work in deep
distance metric learning. This paper introduced con-
trastive loss, where the loss function has two training
instances as an input. The loss function attempts to
cluster instances from the same class in the feature
space and separates them from instances belonging to
different classes, as shown in equation (2). The input
pairs are sampled at random and are used to learn in-
Deep Distance Metric Learning for Similarity Preserving Embedding of Point Clouds
571

variant mapping achieving dimensionality reduction.
Contrastive Loss(x
i
, x
j
) =
1
2
y × d
f
(x
i
, x
j
)
2
+
1
2
(1 − y) ×
max(0, m − d
f
(x
i
, x
j
))
2
(2)
where x
i
, x
j
are the input training instance, y indicates
whether x
i
, x
j
share the same label and m is the desired
margin separating different classes.
In order to improve image-matching results,
(Melekhov et al., 2016) employed contrastive loss.
Finding matching images across large datasets is a
key difficulty in many applications, including multi-
view 3D reconstruction and image retrieval. Based on
the feature vectors in Euclidean space embedded by a
neural network trained via contrastive loss, this work
discovers matching and non-matching pairs of im-
ages. In addition, a heuristic approach for determin-
ing the margin between classes is presented. SigNet
(Dey et al., 2017) uses convolutional neural networks
and contrastive loss to perform offline signature ver-
ification. A minor change to contrastive loss is pro-
posed, which assigns different weights to the pull
force between similar instances and the push force
between dissimilar ones. When compared to state-of-
the-art approaches, SigNet outperformed most of the
benchmark signature datasets.
Triplet loss is introduced in (Wang et al., 2014;
Hoffer and Ailon, 2015). The input of the triplet loss
is extended to be a triplet. Positive-negative triplets
are the focus of this loss function. A positive-negative
triplet is one in which the first (anchor) and second
(positive) members belong to the same class, but the
third (negative) member belongs to a different class.
Using this loss, the anchor and positive members are
simultaneously drawn near each other while being
pushed away from the third member, as formulated in
equation (3). The first application in which this loss
is utilized is image ranking in (Wang et al., 2014).
Triplet Loss(x
a
, x
p
, x
n
) =
1
2
{max(0, d
f
(x
a
, x
p
)
+m − d
f
(x
a
, x
n
))}
2
(3)
where x
a
, x
p
, x
n
are the anchor, positive and negative
training instances respectively, and m stands for the
desired margin separating different classes.
FaceNet (Schroff et al., 2015) achieves state-of-
the-art facial recognition performance by combining
triplet loss with an inception architecture (Szegedy
et al., 2015). Face recognition is investigated by em-
bedding face images in a Euclidean feature space,
where face similarity may be measured directly. Us-
ing the L
2
norm, the feature space is confined within
a d-dimension hyper-sphere. In addition, rather than
mining triplets offline using network checkpoints, this
work provides a unique technique for mining triplets
online. A huge mini-batch of thousands of instances
is generated, and the hardest positive-negative triplets
are sampled. The hardest triplets are those in which
the distance between the anchor and the positive in-
stance is similar to the distance between the anchor
and the negative instance. (Nazir et al., 2021) is con-
cerned with utilizing triplet loss for reconstruction
and completion challenges in PCD domain. In this
work, deep distance metric learning is used to learn
global features with adequate separation between dif-
ferent classes. To accomplish discriminative recon-
struction of PCDs, the final loss function is a combi-
nation of reconstruction loss calculated by Chamfer
distance and triplet loss.
In the literature, many variants based on con-
trastive and triplet losses have been suggested. To ac-
complish gait recognition, (Xu, 2021) proposes Deep
Large Margin Nearest Neighbor (DLMNN) loss. Gait
recognition is the challenge of identifying a far away
human from their walking manner. The DLMNN loss
is a linear combination of the triplet and contrastive
losses controlled by weighting, γ as clarified in equa-
tion (4). The goal of such a loss function is to guar-
antee that similar examples are drawn as close to each
other as possible, while also learning to distinguish
between examples from different classes.
DLMNN Loss(x
a
, x
p
, x
n
) = Triplet Loss(x
a
, x
p
, x
n
)+
γ × ContrastiveLoss(x
a
, x
p
)
(4)
PointNetVLAD (Uy and Lee, 2018) provides
a novel pipeline for PCD-based retrieval for place
recognition that utilizes PointNet and normalizes its
outputs using NetVLAD (Arandjelovic et al., 2016).
This work proposes two variants of the triplet loss:
lazy triplet and quadruplet losses. Both losses sam-
ple N negative examples rather than sampling just
one. These two loss functions have more stable train-
ing and faster convergence. PointNetVLAD is able
to achieve state-of-the-art performance on its refer-
ence task. In (Wang et al., 2017), the angular loss
is introduced as an alternative formulation of a triplet.
This loss assumes a triangle, linking the input triplet
(x
a
, x
p
, x
n
) and constrains the angle at the triplet’s
negative member. Angular loss has two inherent ad-
vantages over triplet loss: scale invariance and robust-
ness against feature variance. The results indicate that
angular loss has faster convergence and outperforms
triplet loss on image clustering and retrieval tasks.
Using a modified contrastive loss function, graph
proximity loss as in (Bai et al., 2019) learns a graph-
level representation. The purpose of this work is to
encapsulate an entire graph into a vector space that
takes graph-graph proximity into account. The mod-
VISAPP 2023 - 18th International Conference on Computer Vision Theory and Applications
572

ified contrastive loss pulls the distance between two
training graphs to be identical to their ground truth
distances, independent of which class each graph be-
longs to. To the best of our knowledge, this is the only
loss function that explicitly considers intra-class vari-
ation. However, it does not provide any separation
between different classes. This work achieves com-
petitive results on similarity ranking, and visualiza-
tion tasks by learning graph representation in unsu-
pervised and inductive manners.
3 METHODOLOGY
3.1 Preliminaries
We establish a consistent mathematical notation that
will be utilized throughout the rest of this paper. The
introduced notation is as follows:
• Given a labeled dataset with M tuples where each
tuple is a PCD and its label, the dataset is noted as
D =
{
(x
i
, y
i
)
}
M
i=1
.
• A PCD containing N points, where each point is
represented just by its coordinates, with no ad-
ditional attributes taken into account, is denoted
as x
i
=
p
j
N
j=1
∈ R
N×3
. Each PCD is sampled
with the same number of points. The same pre-
processing as introduced in (Qi et al., 2017a) is
applied consistently over all PCDs.
• The discrete label assigned to each PCD x
i
is indi-
cated by y
i
and can belong to a set of pre-defined
labels ∈
{
0, 1, ....,C
}
.
• A neural network φ parameterized by weights
θ maps the input PCD into a Euclidean feature
space such that φ : x
i
7→ f
i
. The PCD embed-
ding in the feature space is formulated as follows:
f
i
= φ(x
i
; θ) ∈ R
d
.
•
ˆ
d
i, j
is the L
2
distance between two PCDs (x
i
, x
j
) in
the feature space, and it is formulated as follows:
(5).
ˆ
d
i, j
=
f
i
− f
j
2
=
φ(x
i
; θ) − φ (x
j
; θ)
2
(5)
• Finally, d
i, j
is the ground truth distance between
two PCDs (x
i
, x
j
) based on a similarity or distance
measure.
3.2 Modified Relevance Metric
In this work, we start with a modification of the rel-
evance metric used in evaluating correct retrievals in
model retrieval problems. We propose a tighter met-
ric that only accepts retrievals to be correct if they
belong to the nearest neighbors of the query object on
a ground truth distance metric. The Chamfer distance
is used as a ground truth distance metric on PCDs in
this work. Chamfer distance is an asymmetric dis-
tance measure that has been widely utilized in the lit-
erature for comparing PCDs as in (Mescheder et al.,
2019; Peng et al., 2020; Park et al., 2019). Equa-
tion (6) introduces the Chamfer distance between two
PCDs (x
i
, x
j
). The first term in the equation iterates
over each point p ∈ x
i
and calculates the average dis-
tance to their corresponding nearest point q ∈ x
j
. The
second term achieves the same, but with the roles of
x
i
and x
j
are swapped.
CD (x
i
, x
j
) =
1
|
x
i
|
∑
p∈x
i
min
q∈x
j
∥
p − q
∥
2
2
+
1
x
j
∑
q∈x
j
min
p∈x
i
∥
p − q
∥
2
2
(6)
The suggested relevance metric necessitates the
development of a loss function that accounts for intra-
class variation, diversity in structure, and attributes of
objects in the same class. To the best of our knowl-
edge, graph proximity loss (Bai et al., 2019) is the pi-
oneer loss function for including intra-class variation.
The graph proximity loss takes an input pair (x
i
, x
j
)
and minimizes the difference between their distance
in the feature space
ˆ
d
i, j
and their ground truth dis-
tance d
i, j
, as shown in equation (7). This loss func-
tion is used for learning graph embeddings. Despite
having desirable properties related to the fine-grained
model retrieval that we are interested in, graph prox-
imity loss is not directly applicable to our work be-
cause the loss setting assumes a single global class
throughout the entire dataset and does not provide ad-
equate separation between different classes, which is
appropriate for graph similarity ranking on a macro
level but not for our setting.
Graph Proximity Loss (x
i
, x
j
) =
1
2
×(
ˆ
d
i, j
−d
i, j
)
2
(7)
3.3 Proposed Pair Loss
We begin our proposed pair loss design by review-
ing the basic contrastive loss formulation as provided
in equation (2). Contrastive loss pulls pairs sam-
pled from the same class while repelling different
pairs with at least a hyperparameter margin, as sim-
plified in equation (8). Equation (9) clearly shows
that the second component in the loss function does
not contribute unless the distance between two in-
stances from different classes is smaller than the mar-
gin. This term is designed to simplify the training
procedure and prevent the network from exerting ad-
Deep Distance Metric Learning for Similarity Preserving Embedding of Point Clouds
573
ditional pushing force when different classes are ade-
quately separated. Contrastive loss overlooks intra-
class variance since it minimizes the distance be-
tween examples belonging to the same class regard-
less of their similarity. Thus, in order to include intra-
class variation and accomplish fine-grained model re-
trieval, contrastive loss formulation must be modified.
Loss (x
i
, x
j
) =
1
2
ˆ
d
2
i, j
, i f y
i
= y
j
max(0, m −
ˆ
d
i, j
)
2
, i f y
i
̸= y
j
(8)
max(0, m −
ˆ
d
i, j
) =
zero , i f
ˆ
d
i, j
≥ m
+ve , i f
ˆ
d
i, j
< m
(9)
The proposed intra-class pair loss modifies con-
trastive loss, as formulated in equation (10). The first
component is modified to minimize the square differ-
ence between the distance, in the embedding space,
between a pair of (x
i
, x
j
) and their ground truth dis-
tance calculated by Chamfer distance, as in equation
(6). The benefit of this improvement is the incorpo-
ration of intra-class variation by embedding PCDs in
a Euclidean feature space that respects their similar-
ity based on chamfer distance. The second term is
maintained owing to its capacity to learn clear sep-
aration between different classes and regularization
of its contribution depending on the hyperparameter
margin.
ICPL (x
i
, x
j
) =
1
2
(
ˆ
d
i, j
− d
i, j
)
2
, i f y
i
= y
j
max(0, m −
ˆ
d
i, j
)
2
, i f y
i
̸= y
j
(10)
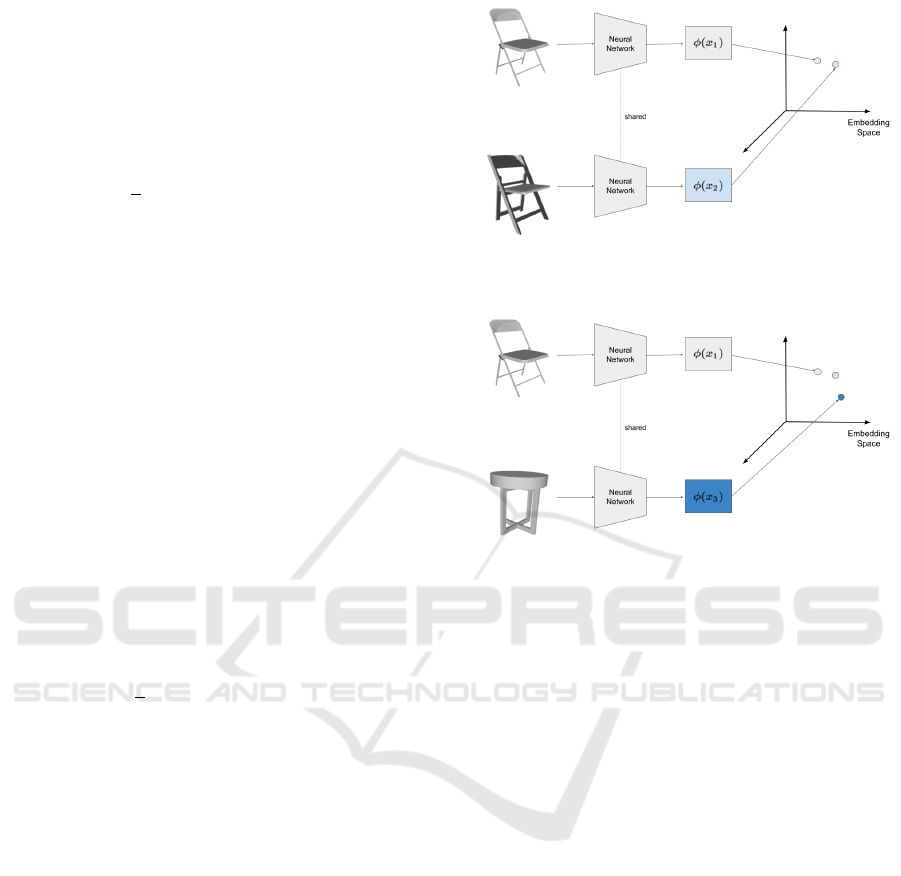
Figures (3, 4, 5) demonstrate the expected em-
bedding of positive and negative PCD pairs using
a siamese network and the proposed intra-class pair
loss. A positive pair consists of PCDs from the same
class, whereas a negative pair consists of PCDs from
different classes. A siamese network is a number of
copies of a network with identical shared weights. A
visually similar positive pair (x
1
, x
2
) is shown in fig-
ure (3). A visually similar pair has a low Chamfer
distance between its members, and the proposed loss
function promotes the network to learn an embedding
in which the distance between the members in the fea-
ture space is equal to their Chamfer distance.
The pair of PCDs (x
1
, x
3
) is passed to the embed-
ding pipeline as shown in figure (4). Since x
1
and
x
3
are visually dissimilar, the Chamfer distance be-
tween them is considerably greater than the distance
between x
1
and x
2
. As a result, the network strives to
learn an embedding that is true to the ground truth dis-
tance guided by the proposed loss. As seen from Fig-
ures (3, 4),
ˆ
d
1,2
<
ˆ
d
1,3
, indicating that the constructed
feature space takes into account intra-class variation.
Figure 3: Visually similar positive pair (x
1
, x
2
) example to
illustrate proposed intra-class pair loss behavior.
Figure 4: Visually dissimilar positive pair (x
1
, x
3
) example
to illustrate proposed pair loss behavior.
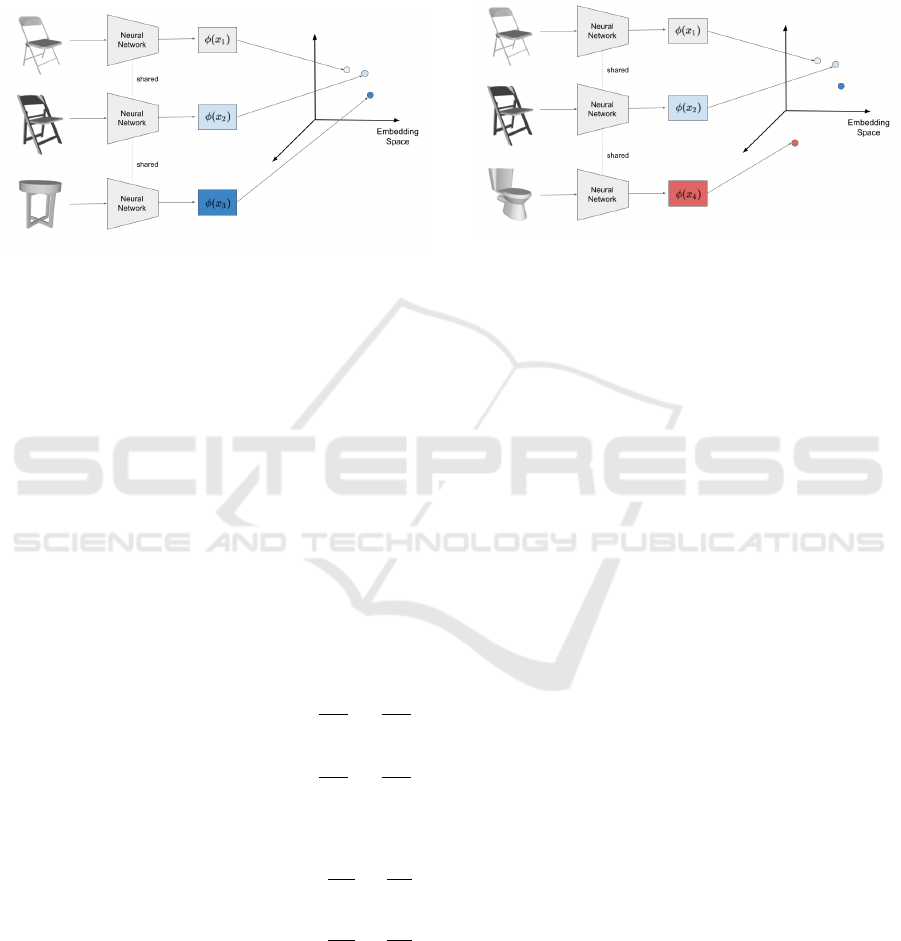
Figure (5) illustrates an example in which the sam-
pled pair is a negative one, because x
1
belongs to the
class chair and x
4
belongs to the class toilet. Despite
the fact that x
1
and x
4
are visually similar and share
some geometric properties, the second term in Equa-
tion (8) forces the network to push their embeddings
apart from each other by at least the value of the mar-
gin. As a result, our loss function instructs the net-
work to learn a reasonable separation between differ-
ent classes, even if they share similarities.
The feature vector extracted from a PCD x
i
is nor-
malized using the L
2
norm, such that
∥
f
i
∥
2
= 1. This
normalization is initially introduced in (Schroff et al.,
2015) to constrain the learned feature vectors within
a d-dimensional hyper-sphere. The advantage of us-
ing the L
2
norm is that the squared Euclidean distance
between two PCDs is confined between [0, 4], making
margin selection easier and more meaningful. The ap-
proach given in (Melekhov et al., 2016) is utilized to
automatically set the margin value to achieve appro-
priate separation between classes and more efficient
training. The margin value is specified to be twice
the average distance between PCD pairs computed via
random network initialization.
Dataset D has
M
2
pairs. Choosing pairs that con-
tribute to the loss is critical for network training to
achieve fast convergence. Positive pairs are not an
VISAPP 2023 - 18th International Conference on Computer Vision Theory and Applications
574
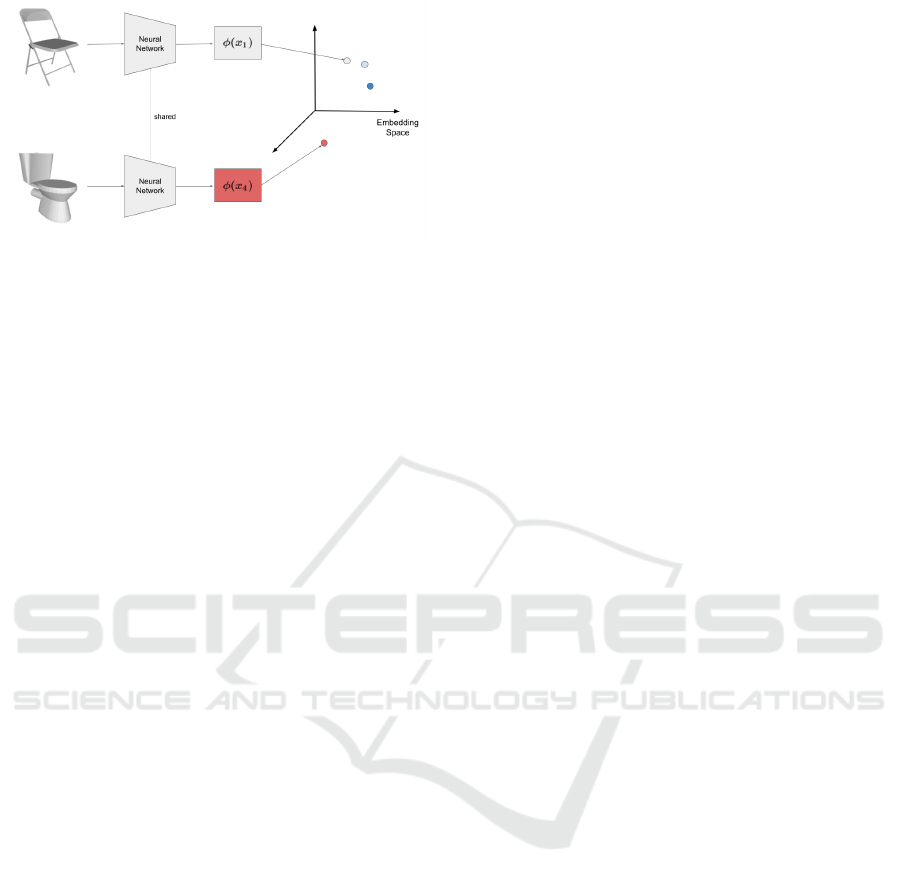
Figure 5: Negative pair (x
1
, x
4
) example to illustrate pro-
posed intra-class pair loss behavior.
issue because they all contribute to the loss; how-
ever, sampling negative pairs that break the constraint,
called hard negative pairs, is a challenge. Hard nega-
tive pairs are pairs that have members from different
classes and have a distance in the feature space that is
smaller than the margin value. It is infeasible to sam-
ple these pairs over the whole dataset at each train-
ing stage. Thus, we adopt the online sampling tech-
nique introduced in (Schroff et al., 2015). First, a bal-
anced mini-batch is created with k samples from each
class. The intention behind a balanced mini-batch is
to have a minimum number of examples from each
class in each mini-batch. Using the siamese network
of choice, the sampled mini-batch is encoded into the
feature space. All positive pairs in the mini-batch are
generated, and an equal number of the hardest (near-
est) negative pairs are sampled. Even though online
sampling requires a high computational effort, it is
preferable to offline sampling. Since offline sampling
uses a stationary network checkpoint and the sampled
pairs may become outdated and cease to contribute to
the loss when the current network weights change.
An online sampling strategy by itself is insuffi-
cient for efficient network training. Since sampling
PCDs presents a problem in that their mini-batch size
is limited when compared to work done on images
owing to PCDs high memory and computation re-
quirements. In this work, for example, just a hundred
samples can be packed into a mini-batch compared to
a mini-batch containing 1800 images used in (Schroff
et al., 2015). Due to the small mini-batch size, only a
few negative pairs contribute to the loss by breaching
the margin constraint as training advances, resulting
in slower network convergence. Thus, we modified
our final loss to be a linear combination of cross en-
tropy loss and the proposed pair loss, with α and γ
regulating the trade-off between them as seen in equa-
tion (11). By including the cross entropy loss into the
proposed loss function, the network is able to learn a
decision hyper-plane that compensates for the limited
mini-batch size while also improving the discrimina-
tive ability of the network as proposed in (Wen et al.,
2016; Em et al., 2017).
Total Loss = α × Cross Entropy Loss+
γ × Intra Class Pair Loss
(11)
3.4 Proposed Triplet Loss
(Schroff et al., 2015) introduced the triplet loss, which
is used to compare the embedding of three input in-
stances within deep distance metric learning frame-
works. The formulation of triplet loss, which only ac-
cepts a positive - negative triplet (x
a
, x
p
, x
n
) as an in-
put, is clarified by Equation (3). The objective of this
loss function is to learn an embedding in which the
difference between the distance between the anchor
and positive members
ˆ
d
a,p
and the distance between
the anchor and negative members
ˆ
d
a,n
is larger than
the margin value. Only when the separation between
members is less than the margin value, as shown in
Equation (12), can a triplet contribute to the loss. This
formulation is preferable since well-separated triplets
do not contribute to network weight updates and are
instead guided only by ill-separated triplets. Triplet
loss guides the network to learn an embedding of a
triplet that treats instances from the same class exactly
the same, regardless of their similarity. This loss is
modified in order to incorporate intra-class variance
and learn a fine-grained embedding space based on
the similarity between PCDs.
The proposed triplet loss alters the triplet loss as
shown in Equation (13). The proposed formulation
broadens the kind of triplets accepted as input to the
loss function to include both (positive-negative) and
(positive-positive) triplets. The (positive-positive)
triplets are triplets with the same label for all three
members. Part one of equation (13) depicts the
loss component responsible for handling (positive-
positive) triplets. The goal of this component is to
minimize the difference between the ratio of distances
in the embedding space compared to their ground
truth distances as estimated by Chamfer distance.
This component is further clarified in Equation (14),
where a triplet ceases contributing to the loss when
the ratio of their distances is equivalent to the ground
truth distance. The (positive-negative) triplets are
handled in the second term of equation (13), which
penalizes the difference between the embedding dis-
tance ratio compared to the ratio of Chamfer distance
between the anchor and the positive members and the
margin value. This term leads the network to believe
that the Chamfer distance between the anchor and
negative members is equal to at least the margin, caus-
ing the network to learn an embedding that pushes
them further apart. In Equation (15), the case based
Deep Distance Metric Learning for Similarity Preserving Embedding of Point Clouds
575
max(0,
ˆ
d
a,p
+ m −
ˆ
d
a,n
) =
zero , i f
ˆ
d
a,p
+ m ≤
ˆ
d
a,n
+ve , i f
ˆ
d
a,p
+ m >
ˆ
d
a,n
(12)
Intra Class Triplet Loss(x
a
, x
i
, x
j
) =
(
(
ˆ
d
a,i
× d
a, j
−
ˆ
d
a, j
× d
a,i
)
2
, i f y
a
= y
i
and y
a
= y
j
max(0,
ˆ
d
a,i
× m −
ˆ
d
a, j
× d
a,i
)
2
, i f y
a
= y
i
and y
a
̸= y
j
)
(13)
Figure 6: Positive - Positive triplet (x
1
, x
2
, x
3
) example to
illustrate proposed intra-class triplet loss behavior.
behavior of the loss for (positive-negative) triplets is
formulated. Once members are separated by at least
the margin value, this component of the loss function
vanishes.
The expected embedding of various PCD triplets
using a siamese network guided by the proposed
triplet loss is illustrated in Figures (6, 7). In figure (6),
a positive - positive triplet (x
1
, x
2
, x
3
) is selected as the
siamese network input. When compared to x
3
, x
1
and
x
2
are more visually similar. As a result, the proposed
loss guides the network to learn an embedding that
respects the ratio of the members’ Chamfer distances.
Since the distance between the first and second mem-
bers of the triplet
ˆ
d
1,2
is less than the distance between
the first and third members
ˆ
d
1,3
, the resulting vector
space preserves intra-class variation.
(
ˆ
d
a,i
×d
a, j
−
ˆ
d
a, j
×d
a,i
)
2
=
zero , i f
ˆ
d
a,i
ˆ
d
a, j
=
d
a,i
d
a, j
+ve , i f
ˆ
d
a,i
ˆ
d
a, j
̸=
d
a,i
d
a, j
(14)
max(0,
ˆ
d
a,i
×m−
ˆ
d
a, j
×d
a,i
) =
zero , i f
ˆ
d
a,i
ˆ
d
a, j
≤
d
a,i
m
+ve , i f
ˆ
d
a,i
ˆ
d
a, j
>
d
a,i
m
(15)
A positive - negative triplet is depicted in figure
(7), with x
1
, x
2
belonging to the class chair and x
4
belonging to the class toilet. The sampled triplet is
the siamese network’s input. The loss function is
designed to build an embedding space that respects
Figure 7: Positive - Negative triplet (x
1
, x
2
, x
4
) example to
illustrate proposed intra-class triplet loss behavior.
the Chamfer distance between examples of the same
class (x
1
, x
2
) while pushing examples from a different
class x
4
away with the margin. By separating different
classes with a margin, the inter-class variance within
the dataset is preserved.
The feature space is confined inside a d-
dimensional hyper-sphere by normalizing extracted
feature vectors with the L
2
norm. As discussed in
section 3.3, the confined space has a favorable influ-
ence on the margin selection and distance computa-
tion between vectors. However, the margin selection
criteria used in the preceding section is not applica-
ble to the proposed triplet loss. Since the proposed
method’s margin was empirically found to be narrow
and does not offer an adequate separation between
distinct classes. As a result, the margin selection for
this loss is considered a part of the hyperparameter
selection process.
M
3
triplets are present in dataset D. It is crucial
for stable network training and efficient convergence
to choose triplets that contribute to the loss. The se-
lection of (positive-positive) triplets is not problem-
atic, since all of these triplets contribute to the loss.
However, sampling (positive-negative) triplets that vi-
olate the constraint, known as (positive-hard negative)
triplets, poses a challenge. (Positive-hard negative)
triplets are triplets where the difference between the
feature space distances between the anchor and posi-
tive members and the anchor and negative members is
less than the margin value. It is impractical to sample
these triplets over the whole dataset at each training
step.
Section 3.3 examined online and offline sampling
strategies. Given its benefits over the offline strategy,
VISAPP 2023 - 18th International Conference on Computer Vision Theory and Applications
576

online sampling is well suited for (positive-hard nega-
tive) triplets selection. A balanced mini-batch is sam-
pled in the same way as was mentioned in the pre-
ceding section. A pre-defined number of (positive-
positive) triplets are randomly sampled from the mini-
batch, as it is computationally infeasible to sample
all these triplets. In addition, an equal number of the
(positive-hardest negative) triplets is sampled
Due to the restricted mini-batch size of PCDs, an
online sampling technique alone is insufficient for ef-
ficient network training. As a result of this constraint,
only a few (positive-negative) triplets contribute to the
loss by violating the margin constraint at the advanced
phases of the training process. As shown in Equation
(16), the total loss is adjusted to be a linear combina-
tion of cross entropy loss and the proposed intra-class
triplet loss, with α and γ regulating the trade-off be-
tween both. By integrating the cross entropy loss into
the proposed intra-class loss function, the network has
an increased discriminative capacity that compensates
for the restricted mini-batch, as proposed in Section
3.3.
Total Loss = α × Cross Entropy Loss
+γ × Intra Class Triplet Loss
(16)
3.5 Network Architecture
DGCNN (Wang et al., 2019) is a network architecture
that draws inspiration from PointNet (Qi et al., 2017a)
and convolution operators. DGCNN, like PointNet,
offers a versatile architecture that can be used for a
variety of high-level applications. DGCNN presents
the Edge-Conv layer, which is a differentiable layer
that captures local geometries by considering a point
correlation with its neighbors. This layer receives N
points as input, with each point represented by d
in
fea-
tures. To begin, a knn −graph with a fixed number of
neighbors is constructed over the points to emphasize
the underlying local geometric structure. The con-
structed graph is processed using a convolution-like
operator to compute a per-point output with d
out
di-
mensions. The knn − graph is not fixed and is dy-
namically modified in each Edge-Conv layer of the
network. Dynamically updating implies that the list of
k-nearest neighbors in each edge-conv layer is unique
and is built from the layer’s input features rather than
the network’s initial input.
The convolution operator learns the edge weight
between the center point p
i
and its nearest k-
neighbors
{
q
1
, ..., q
k
}
. The edge weights are formu-
lated in Equation (17) to capture local correlations
with neighbors and preserve global shape structure.
The edge weights capture local geometries based on
the difference between a center point features and
each of its neighbor features (q
j
− p
i
) and extract rel-
evant information from it by multiplying with learn-
able weights θ
1
. While the global shape structure
is preserved by center point features p
i
and infor-
mation is inferred from these features with learnable
weights θ
2
. Using Leaky RELU non-linearities, non-
linearities are injected into the combined learned fea-
tures. In contrast to RELU, which does not allow
any negative values, Leaky RELU enables a small
slope for negative values. When compared to RELU,
Leaky RELU produced superior empirical results in
DGCNN. DGCNN is one of the best performing
point-based models in PCD analysis, owing to the
favorable properties of the edge-conv layer. Since
neither the graph structure nor the convolution-like
operator is order-dependent, edge-conv is permuta-
tion invariant. Furthermore, it exhibits partial transla-
tion invariance since the difference between features
(q
j
− p
i
) is a relative term that is translation invariant.
However, the center point feature p
i
term is absolute.
Finally, this layer displays non-locality characteristics
since the proximity in the feature space is not the same
as the proximity in the input space, information is dis-
persed in a non-local manner.
e
i, j
= LeakyRelu(θ
1
× (q
j
− p
i
) + θ
2
× p
i
) (17)
4 EVALUATIONS
4.1 Dataset
The ModelNet-10 dataset is used in this work to
evaluate the proposed loss functions’ discrimina-
tive and model retrieval performance. ModelNet-
10 (Wu et al., 2015), published by Princeton Uni-
versity, is a benchmark for 3D object classification
and retrieval, where the dataset includes 4899 CAD-
generated meshes that were saved in Object File
Format (OFF). The meshes are separated into 3991
training meshes and 908 testing meshes. ModelNet
is well-known in the research field as it is a well-
structured dataset, including pre-aligned clean shapes
picked from several categories. The dataset includes
ten classes: bathtub, bed, chair, desk, dresser, moni-
tor, nightstand, sofa, table, and toilet. The output PCD
is generated by randomly sampling evenly distributed
points from the triangle faces of the CAD-generated
mesh. The points that were sampled are normalized
and put into a bounding box between [−1, 1].
4.2 Experimental Setting
The implementation of the proposed losses and net-
work architecture is established in Python 3.9 with
Deep Distance Metric Learning for Similarity Preserving Embedding of Point Clouds
577
PyTorch 1.10.0 and Cuda 11.5 on an Nvidia GeForce
RTX 3090 graphics card with 24 GB of vRAM.
DGCNN network architecture is implemented as
in (Wang et al., 2019). The network is trained with a
balanced mini-batch having 10 samples per class for
15 epochs. Besides, it is optimized using an SGD op-
timizer with an initial learning rate of 0.1, momentum
of 0.9, and weight decay of 10
−4
. The learning rate is
decreased using a cosine annealing schedule to reach
a final learning rate of 0.001 as recommended in the
original implementation. Upon complication of the
learning, the training dataset is fitted in kd-tree for a
faster query during the inference of model retrieval
metrics.
4.3 Evaluation Metrics
Two aspects of the designed loss functions will be
evaluated in this work: discriminative and retrieval
abilities. The discriminative ability is measured us-
ing well-known classification metrics such as recall,
precision, F−score, and accuracy. The mean average
precision (mAP) metric is used to evaluate the model
retrieval quality and stands for the mean value of the
average precision. mAP is first presented in (Harman,
1993) as metric of information retrieval quality over
text. Average Precision (AP) is parameterized by k
which is the number of retrieved examples, as seen in
Equation (19). Average Precision@k is the product of
precision@k, as in Equation (18), and relevance@k,
normalized by the number of relevant retrieved in-
stances, also known as Ground Truth Positives (GTP).
Relevance@k is an indicator of whether the retrieved
instance is correct or not. Precision@k is the number
of relevant retrieved instances to the total number of
retrieved instances, as illustrated in equation (18).
precision@k =
correct results @ k
k
(18)
AP@ K =
1
GT P
K
∑
k=1
precision@k × relevance@ k
(19)
4.4 Quantitative Results
Table 1 illustrates the discriminative ability of
DGCNN trained with various loss functions based on
the classification metrics stated earlier. The results in-
dicate that both of our proposed losses outperform the
cross entropy loss on the classification task by 2% on
average on all metrics. This improvement indicates
that the proposed intra-class pair and triplet losses de-
velop a more discriminative hyperspace for classifi-
cation with good separation between classes in the
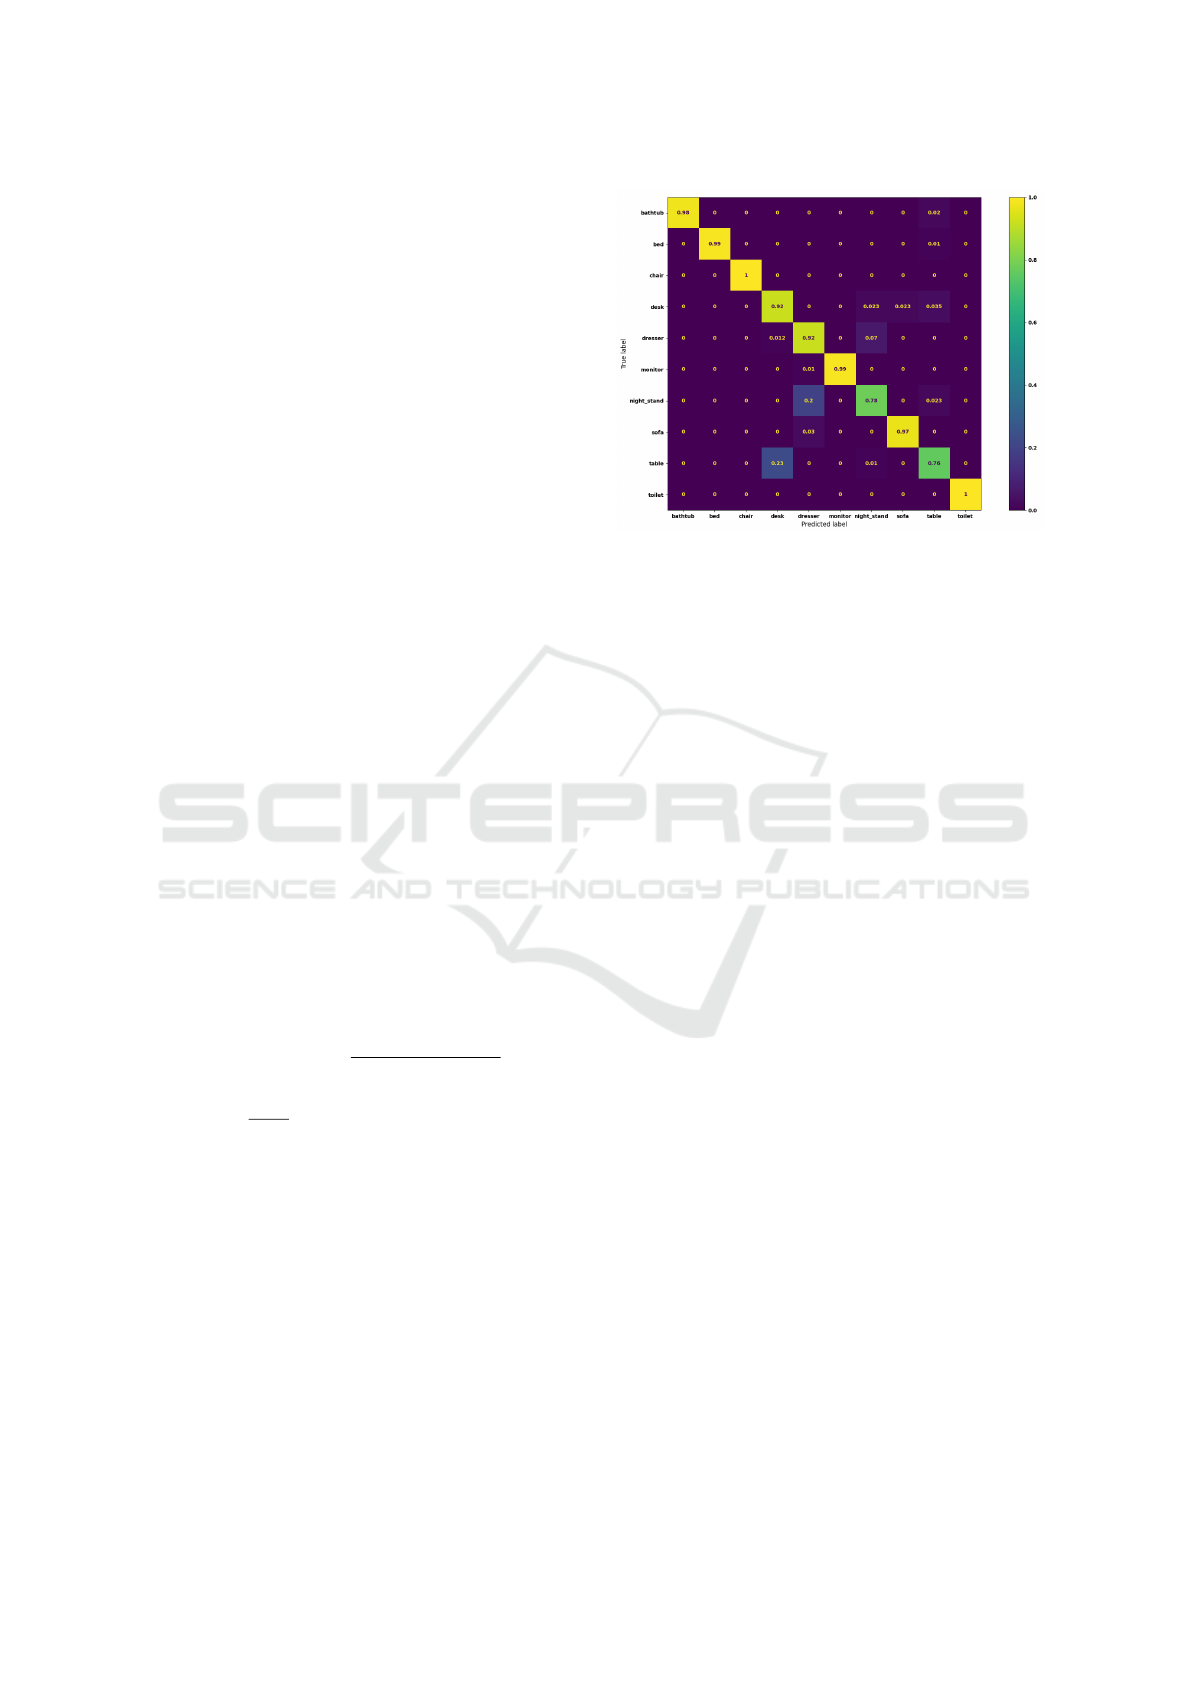
Figure 8: Confusion matrix for DGCNN network trained by
the proposed pair loss.
dataset. When compared to the proposed triplet loss,
which is slightly better, the proposed pair loss has a
very competitive performance.
Figures (8, 9) demonstrate the confusion matrix
extracted from classification statistics of a DGCNN
classifier trained by the proposed intra-class pair and
triplet losses, respectively. The highest values always
appear on the confusion matrix diagonals, indicating
a good classification performance across all classes.
The little dispersed values scattered over the confu-
sion matrix indicate the classification error for a cer-
tain class distributed across the other classes. A mi-
nor categorization error occurs when instances from
the class nightstand are classified as belonging to the
class dresser, and when instances from the class table
are labeled as belonging to the class desk. The fact
that both class pairs (nightstand, dresser) and (table,
desk) are visually similar and might be difficult for
humans to categorize leads to these minor inter-class
errors.
Table 2 introduces model retrieval results on mAP
metric using labels sharing as relevance measure. The
results are calculated across a range of retrieval sizes,
starting with 5 and up to 20 with a step size of 5,
to provide a better insight into our proposed losses’
performance. Two extra baselines are added in this
table, specifically the original contrastive and triplet
losses formulations, which were created explicitly for
the model retrieval task based on the labels. The re-
sults demonstrate that our proposed intra-class pair
and triplet losses are competitive on the task at hand.
On all retrieval sizes except 20, where triplet loss is
marginally better, the proposed pair loss performs bet-
ter than all baselines. We may deduce from this table
that our proposed losses do not degrade performance
as they keep the inter-class term of the original losses
and, in fact, outperform the state-of-the-art losses like
VISAPP 2023 - 18th International Conference on Computer Vision Theory and Applications
578
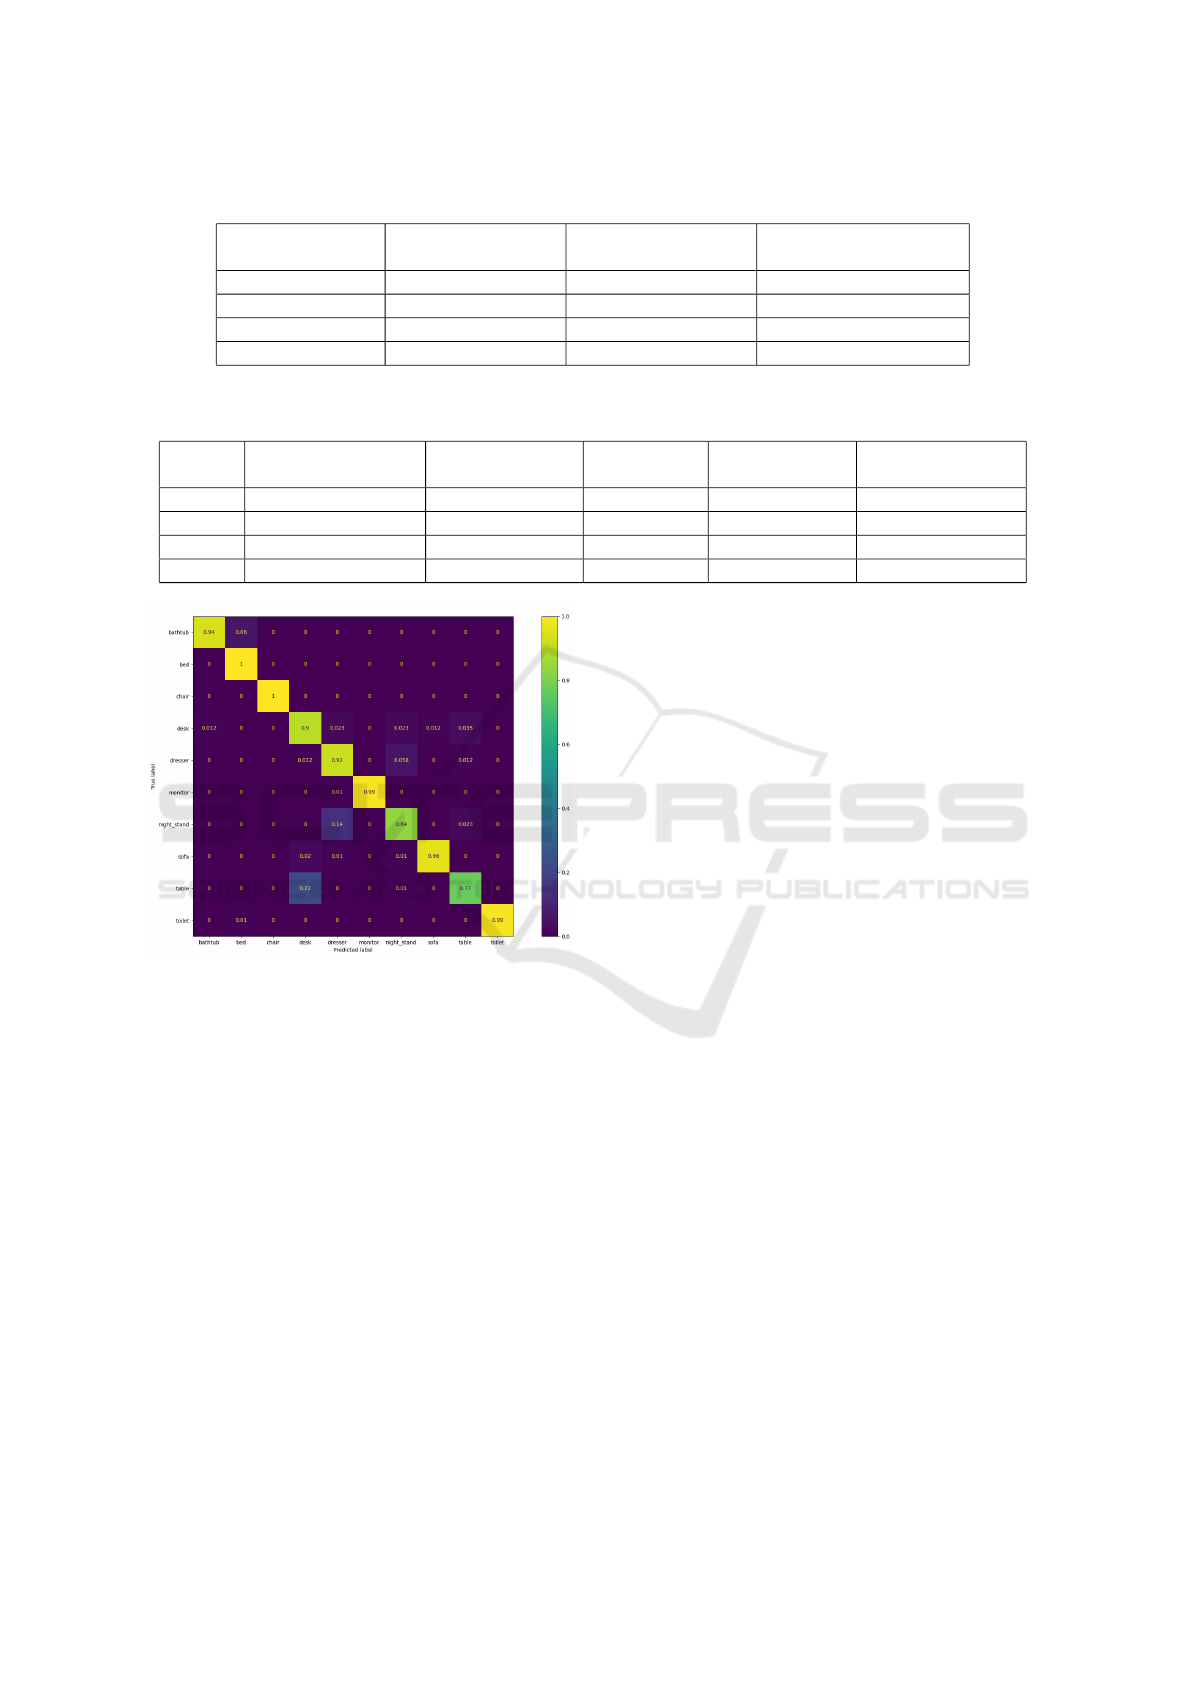
Table 1: Classification results, where the highest values indicate better performance.
Metric Cross Entropy Loss
Intra-Class Pair Loss
(Ours 1)
Intra-Class Triplet Loss
(Ours 2)
Accuracy 0.9152 0.9306 0.9317
Average Recall 0.9082 0.9306 0.9301
Average Precision 0.9178 0.9334 0.9335
Average F-score 0.9133 0.9298 0.93
Table 2: DGCNN model retrieval results with labels as relevance measure, where the highest values indicate better perfor-
mance.
Top - K Cross Entropy Loss Contrastive Loss Triplet Loss
Intra-Class Pair
Loss (Ours 1)
Intra-Class Triplet
Loss (Ours 2)
5 0.9120 0.9139 0.9191 0.9239 0.9210
10 0.9025 0.9063 0.9115 0.9150 0.9102
15 0.8953 0.8991 0.9055 0.9062 0.9035
20 0.8857 0.8945 0.9005 0.8997 0.8969
Figure 9: Confusion matrix for DGCNN network trained by
the proposed triplet loss.
contrastive and triplet loss.
Furthermore, the model retrieval task with cham-
fer distance as a relevance metric is examined in Table
3. When compared to all three baselines, the proposed
pair and triplet losses are substantially superior, with
the proposed intra-class pair loss being slightly bet-
ter. The nearest loss in performance to our losses is
the cross entropy loss. The lack of a term dedicated
to addressing intra-class variance in both the original
formulations of contrastive and triplet losses hinders
performance on this objective.
4.5 Qualitative Results
Figure (10) shows an example of model retrieval re-
sults using the Chamfer distance as a measure of rel-
evance. Figure(10a) represents the query model for
which the most similar counterparts in the dataset
should be retrieved. Figure (10) is the ground truth
nearest neighbors to the query model PCD with
Chamfer distance as a similarity measure. Fig-
ure (10) demonstrate retrieved objects using cross-
entropy loss. The retrieved models, as shown in the
figure, belong to the same class, but they are not struc-
turally or visually similar, and none of them is a mem-
ber of the ground truth query. The obtained results
based on the proposed intra-class pair loss are quite
visually similar to the query model, as shown in fig-
ure (10). The first four models retrieved are members
of the ground truth query, whereas the fifth model re-
trieved is not part of the ground truth query. Despite
the fact that the last retrieval is incorrect, it has a tol-
erable visual resemblance to the query model. Thus,
figure (10) supports our hypothesis that a loss func-
tion that accounts for intra-class variance improves
model retrieval results.
5 DISCUSSION AND FUTURE
WORK
According to empirical results, the network has issues
in distinguishing PCDs from classes that are struc-
turally similar, such as the class pairs (nightstand,
dresser) and (table, desk), and can not provide suffi-
cient separation between them. The difficulty arises
as these class pairs have visually similar instances
that are difficult to distinguish even by humans. To
solve this deficiency, a more extensive structural com-
parison between these related instances is necessary.
As a result, in future work, a network pre-trained for
the part segmentation task or jointly trained for part
segmentation will be investigated. This suggestion
is based on the notion that the increased level of in-
Deep Distance Metric Learning for Similarity Preserving Embedding of Point Clouds
579
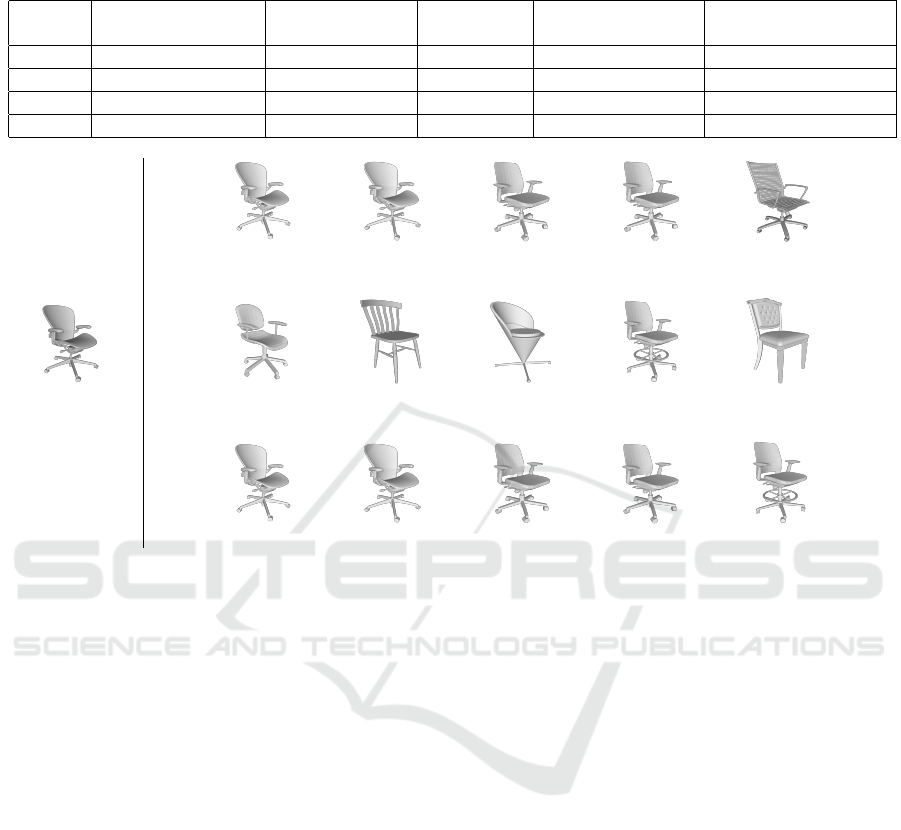
Table 3: DGCNN model retrieval results with Chamfer distance as relevance measure, where the highest values indicate better
performance.
Top - K Cross Entropy Loss Contrastive Loss Triplet Loss
Proposed Pair Loss
(Ours 1)
Proposed Triplet Loss
(Ours 2)
5 0.6531 0.5974 0.5178 0.6986 0.6951
10 0.6837 0.6363 0.5698 0.7200 0.7152
15 0.6924 0.6417 0.5764 0.7287 0.7271
20 0.6989 0.6479 0.5770 0.7329 0.7311
(a) Query
(b) Ground Truth Retrieved Objects
(c) Retrieved Object using Cross Entropy Loss
(d) Retrieved Object using Proposed Intra-Class Pair Loss
Figure 10: Model retrieval results with Chamfer distance as relevance measure under different loss functions. Note: the
qualitative results for the proposed triplet loss were excluded, since intra-class pair loss showed slightly better performance.
formation captured during part segmentation can em-
phasize the structural differences between similar in-
stances from different classes.
In addition, we suggest using clustering to sim-
plify the similarity-aware embedding task. This sim-
plification is designed to eliminate the combinatorial
nature of the proposed embedding task. The combina-
torial nature comes from the fact that altering weights
based on a mini-batch affects the network objective
for all remaining instances. We propose establishing
intra-class clusters based on the similarity between in-
stances from the same class to simplify this problem.
To begin, a graph is constructed, with each PCD in
the class representing a node and edge weights pro-
portional to the RBF kernel of the Chamfer distance
between the two PCDs connected by the edge. This
graph can be clustered using spectral graph clustering,
which searches for the optimal graph cut to cluster the
graph. Finally, the network objective is revised to par-
tition the features space into intra-class clusters sepa-
rated by an intra-class margin, as well as, separating
different classes by at least a distance of a margin.
6 CONCLUSION
In this work, two novel loss functions are proposed
by modifying contrastive and triplet loss formula-
tions to include a term that handles intra-class vari-
ance and generates PCD embeddings that respect the
Chamfer distance between PCDs from the same class.
DGCNN is the network of choice for this work since
it dynamically generates local knn − graphs across
the PCD, encapsulating local neighborhoods and fea-
tures at each layer. Results demonstrate that DGCNN
trained with either of the proposed loss functions out-
performs all baselines in classification, label-based
model retrieval, and similarity-based model retrieval
due to the quantitatively and qualitatively enhance-
ment of embedding.
REFERENCES
Arandjelovic, R., Gronat, P., Torii, A., Pajdla, T., and Sivic,
J. (2016). Netvlad: Cnn architecture for weakly super-
vised place recognition. In Proceedings of the IEEE
VISAPP 2023 - 18th International Conference on Computer Vision Theory and Applications
580

conference on computer vision and pattern recogni-
tion, pages 5297–5307.
Bai, Y., Ding, H., Qiao, Y., Marinovic, A., Gu, K., Chen,
T., Sun, Y., and Wang, W. (2019). Unsupervised in-
ductive graph-level representation learning via graph-
graph proximity. arXiv preprint arXiv:1904.01098.
Chatpatanasiri, R., Korsrilabutr, T., Tangchanachaianan, P.,
and Kijsirikul, B. (2010). A new kernelization frame-
work for mahalanobis distance learning algorithms.
Neurocomputing, 73(10-12):1570–1579.
Dey, S., Dutta, A., Toledo, J. I., Ghosh, S. K., Llad
´
os, J.,
and Pal, U. (2017). Signet: Convolutional siamese
network for writer independent offline signature veri-
fication. arXiv preprint arXiv:1707.02131.
Em, Y., Gag, F., Lou, Y., Wang, S., Huang, T., and Duan, L.-
Y. (2017). Incorporating intra-class variance to fine-
grained visual recognition. In 2017 IEEE Interna-
tional Conference on Multimedia and Expo (ICME),
pages 1452–1457. IEEE.
Hadsell, R., Chopra, S., and LeCun, Y. (2006). Dimen-
sionality reduction by learning an invariant mapping.
In 2006 IEEE Computer Society Conference on Com-
puter Vision and Pattern Recognition (CVPR’06), vol-
ume 2, pages 1735–1742. IEEE.
Harman, D. K. (1993). The first text retrieval conference
(TREC-1), volume 500. US Department of Com-
merce, National Institute of Standards and Technol-
ogy.
Hoffer, E. and Ailon, N. (2015). Deep metric learn-
ing using triplet network. In International workshop
on similarity-based pattern recognition, pages 84–92.
Springer.
Melekhov, I., Kannala, J., and Rahtu, E. (2016). Siamese
network features for image matching. In 2016 23rd in-
ternational conference on pattern recognition (ICPR),
pages 378–383. IEEE.
Mescheder, L., Oechsle, M., Niemeyer, M., Nowozin, S.,
and Geiger, A. (2019). Occupancy networks: Learn-
ing 3d reconstruction in function space. In Proceed-
ings of the IEEE/CVF Conference on Computer Vision
and Pattern Recognition, pages 4460–4470.
Nazir, D., Afzal, M. Z., Pagani, A., Liwicki, M., and
Stricker, D. (2021). Contrastive learning for 3d point
clouds classification and shape completion. Sensors,
21(21):7392.
Park, J. J., Florence, P., Straub, J., Newcombe, R., and
Lovegrove, S. (2019). Deepsdf: Learning continuous
signed distance functions for shape representation. In
Proceedings of the IEEE/CVF Conference on Com-
puter Vision and Pattern Recognition, pages 165–174.
Peng, S., Niemeyer, M., Mescheder, L., Pollefeys, M.,
and Geiger, A. (2020). Convolutional occupancy net-
works. In European Conference on Computer Vision,
pages 523–540. Springer.
Qi, C. R., Su, H., Mo, K., and Guibas, L. J. (2017a). Point-
net: Deep learning on point sets for 3d classification
and segmentation. In Proceedings of the IEEE con-
ference on computer vision and pattern recognition,
pages 652–660.
Qi, C. R., Yi, L., Su, H., and Guibas, L. J. (2017b). Point-
net++: Deep hierarchical feature learning on point sets
in a metric space. Advances in neural information pro-
cessing systems, 30.
Schroff, F., Kalenichenko, D., and Philbin, J. (2015).
Facenet: A unified embedding for face recognition
and clustering. In Proceedings of the IEEE conference
on computer vision and pattern recognition, pages
815–823.
Szegedy, C., Liu, W., Jia, Y., Sermanet, P., Reed, S.,
Anguelov, D., Erhan, D., Vanhoucke, V., and Rabi-
novich, A. (2015). Going deeper with convolutions.
In Proceedings of the IEEE conference on computer
vision and pattern recognition, pages 1–9.
Uy, M. A. and Lee, G. H. (2018). Pointnetvlad: Deep point
cloud based retrieval for large-scale place recognition.
In Proceedings of the IEEE conference on computer
vision and pattern recognition, pages 4470–4479.
Wang, J., Song, Y., Leung, T., Rosenberg, C., Wang, J.,
Philbin, J., Chen, B., and Wu, Y. (2014). Learning
fine-grained image similarity with deep ranking. In
Proceedings of the IEEE conference on computer vi-
sion and pattern recognition, pages 1386–1393.
Wang, J., Zhou, F., Wen, S., Liu, X., and Lin, Y. (2017).
Deep metric learning with angular loss. In Proceed-
ings of the IEEE international conference on com-
puter vision, pages 2593–2601.
Wang, Y., Sun, Y., Liu, Z., Sarma, S. E., Bronstein, M. M.,
and Solomon, J. M. (2019). Dynamic graph cnn
for learning on point clouds. Acm Transactions On
Graphics (tog), 38(5):1–12.
Wen, Y., Zhang, K., Li, Z., and Qiao, Y. (2016). A discrim-
inative feature learning approach for deep face recog-
nition. In European conference on computer vision,
pages 499–515. Springer.
Wu, Z., Song, S., Khosla, A., Yu, F., Zhang, L., Tang, X.,
and Xiao, J. (2015). 3d shapenets: A deep representa-
tion for volumetric shapes. In Proceedings of the IEEE
conference on computer vision and pattern recogni-
tion, pages 1912–1920.
Xing, E., Jordan, M., Russell, S. J., and Ng, A. (2002).
Distance metric learning with application to cluster-
ing with side-information. Advances in neural infor-
mation processing systems, 15.
Xu, W. (2021). Deep large margin nearest neighbor
for gait recognition. Journal of Intelligent Systems,
30(1):604–619.
Deep Distance Metric Learning for Similarity Preserving Embedding of Point Clouds
581
