
Local Forward-Motion Panoramic Views for Localization and Lesion
Detection for Multi-Camera Wireless Capsule Endoscopy Videos
Marina Oliveira
1,2 a
and Helder Araujo
1,2 b
1
Institute of Systems and Robotics, University of Coimbra, Coimbra, Portugal
2
Department of Electrotechnical Engineering, University of Coimbra, Coimbra, Portugal
Keywords:
Computer Vision, Forward-Motion Panorama, Optical Flow, Wireless Capsule Endoscopy.
Abstract:
Understanding Wireless Capsule Endoscopy videos is a challenging process since it demands a substantial
amount of time and expertise to recognise and accurately interpret findings. The low lesion detection rate with
this technology is mainly attributed to the poor image quality of the retrieved frames, the large sets of image
data information to process and the time constraints. To overcome these limitations, in this paper, we explore
a methodology for constructing local forward-motion panoramic overviews to condense valuable information
for lesion detection and localization procedures.
1 INTRODUCTION
Each average eight-hour Wireless Capsule Endoscopy
(WCE) video comprises approximately fifty thousand
frames (Spyrou et al., 2013). The viewing time with
its specific software can take up to several hours of
undivided attention for the clinician to accurately de-
tect, distinguish and localize large varieties of gas-
trointestinal (GI) lesions along the GI tract.
Another main limitation is the poor image quality
of the retrieved frames, which results in a detection
rate as low as 40% (Spyrou et al., 2013).
Some approaches for reducing reading time and
increasing detection rates have already been proposed
throughout the years and are mainly focused on the
selection of the most representative frames (MRF)
for video summarization. Although these solutions
are limited, the RAPID Reader Software, for exam-
ple, allows the view of multiple consecutive frames
for clinicians to examine more than one frame in one
sitting. The QuickView algorithm also provides a
fast-highlighted preview of WCE videos by present-
ing them with high frame rates in stable image se-
quences and lower frame rates in regions where sud-
den changes occur (Spyrou et al., 2013). Another
approach called epitomized summarization is able to
downsize the number of frames up to 10% by creat-
ing epitomes from a compilation of classified frames
a
https://orcid.org/0000-0001-9271-0357
b
https://orcid.org/0000-0002-9544-424X
based on ground truth data of abnormal tissue and/or
artefacts (Iakovidis et al., 2010).
Another main limitation of this technology is the
limited field of view. The viewing angle of a camera is
determined by the amount of light that crosses its lens
(T
ˇ
rebick
´
y et al., 2016). A small viewing angle pro-
vides the clinician with a small viewing domain for
the examination, which also lowers the detection rate
(Swain, 2003). The viewing angles of current com-
mercial camera capsules vary from 140 to 170 degrees
(Brown and Jayatissa, 2020). Recent capsules intend
to overcome this limitation by offering more than one
camera in one capsule, for example, two cameras at
opposing ends.
In order to offer a broader field of view and an in-
creased area of analysis without hardware alterations,
the construction of a panoramic image of the full
trajectory or a panoramic image of local regions of
interest could be a solution. Ultimately, by taking
advantage of the fact that the multiple cameras of
the same capsule register the same tissue structures,
a more robust panoramic result could be achieved.
A panorama of the full trajectory or multiple local
panoramic views in regions of interest could provide
an overview of the GI tract, lower the viewing time
and optimize lesion detection rates.
The construction of a full panorama involves
the reconstruction of the specific surface geometry
and the corresponding motion estimation (Yoshimoto
et al., 2020). The chosen approach for the proce-
dure may vary depending on how the video or the
Oliveira, M. and Araujo, H.
Local Forward-Motion Panoramic Views for Localization and Lesion Detection for Multi-Camera Wireless Capsule Endoscopy Videos.
DOI: 10.5220/0011626600003414
In Proceedings of the 16th International Joint Conference on Biomedical Engineering Systems and Technologies (BIOSTEC 2023) - Volume 3: BIOINFORMATICS, pages 41-50
ISBN: 978-989-758-631-6; ISSN: 2184-4305
Copyright
c
2023 by SCITEPRESS – Science and Technology Publications, Lda. Under CC license (CC BY-NC-ND 4.0)
41

set of sequential images are obtained since it deter-
mines the geometry of the problem (Cao et al., 2018).
In most cases of panoramic view construction, the
dataset video is recorded with a single camera that un-
dergoes pure rotation motion around its optical axis.
In other cases, the data is a set of images with over-
lapping domains acquired from multiple cameras that
are then stitched into a wide-view panorama. In cases
such as the ones with endoscopic capsules, where the
videos are acquired by one or more cameras from
a capsule that moves ideally with pure translation
along the optical axis, the goal is to identify and ex-
tract the overlapping radial domains from each frame
and stitch them to obtain a forward-motion panorama.
(Cao et al., 2018).
In this paper, we explore a methodology to over-
come the above-mentioned limitations through the
construction of a local panoramic view. We present
the steps towards a robust solution taking into account
the geometry of this problem and the specificity that
comes with working with WCE videos.
1.1 Paper Organization
In the related work section, we survey several at-
tempts to construct panoramas given a forward-
motion camera inside a tubular structure, both in the
medical imaging field and other fields with a similiar
problem geometry. In the experimental dataset sec-
tion, we discuss the initial set of multi-camera WCE
videos and the reasons behind the need to create a
synthetic model for this problem. In the methodol-
ogy section, we present the principles that our pro-
cedure was based on, describe the concrete steps we
took to build a local forward-motion panorama and
we present the evaluation metrics chosen to assess the
result. Then, in the results and discussion section,
we present the output of each step of the previously
described methodology and consider the alternative
paths we could have chosen. The conclusion provides
a brief overview of the work developed in this paper
and, most importantly, the future work that can be de-
veloped from the first steps taken by our approach.
2 RELATED WORK
Previous approaches for the generation of panorama
images of tubular-shaped organs focus on 2D im-
ages from the oesophagus (Kim et al., 1995)(Seibel
et al., 2008). These methods use a tubular model such
as cylindrical projection because the capsule moves
along the optical axis. The 2D frames are unwrapped
around a previously computed centre of projection.
Then, given the camera motion estimation between
sequential frames with an optical flow approach, the
projections were mapped into a cylindrical surface.
Behrens et al. developed an image mosaicing al-
gorithm for local panorama construction from blad-
der video sequences in fluorescence conventional en-
doscopy. The image information was extracted and
an affine parameter model with iterative optimiza-
tion was adopted to determine the best image trans-
form given mean squared error measurements. Some
visual artefacts were inevitably produced by non-
homogeneous lighting and were compensated in the
stitching step with a mutual linear interpolation func-
tion (Behrens, 2008). Five years later, Spyrou et
al. proposed an approach that presents an automati-
cally assembled visual summary using WCE videos
based on the idea of pipe projection proposed by
Rousso et al. The frames are geometrically trans-
formed with feature matching techniques and stitched
together to construct a panoramic image. Ideally, the
construction of a panoramic image enables the view-
ing of multiple frames simultaneously and provides a
broader field of view without information loss (Spy-
rou et al., 2013).
Given the similarity in geometry, some geologi-
cal engineering approaches to study structural char-
acteristics and spatial distribution patterns of fissures
in rock masses may be valuable to consider. As
with capsule endoscopy, the feature extraction pro-
cess in these images is challenging since the datasets,
Axial View Panoramic Borehole Televiewer (APBT)
videos, also have poor image quality. The probe used
for the forward-motion along the tube generates a
slight rotation so its trajectory is not strictly trans-
lational along the central axis of the borehole. Cao
et al. proposed, in 2018, an approach for the con-
struction of an unfolded image of a borehole from
APBT videos. Firstly, an algorithm for the automatic
location of the centre is based on the circularity of
annular borehole images, then the annular image se-
quences are unfolded with Daugman’s rubber sheet
model (RSM) and an interpolation algorithm. The un-
folded image sequences are then fused to generate an
unfolded panoramic image with a projection registra-
tion algorithm (Cao et al., 2018).
K. Yoshimoto et al. developed a prototype stereo
endoscopy with a compound eye system named Thin
Observation Module by Bound Optics (TOMBO)
which allows for the depth mapping of each point
from the 2D frames to produce 3D data. Later, K.
Yoshimoto et al. proposed a procedure to acquire 3D
panorama images of the oesophagus from conven-
tional endoscopy. The methodology comprised the
acquisition of a sequential set of frames from the GI
BIOINFORMATICS 2023 - 14th International Conference on Bioinformatics Models, Methods and Algorithms
42
tract with an endoscope, the reconstruction of the cor-
responding 3D surfaces, and the estimation of its po-
sition using scene flow and surface merging. This ap-
proach improves the quality of the frames by reduc-
ing the number of missing points from low resolution
and stereo matching failures. The method was ini-
tially validated with a phantom for the size estimation
of the texture and the moving distance and later with
a pig oesophagus (Yoshimoto et al., 2020).
3 EXPERIMENTAL DATASET
The goal is to obtain the local panoramic views from
the consecutive frames of WCE videos from patients
with Crohn’s disease obtained specifically from the
multi-camera capsule PillCam Colon2.
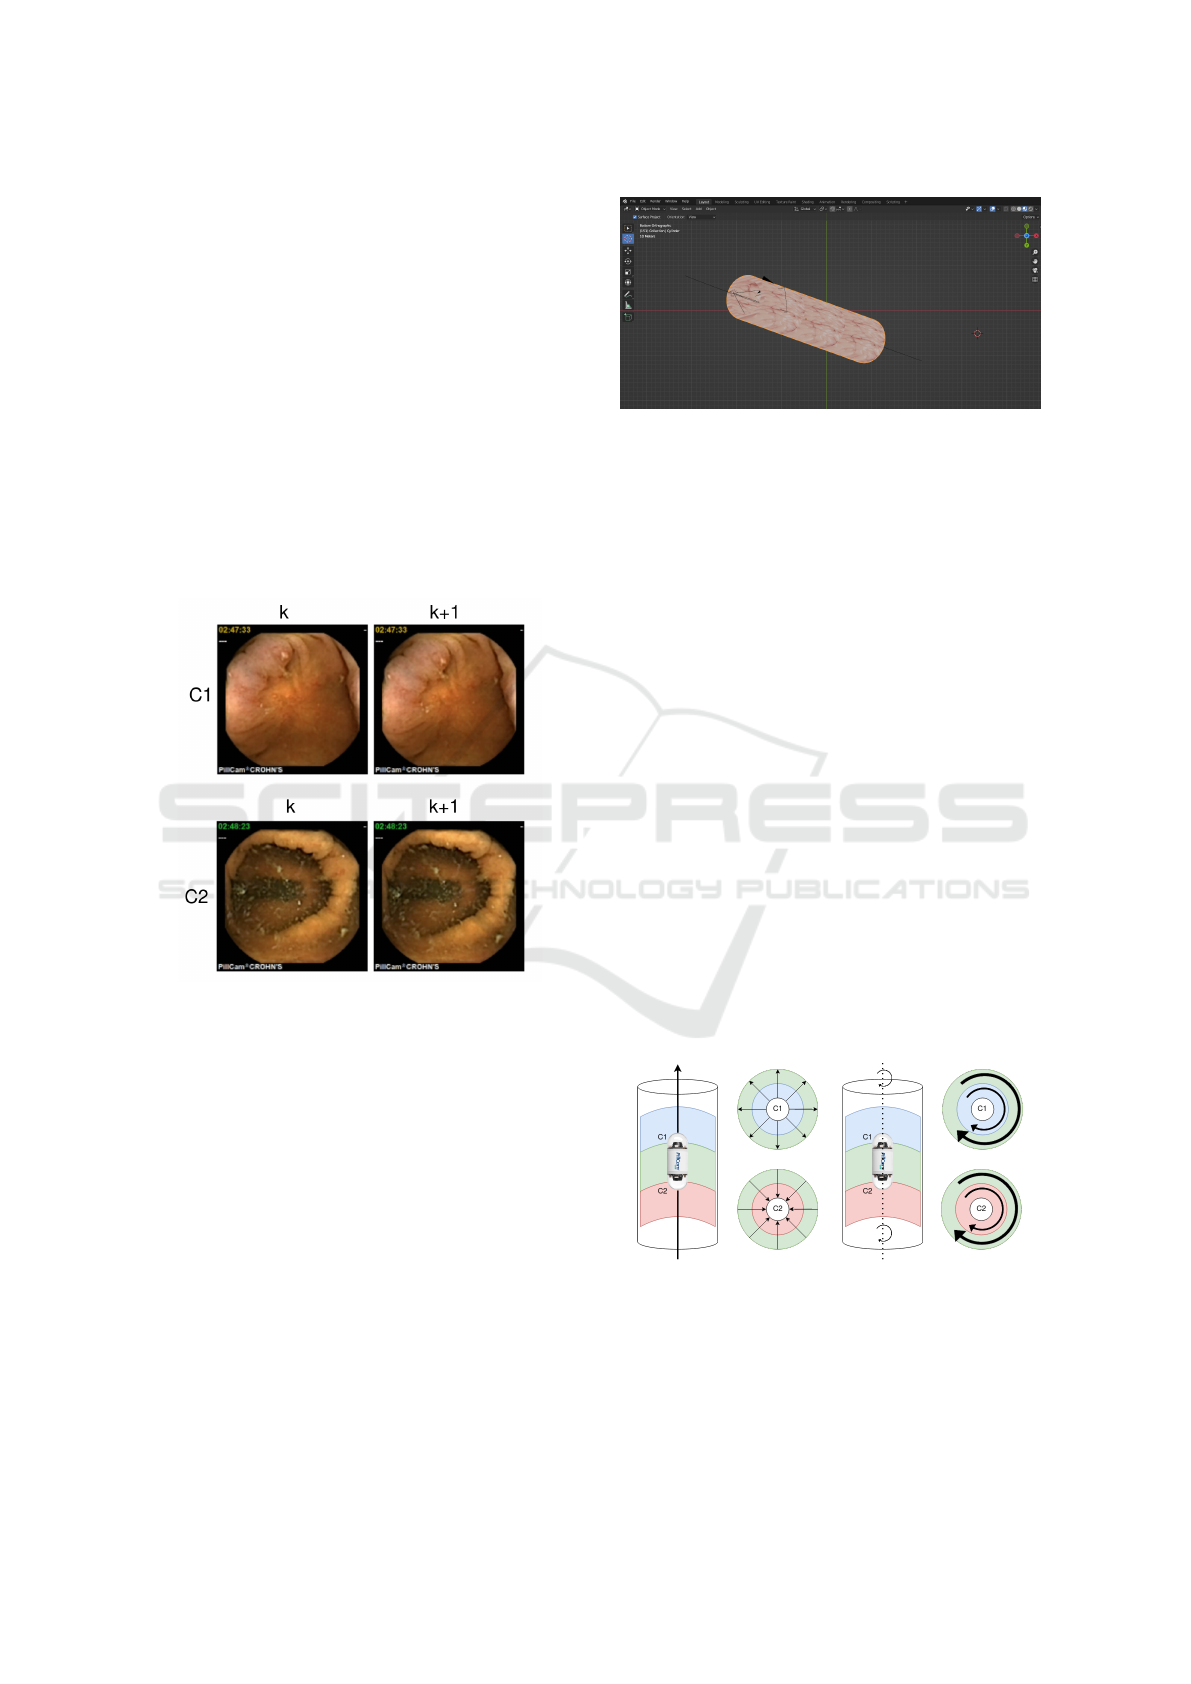
Figure 1: Example sample of sequential frames (k and k+1)
from a patient’s exam video, obtained with the front and
back camera (C1 and C2) of a PillCam Colon2 capsule.
At this stage, a synthetic dataset for an initial proof
of concept was constructed in order to provide ground
truth information regarding motion. For this reason, a
colon-like texture tubular model was created with the
Blender Software given a few restrictions.
The model which consisted of a hollow tubular
structure was created with the projection of textured
portions of the images from the above-mentioned
videos on the inside. A straight path was also created
passing through the inside of the tube for the construc-
tion of the animation. Two cameras were coupled but
placed facing opposing directions and added at one
end of the tube. Each camera was coupled with a light
source as to follow the pre-defined path. In this way,
as with capsule endoscopy videos, the animation of
the purely translational displacement of each camera
Figure 2: Tubular model, created with the Blender Soft-
ware, with colon-like textured walls, two opposing cameras
coupled with light sources animated along a pure translation
trajectory.
is rendered with lighting condition variations as a re-
sult of a light source that accompanies the motion of
the camera. This model allowed us to divide the entire
procedure of building a panoramic view into smaller
steps.
4 METHODOLOGY
Although we can simplify the geometry of the prob-
lem by thinking of the interior of the colon as a cylin-
drical tube, unlike the conventional endoscopic or ge-
ological exploration probes mentioned in the related
work section, the capsule does not move in a purely
translational way along the optical axis. As we can
see in Figure 3, when the capsule is in pure transla-
tion motion along its optical axis, the displacement
of the pixels in sequential frames is radial, pointing
outwards during forward motion and inwards during
backward motion. On the other hand, when the cap-
sule undergoes pure rotation around its optical axis,
the displacement of pixels from sequential frames can
be described as clockwise/counterclockwise motion.
Figure 3: Relationship between the motion of the camera
along the tubular-like organ (pure translation represented on
the left and pure rotation on the right) and the corresponding
pixel displacement between sequential frames for both front
and back camera.
Since the movement of the capsule inside the
colon is the result of the peristaltic movements of
Local Forward-Motion Panoramic Views for Localization and Lesion Detection for Multi-Camera Wireless Capsule Endoscopy Videos
43
the tissue, its displacement will be composed of pe-
riods of pure translation along the optical axis, peri-
ods of pure rotation around its optical axis and peri-
ods when it translates and rotates at the same time.
Given the geometry of the problem, since the sequen-
tial frames associated with the pure rotation of the
capsule around its optical axis do not offer additional
information for the panoramic view, we are only in-
terested in consecutive frames associated with pure
translation motion.
Since forward motion and zoom can be handled
well with the generalized pipe representation pro-
posed by Rousso et al.(Rousso et al., 1998), shown
in Figure 4, our approach is also based on those
core principles with a few constraints and adaptations
given the specificity of our datasets.
4.1 Generalized Pipe Representation
To transform the representation from the radial dis-
placement of the image pixels into parallel displace-
ment, it is possible to project the 2D planar image
onto a 3D cylinder, with pipe projection.
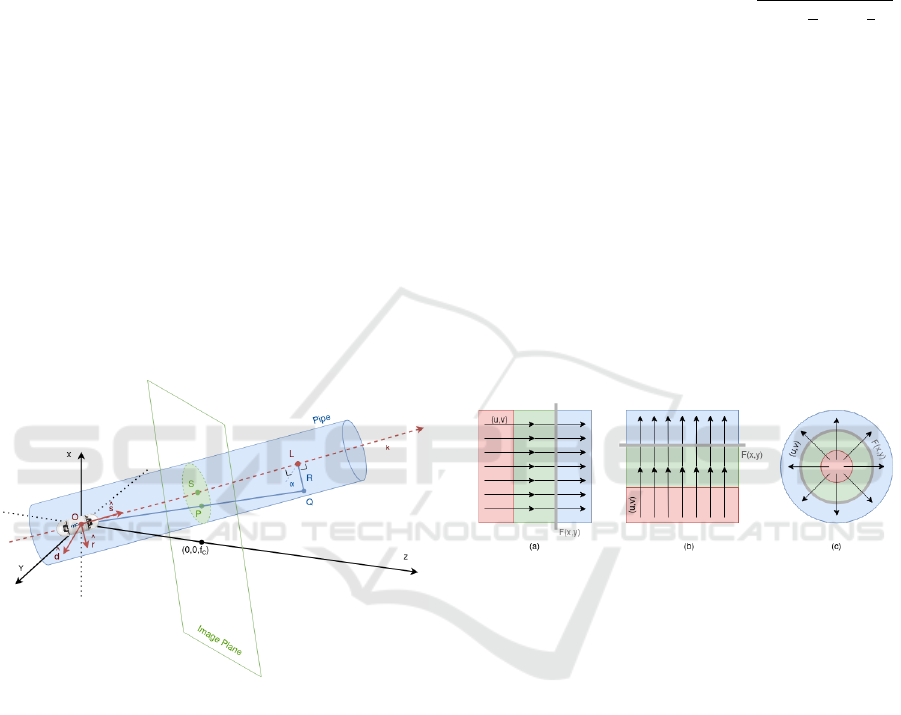
Figure 4: Diagram illustrating the projection of a 2D planar
image (image plane) onto a 3D cylinder (pipe): s = S/|S|
is the axis of the pipe; R is the radius; O = (0,0,0) is the
optical center; S = (s
x
,s
y
, f
c
) is the focus of expansion; f
c
is
the focal length and Q is the projection on the pipe of each
point P = (x, y, f
c
) from the plane.
The axis of the pipe s = S/|S| is chosen so that it
passes through the optical center O = (0,0,0) and the
focus of expansion (FOE) S = (s
x
,s
y
, f
c
), with f
c
as
the focal length (Rousso et al., 1998).
Each point Q is the projection of each original
point P = (x,y, f
c
), distanced from the axis s by the
radius R of the pipe, and collinear with both P and O.
Given k as the position along the axis ˆs, with
ˆ
d and
ˆr as unit vectors chosen to form a cartesian coordinate
system together with ˆs and α as the angle from
ˆ
d, the
3D position of a point Q on the pipe is expressed in
Equation (1) (Rousso et al., 1998).
Q = (Q
x
,Q
y
,Q
z
) = k ˆs + Rcos(α)
ˆ
d + Rsin(α)ˆr (1)
Since the pixels whose original distance from s
is less than R become magnified and the pixels with
greater distance than R shrink once projected on the
pipe, selecting the radius as R =
q
f
2
c
+ (
w
2
)
2
+ (
h
2
)
2
,
where w is the width and h is the height of the im-
age, preserves the geometry and resolution of the im-
age. The resolution decreases as |Q
z
− f
c
|, so it is best
preserved around the intersection of the pipe with the
image plane (Q
z
= f
c
) (Rousso et al., 1998).
4.2 Pipe Mosaicing
Given two corresponding points P
k
= (x
k
,y
k
) in im-
age I
k
and P
k+1
= (x
k+1
,y
k+1
) in images I
k+1
, the
flow vector (u,v) is a function of the position (x
k
,y
k
).
The scanning broom chosen for the mosaicing pro-
cess must be a curve F(x,y) = 0 perpendicular to the
optical flow and as close as possible to the centre of
the image in order to minimize lens distortion.
Figure 5: Given OF as a function of the position, the scan-
ning broom F(x,y) = 0 chosen for the mosaicing process
must be perpendicular to (u,v): (a) F(x,y) is a vertical
straight line for uniform horizontal OF; (b) F(x,y) is a hor-
izontal straight line for uniform vertical OF; (c) F(x,y) is a
circumference centred around the FOE for radial OF.
If the optical flow is horizontal, F(x, y) is a verti-
cal straight line, as shown in Figure 5a); with vertical
optical flow, F(x,y) is a horizontal straight line, as
shown in Figure (5)b); and if the optical flow repre-
sents zoom or forward motion, F(x,y) is a circumfer-
ence around the centre of the FOE, as shown in Figure
5c) (Rousso et al., 1998).
4.3 Coordinate System Transformation
Since straight optical flow and straight scanning
brooms are simpler to operate during the mosaicing
process, the sequential frames were converted from
cartesian coordinates to polar coordinates, as shown
in Figure 6. Given a known FOE and the relation-
ship between cartesian and polar coordinates, shown
in Equation (2), a rectangular image can be converted
BIOINFORMATICS 2023 - 14th International Conference on Bioinformatics Models, Methods and Algorithms
44
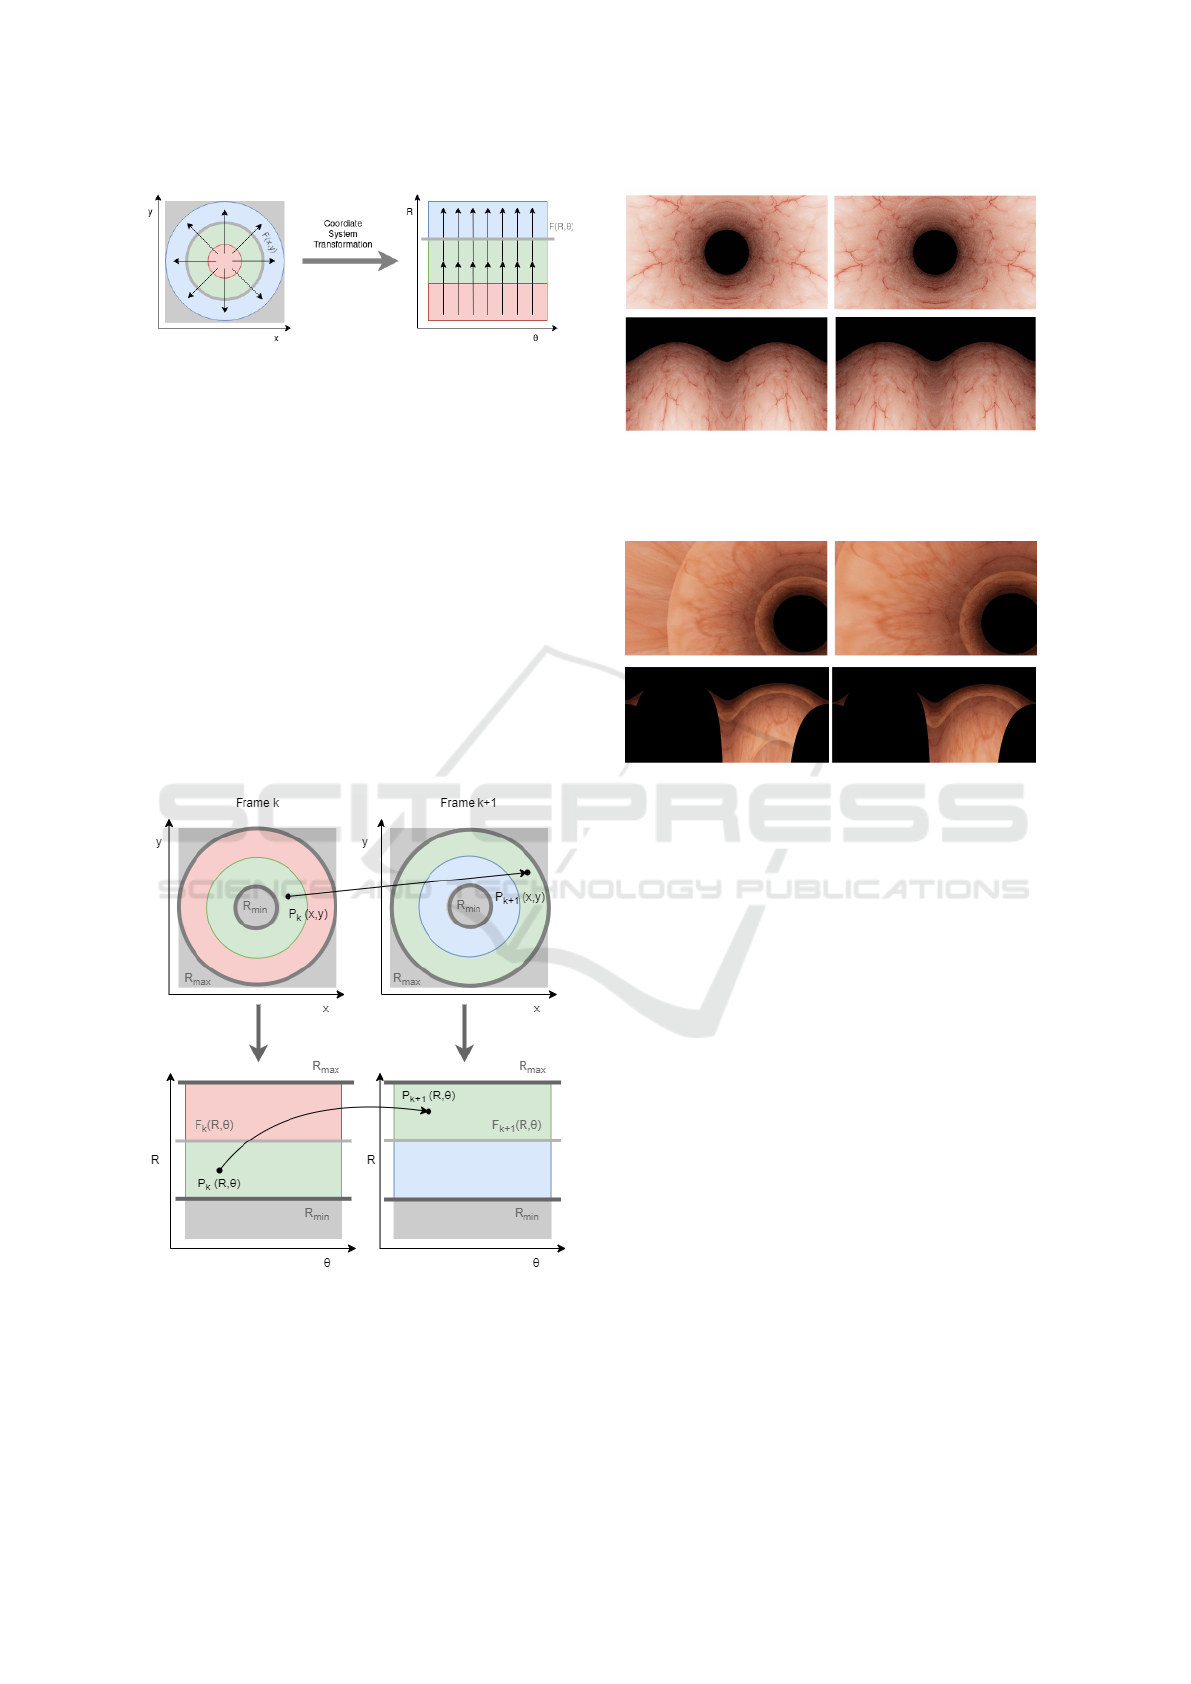
Figure 6: Coordinate system conversion from cartesian to
polar image coordinates (with a central FOE) in order to
obtain frames with a straight optical flow pattern and apply
a straight scanning broom in the mosaicing process.
into a polar image with radius r and angular coordi-
nate θ.
(
x = rcos(θ)
y = rsin(θ)
(2)
For this case, each channel of each RGB frame
is converted from cartesian to polar coordinates with
a bilinear interpolation algorithm to interpolate be-
tween points that do not exactly lay in the image.
Then, each channel converted to polar coordinates is
coupled to obtain the final RGB polar frame. This
process is repeated for each sequential frame, as
shown in Figure 7.
Figure 7: Diagram illustration of the difference between
a point correspondence between two sequential cartesian
frames and the corresponding two sequential polar frames
after the coordinate system conversion (with a central FOE).
Figure 8: Sample example of two consecutive frames ren-
dered from the colon-like synthetic blender model and the
corresponding two sequential polar frames after the coordi-
nate system conversion with a central FOE.
Figure 9: Sample example of two consecutive frames ren-
dered from the colon-like synthetic blender model and the
corresponding two sequential polar frames after the coordi-
nate system conversion with a non-central FOE.
4.4 Image Registration from Optical
Flow with the RAFT Network
In our previous assessment (Oliveira et al., 2021),
from the approaches explored to find robust cor-
respondences between consecutive frames of WCE
videos, we found that the best results were obtained
with matches computed from the optical flow results
estimated with deep learning. For this paper, we used
the RAFT network (Teed and Deng, 2021) to compute
the flow vectors to determine the matches for the im-
age registration process between sequential frames of
the video.
Optical flow is the result of the per-pixel motion
estimation between video frames. Given a pair of se-
quential frames, which in this case is a pair of im-
age frames previously converted into polar images, a
dense displacement field maps each pixel in one frame
to the corresponding coordinates in another.
This energy minimization problem sets a trade-
off between data and regularization terms. Existing
solutions still offer limitations regarding occlusions,
low-textured surfaces, fast-moving objects and mo-
tion blur. Unlike traditional approaches, with deep
Local Forward-Motion Panoramic Views for Localization and Lesion Detection for Multi-Camera Wireless Capsule Endoscopy Videos
45
learning, features and motion priors are learned in-
stead of handcrafted. This problem is not yet closed
since the design of architectures with faster and eas-
ier training procedures, better performances and ade-
quate generalization capabilities is still a necessity.
The Recurrent All-Pairs Field Transforms (RAFT)
is an optimization-based deep network architecture
created to obtain more robust optical flow estimates.
The three major components of the RAFT network
are the feature encoder, which extracts per-pixel fea-
tures per pixel using a convolution network, a correla-
tion layer, which calculates pixel similarity to produce
correlation volumes for all pairs of pixels, and a recur-
rent update operator, which is essentially an iterative
optimization algorithm that selects values from those
volumes and updates the flow field. (Teed and Deng,
2021) For this case, from each pair of consecutive po-
Figure 10: Sample example of two consecutive frames ren-
dered from the colon-like synthetic blender model and the
corresponding two sequential polar frames after the coordi-
nate system conversion with a non-central FOE.
lar frames, given the subset of points P
i
k
associated
with each pixel i from frame k, given the the optical
flow output (u
i
k
,v
i
k
) from the RAFT Network, the cor-
responding set of P
i
k+1
points coordinates in the con-
secutive frame were computed. This correspondence
of points is performed using a linear interpolation al-
gorithm, in order to be used as matching points for the
final panorama mosaicing.
4.5 Homography Matrix
Projective geometry studies the properties of a
projective plane IP
2
given a set of invertible linear
transformations of homogeneous coordinates that
map lines to lines. Under the mapping h: IP
2
→ IP
2
,
if three points x1, x2 and x3 lie on the same line, then
h(x1), h(x2) and h(x3) lie on the same line, thus pre-
serving collinearity (Hartley and Zisserman, 2003).
A mapping is a projectivity if and only if there exists
a non-singular 3x3 matrix H such that for any point in
IP
2
represented by a vector x it is true that
h(x) = Hx (3)
where H is the homography matrix. From the
nine elements of H, only eight ratios are independent,
so this transformation has eight degrees of freedom
(Hartley and Zisserman, 2003).
H
3×3
=
h
11
h
12
h
13
h
21
h
22
h
23
h
31
h
32
h
33
(4)
For this paper, for each pair of purely transla-
tional sequential polar frames, given the correspon-
dences (P
k
,P
k+1
) from the optical flow estimates with
the RAFT Network, a global homography H is ob-
tained. The computation is performed with Singular
Value Decomposition (SVD) and the random sample
consensus (RANSAC) algorithm for outlier removal.
P
k+1
= HP
k
(5)
Figure 11: Ideal mosaicing result given a perfect overlay
between the two corresponding points in both frame k and
k+1.
The final mosaic can be obtained by warping the
set of strips retrieved from the sequential images
given the point correspondences (Rousso et al., 1998).
Each strip must be warped to match the boundaries of
the previous stitched strips.
In our case, from the frame k, the strip bounded
by the two curves F
k
(r,θ) = 0 and F
′
k+1
(r,θ) = 0, as
shown in Figure 11, ensuring the continuity and non-
redundancy of the information, as the orthogonality
of the optical flow is assured. (Rousso et al., 1998).
BIOINFORMATICS 2023 - 14th International Conference on Bioinformatics Models, Methods and Algorithms
46
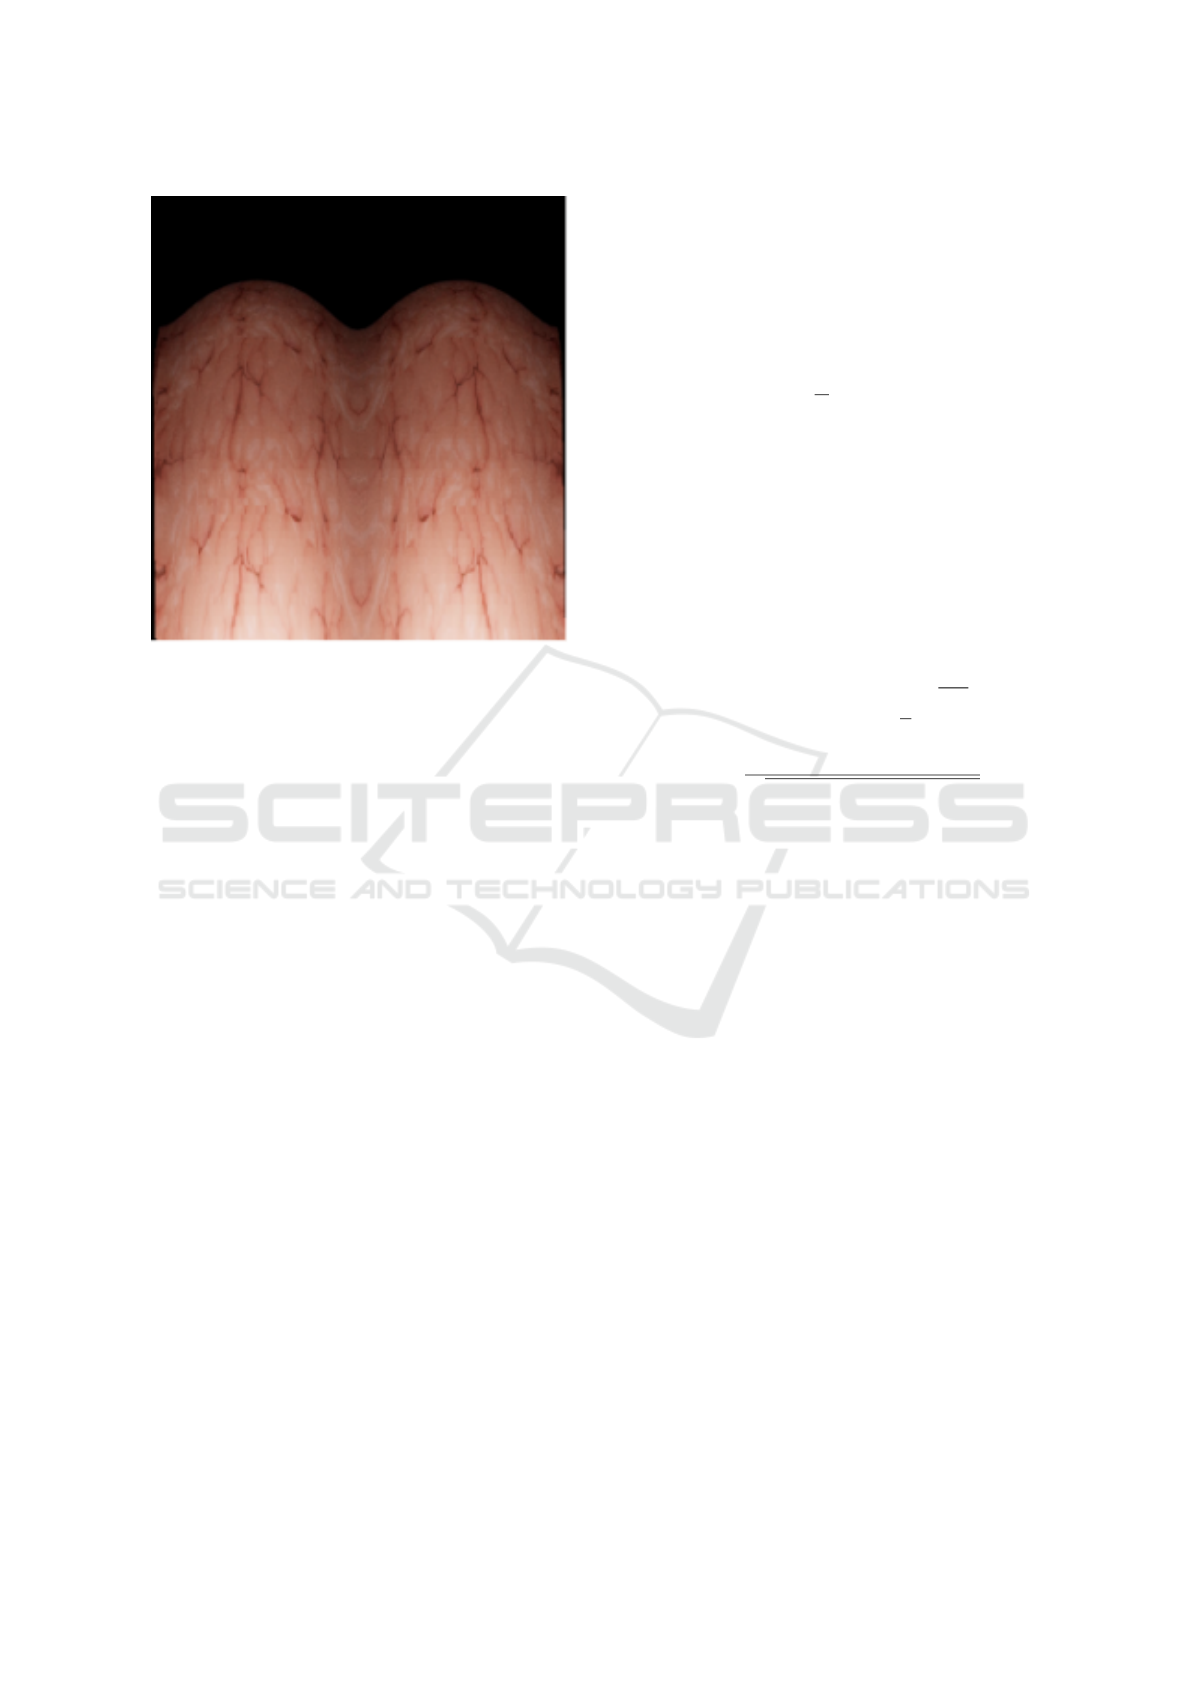
Figure 12: Final local forward-motion panorama obtained
from the mosaicing of all 30 pairs of consecutive polar
frames given one video rendered from the tubular Blender
model.
4.6 Image Registration Evaluation
1. Sum of Squared Differences (SSD): Given the
assumption that the only difference between two
registered images is Gaussian noise, the accuracy
of the registration method can be evaluated by the
intensity diference of the registered image pair,
for example, with the sum of squared differences.
SSD is sensitive to smaller samples with large in-
tensity differences (Song, 2017). In the case of
a forward-motion panorama, each image is reg-
istered to its previous one. For a transformation
h
i,i−1
that maps a point in image I
i
to point x in
I
i−1
, where R = [x1, x2, · · · , xN] is a subset of
points in I
i−1
, SSD can be computed, over the re-
gion R, as shown in Equation 6. For an ideal set
of registrations, SSD will equal zero.
SSD
i,R
=
x
N
∑
x=x
1
(I
i
(h
i,i−1
(x)) − I
i−1
(x))
2
(6)
2. Intensity Variance (IV): When a registration
method performs well, the registered image is as
close as possible to the target image and its aver-
age intensity image is the sharpest (Song, 2017).
To measure the sharpness of the average intensity
image is to compute the intensity variance of the
registered images. Given a transformation h
i,i−1
that maps a point in image I
i
to point x in I
i−1
,
where R = [x1, x2, · · · , xN] is a subset of points
in I
i−1
, the IV of image I
i
registered to image I
i−1
,
over the region R, is computed as expressed in
Equations 7 and 8. For an ideal registration, IV
will be equal to zero.
IV
i,R
(x) =
x
N
∑
x=x
1
(I
i−1
(h
i−1,i
(x)) − ave
i
(x))
2
(7)
ave
i
(x) =
1
N
x
N
∑
x=x
1
I
i
(h
i−1,i
(x)) (8)
3. Correlation Coefficient (CC): Assuming that the
intensity relationship between two registered im-
ages is linear, the correlation coefficient measures
its linear dependence (Song, 2017). With a trans-
formation h
i,i−1
that maps a point in image I
i
to
point x in I
i−1
, where R = [x1, x2, · · · , xN] is a
subset of points in I
i−1
, the CC of an image I
i
reg-
istered to image I
j
, over the region R,can be com-
puted with Equations 9-11. The ideal CC, given
a pair of perfectly registered images, is equal to
one.
d
i−1
(x) = I
i−1
(h
i−1,i
(x)) − I
i−1
(9)
d
i
(x) = I
i
(x) − I
i
(10)
CC
i,R
=
∑
x
N
x=x
1
d
i−1
(x)d
i
(x)
q
∑
x
N
x=x
1
d
i−1
(x)
2
∑
x
N
x=x
1
d
i
(x)
2
(11)
5 IMAGE QUALITY
ASSESSMENT
Image Quality Assessment (IQA) aims to quantify the
quality of an image in terms of human perception.
IQA algorithms are commonly used for the quality as-
sessment of compressed images. No-Reference (NR)
or blind IQA, focus on the estimation of the qual-
ity of a degraded or newly generated image given
no ground truth reference image or even the type of
processing the image is subjected to (Madhusudana
et al., 2022), which is the case with our local forward-
motion panorama.
A few CNN-based NR-IQA models have already
been developed in the past years, such as CN-
NIQA (Madhusudana et al., 2022), CONTRastive Im-
age QUality Evaluator (CONTRIQUE) (Kang et al.,
2014), and VIDGIQA (Guan et al., 2017).
For all three above-mentioned models, the higher
the value, the higher the quality of the image. In or-
der to have a quantitative evaluation of our final lo-
cal forward-motion panorama obtained after the polar
image stitching process, these NR-IQA models were
used and their values were computed for our image.
Local Forward-Motion Panoramic Views for Localization and Lesion Detection for Multi-Camera Wireless Capsule Endoscopy Videos
47
6 MOTION SEGMENTATION OF
MULTI-CAMERA WCE VIDEOS
To simplify the complex motion pattern of the capsule
in a real scenario and start with a simpler problem,
we will assume that rotation and translation do not
occur simultaneously. In the specific case of our pa-
tient dataset from the multi-camera capsule PillCam
Colon2, we have two cameras at opposing ends, so
when one of the cameras is performing a pure trans-
lational forward-motion, the other camera is undergo-
ing a pure translational backward motion.
In sequential frames, given the same time interval,
pixels will move radially for both cameras but their
displacement vectors will point inwards for one of the
cameras and outwards for the other. For this reason,
by analyzing the pixel displacement between sequen-
tial frames from both cameras at the same instant it is
possible to extract from the full video the frames that
correspond to the pure translation motion that allows
us to obtain a local panorama.
For this analysis, the optical flow between se-
quential frames from both cameras of the same cap-
sule was obtained with the RAFT network in order to
choose pure translational motion segments (Teed and
Deng, 2021).
7 RESULTS AND DISCUSSION
Figure 8 shows a sample pair of consecutive synthetic
frames obtained from the video rendered from the
Blender model and each corresponding polar repre-
sentation after the coordinate system conversion, pre-
sented in Equation 2, assuming a central FOE. Figure
9 shows another pair of two consecutive frames from
another video rendered from the Blender model with
a non-central but known FOE. In order to apply this
pipeline to a real-case scenario with the multi-camera
capsule images, a methodology needs to be developed
for the computation of the FOE in cases that are non-
central.
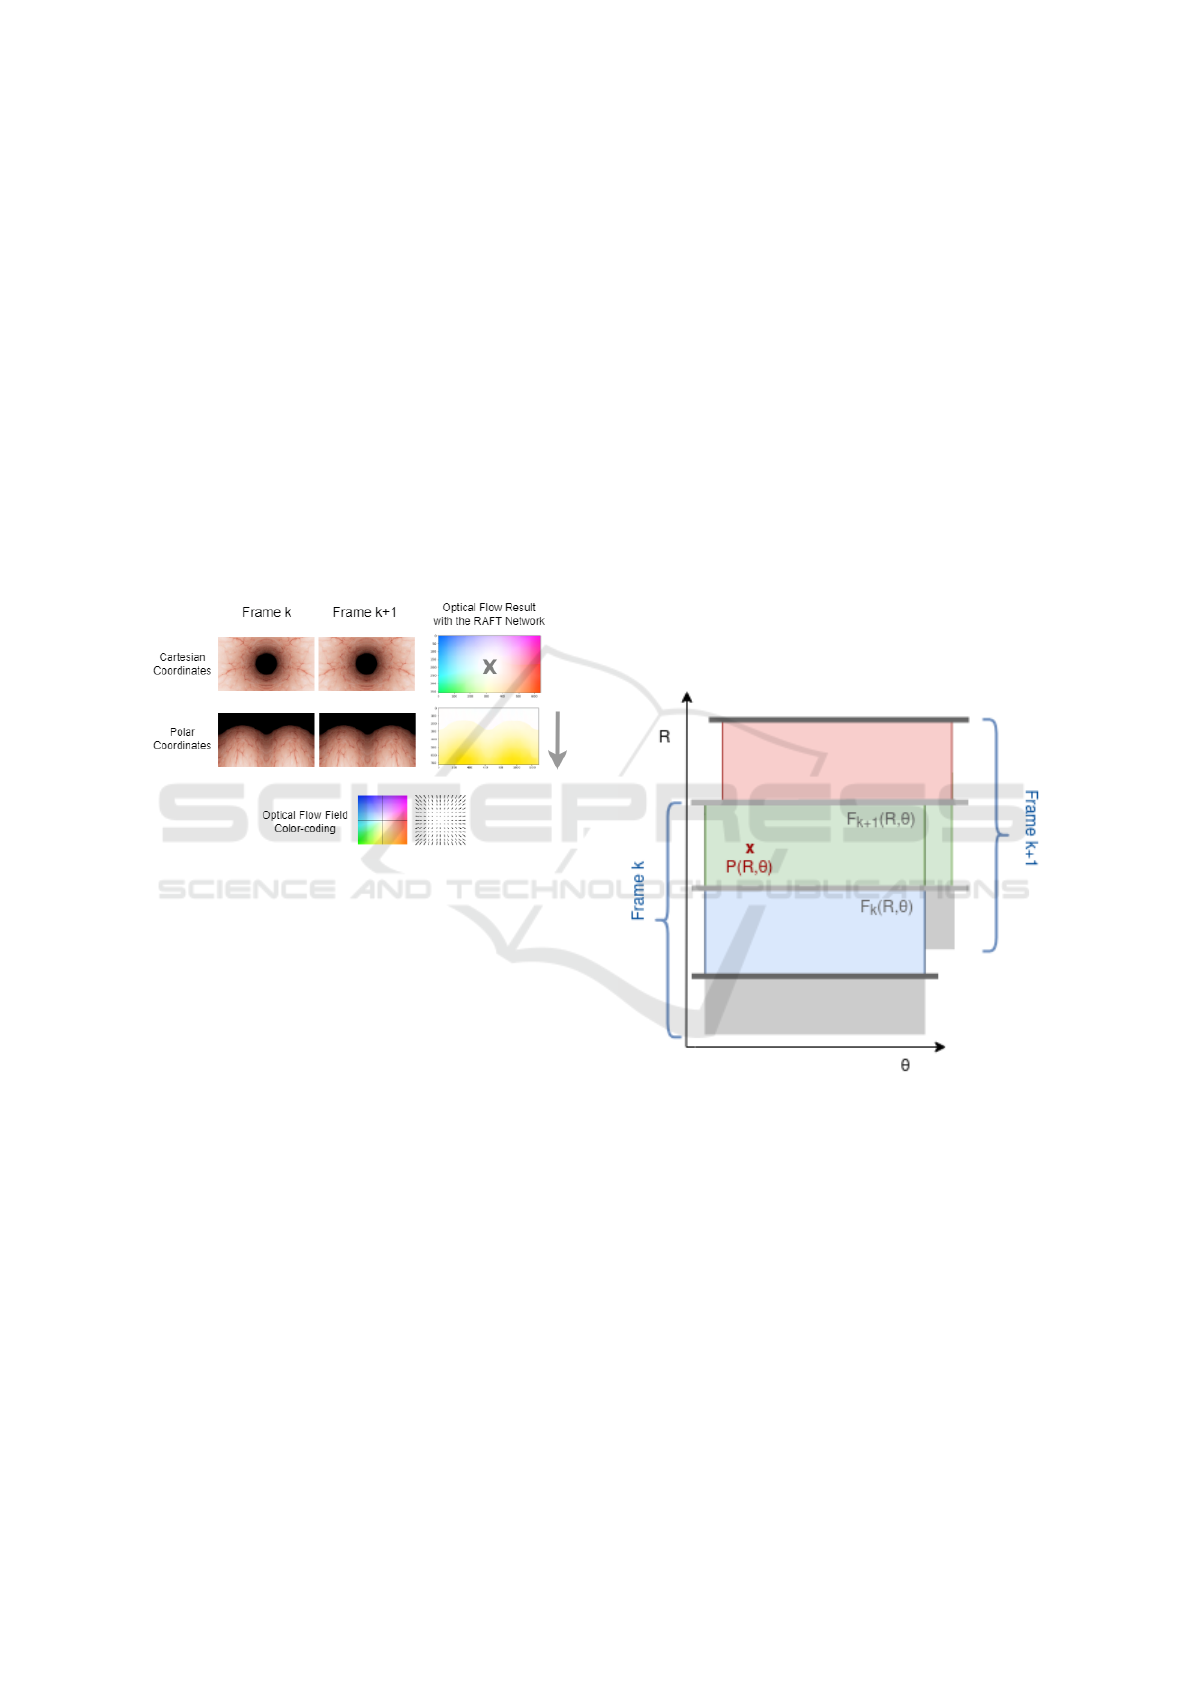
The optical flow result obtained with the RAFT
network given the polar representation of the con-
secutive frames is shown in Figure 10. The output
colour is all yellow, corresponding to vertical flow
field as expected since the displacement of the capsule
is designed to be purely translational in our Blender
model. This step provides the image registration esti-
mation since it allows the retrieval of the pixel-by-
pixel point correspondences with each optical flow
vector associated with each pixel. In addition, it also
provides a conceptual validation of our initial idea for
the ideal case scenario where the endoscopic capsule
only moves with pure translation, since all displace-
ment vectors point downwards.
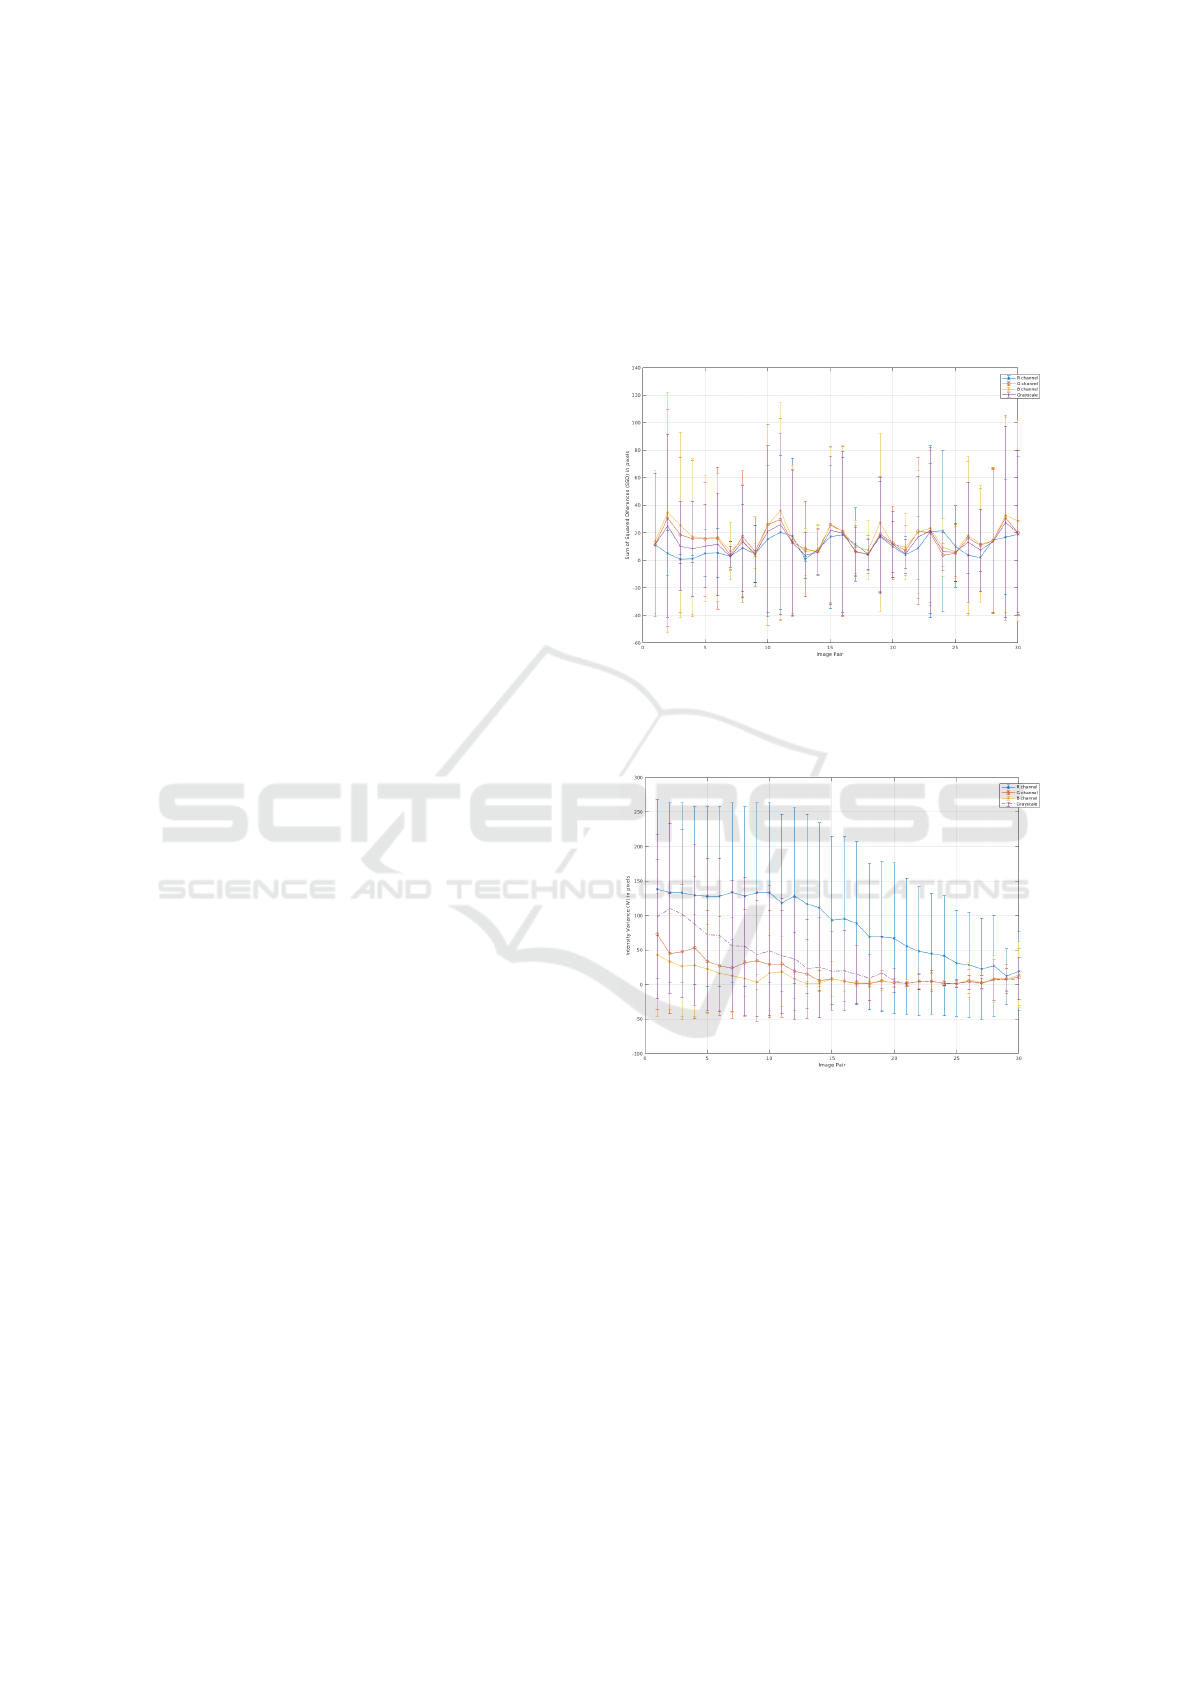
Figures 13-15 show the values of the metrics SSD,
IV and CC between each image I
k+1
and the previous
one I
k
for each one the intensities of each RGB chan-
nel and its grayscale, for all 30 pairs of consecutive
frames assessed from the rendered video.
Figure 13: SSD between each image I
k+1
and its previ-
ous one I
k
for the intensities of each RGB channel and for
grayscale, for all 30 pairs of consecutive frames from the
video rendered with the Blender Software.
Figure 14: IV between each image I
k+1
and its previous one
I
k
for the intensities of each RGB channel and for grayscale,
for all 30 pairs of consecutive frames from the video ren-
dered with the Blender Software.
Figure 11 shows the final panorama obtained af-
ter the mosaicing process of all 30 pairs of consecu-
tive frames from the forward-motion video with the
blender model.
Table 1 shows the normalized NR-IQA values for
the final local panorama from Figure 11 given the
three above-mentioned CNN-based models.
Since the registration results are satisfactory but
the IQA results from the final panorama are far from
ideal, there needs to be further exploration of a more
robust methodology for the mosaicing process, for ex-
BIOINFORMATICS 2023 - 14th International Conference on Bioinformatics Models, Methods and Algorithms
48
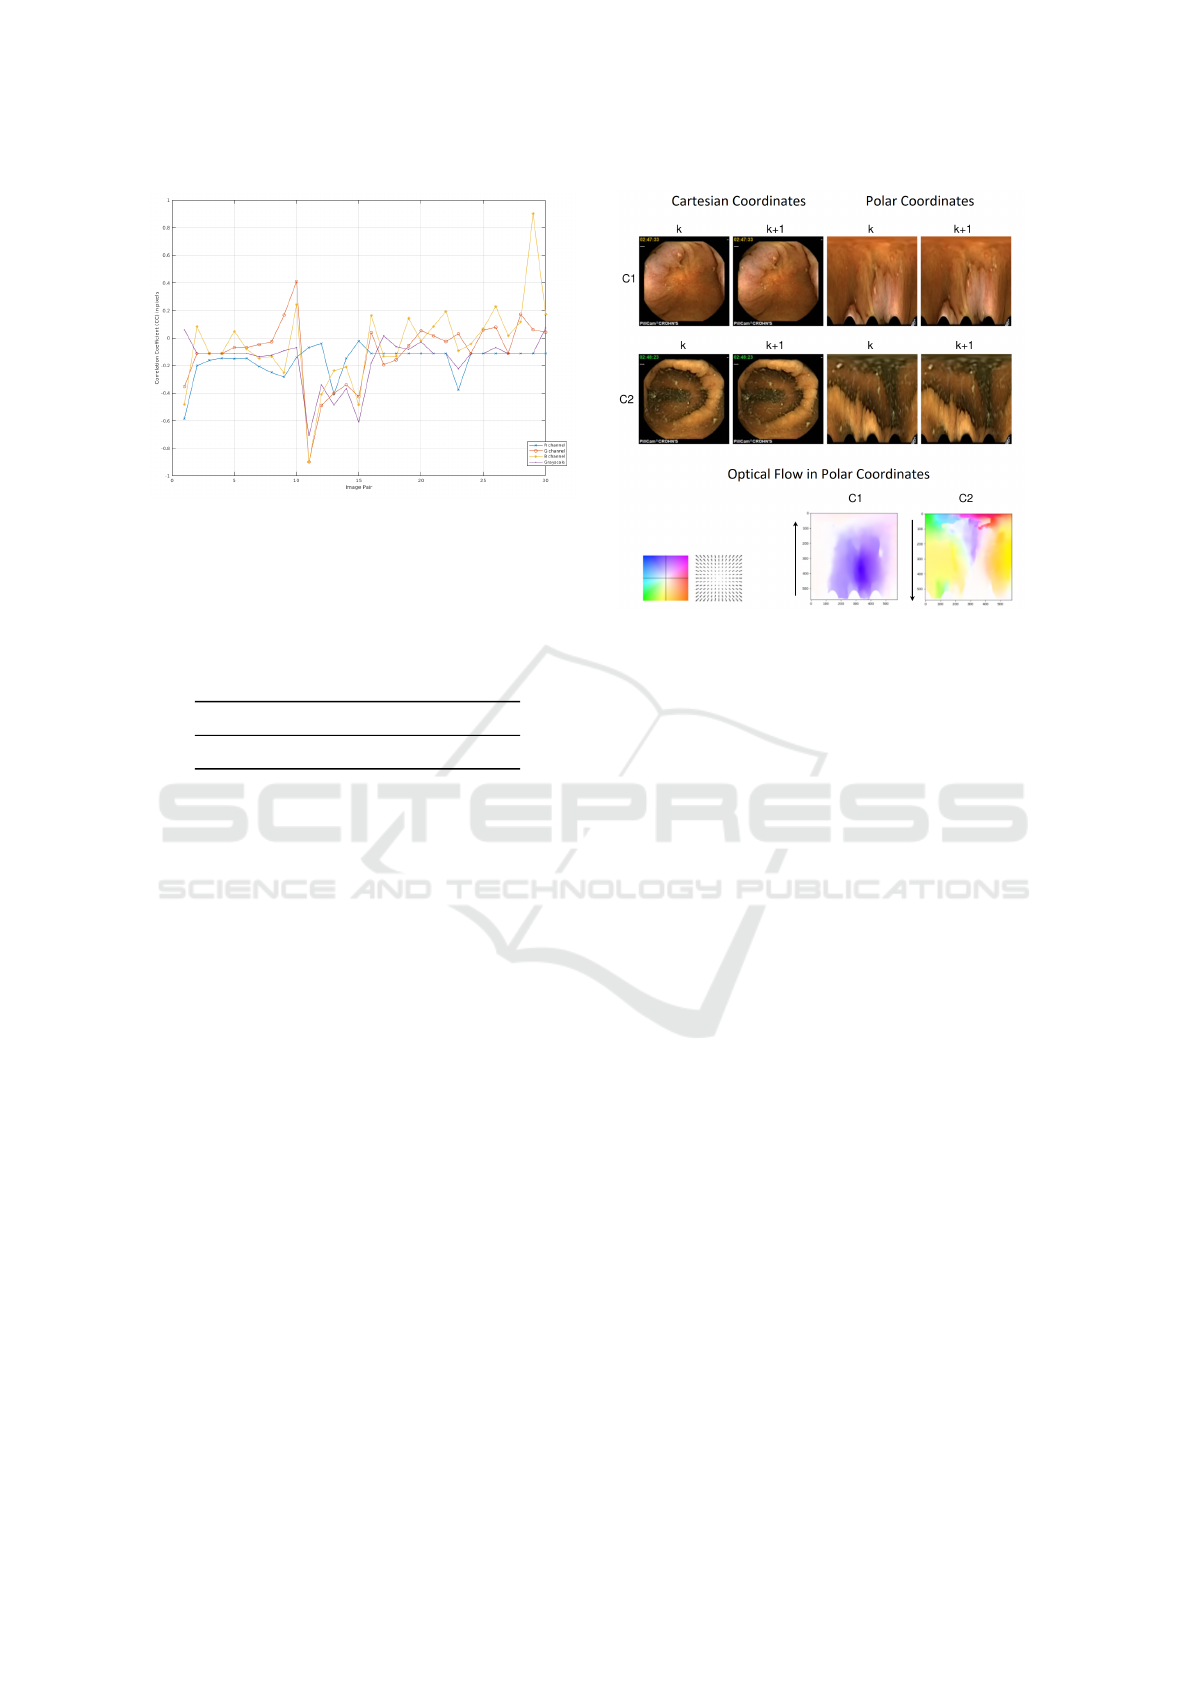
Figure 15: CC between each image I
k+1
and its previous
one I
k
for the intensities of each RGB channel and for
grayscale, for all 30 pairs of consecutive frames from the
video rendered with the Blender Software.
Table 1: NR-IQA normalized values ([0,1]) of the final local
forward-motion panorama using the CNNIQA (Madhusu-
dana et al., 2022), CONTRIQUE(Kang et al., 2014) and
VIDGIQA (Guan et al., 2017) models.
CNNIQA CONTRIQUE VIDGIQA
0.267 0.478 0.114
ample, with the computation of several local homo-
graphies instead of a global one or by exploring non-
classical deep learning tools for the iterative stitching.
Further research work is also required in order to deal
with the discontinuities where the boundaries of each
strip are visible, creating artefacts that lower the im-
age quality.
Figure 16 shows a sequential pair of frames re-
trieved from a WCE video from a patient with the
PillCam Colon2. Both frames are from the two cam-
eras on opposite sides of the capsule (C1 and C2), in
cartesian and polar coordinates, and the correspond-
ing optical flow estimation from the polar representa-
tion with the RAFT network. A robust metric for the
comparative analysis of the OF vector field of con-
secutive frames from the opposing end cameras (C1
and C2) is also needed to use as a segmentation crite-
rion for the motion segmentation process. Following
this methodological line of work, given the fact that
the purely translational frames correspond to back-
ward and forward motion from both back and front
cameras, which are rigidly connected and that both
correspond essentially to a vertical OF vector field in
polar coordinates, as shown in Figure 16, our future
goal is the computation of these local panoramas with
the patient videos.
Figure 16: Example of a sequential pair of frames from the
cameras on both ends of the capsule (C1 and C2) and the
optical flow estimation given the polar representation with
the RAFT network (Teed and Deng, 2021).
8 CONCLUSIONS
The work developed in this paper constitutes a crucial
step for the development of local endoscopic panora-
mas to reduce the viewing time of clinicians and in-
crease lesion detection rates.
Although the methodology can still be improved,
as described above, a proof of concept for the con-
struction of a motion-forward panorama was success-
fully carried out given the colon-like textured tubular
model frames. Given this starting point, after a mo-
tion segmentation process, local endoscopic panora-
mas could be obtained with patient videos, in regions
of interest, where the capsule moves in pure transla-
tion, as proposed. With this multi-camera capsule pa-
tient video, by constructing a local panoramic view
from each camera (C1 and C2), since they travel the
same path and observe the same structures, it may
also be possible, in future work, to condense both lo-
cal panoramas into a more robust one.
In the future, if there is also the need to create
a global panoramic overview of the entire GI tract,
in order to avoid discontinuities in regions where no
transformation can be computed between consecutive
frames, the generation of intermediate views for the
mosaicing step can also be explored.
Local Forward-Motion Panoramic Views for Localization and Lesion Detection for Multi-Camera Wireless Capsule Endoscopy Videos
49

ACKNOWLEDGEMENTS
The authors would like to acknowledge the sup-
port of project PTDC/EMD-EMD/28960/2017, enti-
tled ”Multi-Cam Capsule Endoscopy Imagery: 3D
Capsule Location and Detection of Abnormalities”,
funded by FCT, the PhD Scholarship 2020.06592.BD
funded by FCT, and the Institute of Systems and
Robotics - University of Coimbra, under project
UIDB/0048/2020, funded by FCT.
REFERENCES
Behrens, A. (2008). Creating panoramic images for bladder
fluorescence endoscopy. Acta Polytechnica, 48.
Brown, A. P. and Jayatissa, A. H. (2020). Analysis of cur-
rent and future technologies of capsule endoscopy:
A mini review. Archives of Preventive Medicine,
5(1):031–034.
Cao, M., Deng, Z., Rai, L., Teng, S., Zhao, M., and Col-
lier, M. (2018). Generating panoramic unfolded image
from borehole video acquired through APBT. Multi-
media Tools and Applications, 77(19):25149–25179.
Guan, J., Yi, S., Zeng, X., Cham, W. K., and Wang, X.
(2017). Visual Importance and Distortion Guided
Deep Image Quality Assessment Framework. IEEE
Transactions on Multimedia, 19(11):2505–2520.
Hartley, R. and Zisserman, A. (2003). Multiple View Geom-
etry in Computer Vision. Cambridge University Press.
Iakovidis, D., Tsevas, S., and Polydorou, A. (2010). Re-
duction of capsule endoscopy reading times by unsu-
pervised image mining. Computerized Medical Imag-
ing and Graphics, 34(6):471–478. Biomedical Image
Technologies and Methods - BIBE 2008.
Kang, L., Ye, P., Li, Y., and Doermann, D. (2014). Convo-
lutional neural networks for no-reference image qual-
ity assessment. Proceedings of the IEEE Computer
Society Conference on Computer Vision and Pattern
Recognition, pages 1733–1740.
Kim, R., Baggott, B. B., Rose, S., Shar, A. O., Mallory,
D. L., Lasky, S. S., Kressloff, M., Faccenda, L. Y.,
and Reynolds, J. C. (1995). Quantitative endoscopy:
Precise computerized measurement of metaplastic ep-
ithelial surface area in barrett’s esophagus. Gastroen-
terology, 108(2):360–366.
Madhusudana, P. C., Birkbeck, N., Wang, Y., Adsumilli, B.,
and Bovik, A. C. (2022). Image Quality Assessment
Using Contrastive Learning. IEEE Transactions on
Image Processing, 31:4149–4161.
Oliveira, M., Araujo, H., Figueiredo, I. N., Pinto, L., Curto,
E., and Perdigoto, L. (2021). Registration of consec-
utive frames from wireless capsule endoscopy for 3d
motion estimation. IEEE Access, 9:119533–119545.
Rousso, B., Peleg, S., Finci, I., and Rav-Acha, A. (1998).
Universal mosaicing using pipe projection. Proceed-
ings of the IEEE International Conference on Com-
puter Vision, pages 945–952.
Seibel, E. J., Carroll, R. E., Dominitz, J. A., Johnston, R. S.,
Melville, C. D., Lee, C. M., Seitz, S. M., and Kimmey,
M. B. (2008). Tethered capsule endoscopy, a low-cost
and high-performance alternative technology for the
screening of esophageal cancer and Barrett’s esopha-
gus. IEEE Transactions on Biomedical Engineering,
55(3):1032–1042.
Song, J. H. (2017). Methods for evaluating image registra-
tion. The University of Iowa.
Spyrou, E., Diamantis, D., and Iakovidis, D. K. (2013).
Panoramic visual summaries for efficient reading of
capsule endoscopy videos. pages 41–46.
Swain, P. (2003). Wireless capsule endoscopy. Gut,
52(suppl 4):iv48–iv50.
T
ˇ
rebick
´
y, V., Fialov
´
a, J., Kleisner, K., and Havl
´
ı
ˇ
cek, J.
(2016). Focal length affects depicted shape and per-
ception of facial images. PLOS ONE, 11(2):1–14.
Teed, Z. and Deng, J. (2021). RAFT: Recurrent All-Pairs
Field Transforms for Optical Flow (Extended Ab-
stract). IJCAI International Joint Conference on Arti-
ficial Intelligence, pages 4839–4843.
Yoshimoto, K., Watabe, K., Tani, M., Fujinaga, T., Iijima,
H., Tsujii, M., Takahashi, H., Takehara, T., and Ya-
mada, K. (2020). Three-dimensional panorama image
of tubular structure using stereo endoscopy. Interna-
tional Journal of InnovativeComputing, Information
and Control, 16(3).
BIOINFORMATICS 2023 - 14th International Conference on Bioinformatics Models, Methods and Algorithms
50
