
Evaluation Scheme to Analyze Keystroke Dynamics Methods
Anastasia Dimaratos
1
and Daniela P
¨
ohn
2
1
Ludwig Maximilian University of Munich, Munich, Germany
2
Universit
¨
at der Bundeswehr M
¨
unchen, Neubiberg, Germany
Keywords:
Keystroke Dynamics, Biometrics, Authentication, Security, Passwords, Machine Learning.
Abstract:
Password authentication is a weak point for security as passwords are easily stolen and a user may ignore the
security by using a simple password. Therefore, services increasingly demand a second factor. While this
may enhance security, it comes with a lower level of usability and another factor to be forgotten. A smart-
phone is an important device in daily life. With the growing number of sensors and features in a smartphone,
keystroke dynamics may provide an easy-to-use method. In this paper, we introduce requirements for bio-
metric authentication and keystroke dynamics. This results in an evaluation scheme, which is applied to three
selected approaches. Based on the comparison, keystroke dynamics and the evaluation scheme are discussed.
The obtained results indicate that keystroke dynamics can be used as another authentication method but can be
bypassed by stronger adversaries. For further research, a common data set would improve the comparability.
1 INTRODUCTION
Authentication is required to access several services.
It can generally be grouped into the categories of
knowledge (e. g., a password), possession (e.g., a
hardware token), and biometrics (e. g., fingerprint
or keystroke dynamics). Although prone to sev-
eral attacks such as guessing, dictionary, and cre-
dential stuffing attacks, 90% of the 1,000 most-
visited websites apply passwords (Preibusch and Bon-
neau, 2010). With the uptake of mobile computing,
password-based authentication is even more problem-
atic due to the nature and reduced level of security of
the devices. Given the increasing amount of accounts
and related sensitive information, such as credit card
information, confidential emails, and personal photos,
stored on mobile devices, there is an increasing de-
mand for stronger authentication methods.
To address the emerging threats to password-
based mobile authentication, biometric authentica-
tion systems are increasingly used for mobile devices.
With the growing number of sensors and diverse sets
of user-driven features, modern mobile devices of-
fer a platform for capturing and analyzing biometrics
for authentication. Biometric authentication identifies
users by relying on their physiological or behavioral
characteristics. Physiological biometrics, such as fin-
gerprints, iris, finger vein patterns, and face geometry,
verify users, who belong to a large population. On
the other hand, behavioral biometrics uses the unique
pattern and signature of a user to access a service or
device. Therefore, the system must identify the ille-
gitimate user even if the correct username and pass-
word are entered. Keystroke dynamics refers to the
unique patterns of rhythm and timing-based features
that are created when a user types on a touchscreen
and, therefore, uses the sensors and other sets of mo-
bile devices (Monrose and Rubin, 2000). Personal
constitution (e.g., stressed, depressed, or drunk), as
well as other external factors, can influence the way
of typing. In addition, different adversaries have to be
considered (Mayrhofer and Sigg, 2021). In order to
discuss keystroke dynamics and the conditional influ-
ence on the method, an evaluation scheme is required.
Our main contribution is three-fold: i) We assess
the effectiveness of keystroke dynamics by establish-
ing a generic evaluation scheme. ii) We use this eval-
uation scheme to analyze three exemplary keystroke
dynamics approaches. iii) Based on this comparison,
we discuss the potential of keystroke dynamics.
First, we explain keystroke dynamics, before we
summarize related work in Section 3. In Section 4,
we introduce the requirements for biometric authenti-
cation and keystroke dynamic systems. These evalu-
ation criteria are applied to compare three approaches
in Section 5. Based on the comparison, we discuss
keystroke dynamics in Section 6. Last but not least,
we draw conclusions and discuss future directions.
Dimaratos, A. and Pöhn, D.
Evaluation Scheme to Analyze Keystroke Dynamics Methods.
DOI: 10.5220/0011626100003405
In Proceedings of the 9th International Conference on Information Systems Security and Privacy (ICISSP 2023), pages 357-365
ISBN: 978-989-758-624-8; ISSN: 2184-4356
Copyright
c
2023 by SCITEPRESS – Science and Technology Publications, Lda. Under CC license (CC BY-NC-ND 4.0)
357
2 KEYSTROKE DYNAMICS
In this section, the background of keystroke dynam-
ics as a behavioral biometrics authentication method
is given. There are two ways to implement it: some-
body has to enter a password or a random text either
with or without a username. If neither password nor
username is needed, then the method is the only fac-
tor; In other cases, it is multi-factor authentication.
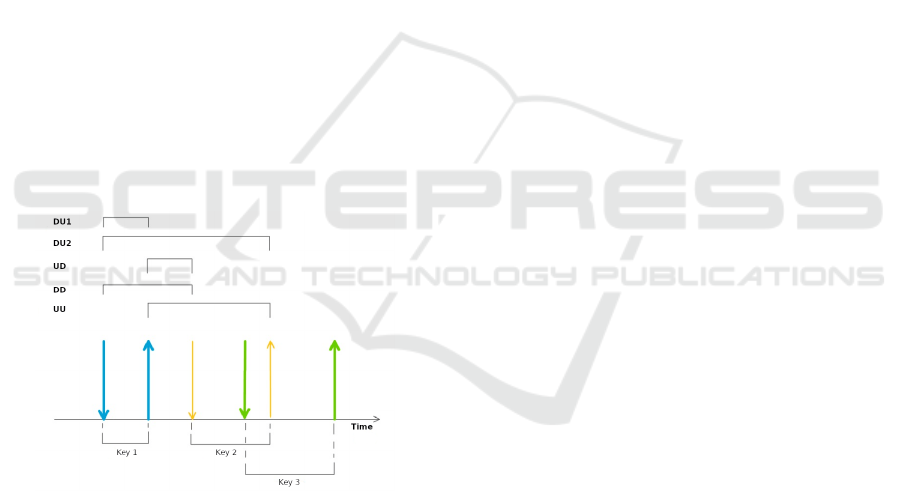
In order to use keystroke dynamics, different char-
acteristics (time-dependent and time-independent) are
measured. Time-dependent features are different dur-
ing a time span or between a Down- or an Up-
Press. Figure 1 illustrates the most relevant time-
dependent features Down-Up-Press (DU1), the Up-
Down-Press (UD), the Down-nextUp-Press (DU2),
the Down-Down-Press (DD), and the Up-Up-Press
(UU). Time-independent features exist more often for
modern touchscreen devices than for computers due
to the number of sensors. These include the exact x/y-
position of the keystroke, the area size of the touch,
and the displacement of the finger or pen during a
keystroke. For new devices, the position of the mo-
bile phone can be measured, such as the angle or the
rotation of the device. Other time-independent fea-
tures, which are possible for conventional keyboards,
include frequent typos and their improvements.
Figure 1: Features according to (Pisani and Lorena, 2013).
Like most biometric authentication systems,
keystroke dynamic systems work in two phases: train-
ing and classification. Both phases go through the fol-
lowing four steps, where steps three and four can be
implemented by machine learning or statistics:
1. Data collection;
2. Preprocessing the data;
3. Feature selection and extraction;
4. Classification.
For the training of the system, a template for each user
is created on the basis of one or more data sets and the
resulting features. In the classification stage, the same
happens with a new data set. Then, based on probabil-
ities, the system decides whether a user is legitimate
or, if no username input is assumed, who the user is.
Because of the dynamic nature of the typing behavior,
some studies implemented the sixth step of relearning
for the keystroke dynamics system (KDS). The data is
constantly updated and dynamically tailored to a user
through adaptation mechanisms.
3 RELATED WORK
While several approaches try to improve keystroke
dynamics, only a few evaluate them with the same
rates and datasets. Zamsheva et al. (Zamsheva
et al., 2020) compare two databases with personal
data based on their BehavioSenseapproach. In or-
der to evaluate the accuracy, they use false accep-
tance rate (FAR), false rejection rate (FRR) as well
as global, individual, and average equal error rate
(EER). These rates are also applied by other ap-
proaches, e. g., (Crawford, 2010; Alghamdi and El-
refaei, 2015; Lee et al., 2018; Li and Jain, 2009).
Pisani and Lorena systematically analyze keystroke
dynamics approaches. The authors use DU1, DU2,
UD, DD, and UU classifiers. In addition, FAR, FRR,
EER, accuracy rate, and integrated error are applied
to evaluate the performance. Last but not least, the
authors state benchmarking datasets. A similar sur-
vey was conducted by Teh et al. (Teh et al., 2013),
focusing on FAR, FRR, and EER for static and dy-
namic approaches. As both surveys were published
in 2013, newer approaches are not included. Newer
publications either propose an approach (e. g., (Kim
et al., 2020)) or concentrate on specific issues, includ-
ing a comparison of different models (Singh et al.,
2020), machine learning classifiers (de Marcos et al.,
2021), and emotion recognition (Maalej and Kallel,
2020). In addition, Shekhawat and Bhatt (Shekhawat
and Bhatt, 2019) analyze the ERR in multiple use
cases and different classification algorithms without
converting the validation parameters for comparison.
4 METHODOLOGY
In this section, we provide the methodology to evalu-
ate keystroke dynamics.
4.1 Biometric Authentication
We conducted a literature study by searching for
“requirements” + “biometric” at major publishers.
ICISSP 2023 - 9th International Conference on Information Systems Security and Privacy
358

This includes (Srivastava, 2013; Zirjawi et al., 2015;
Schiavone et al., 2016; Alt and Schneegass, 2022;
Makrushin et al., 2021; Mahfouz et al., 2017). We
then extracted the following main requirements:
1. Universality: As many people as possible should
be able to use it.
2. Uniqueness: A characteristic may not describe
two or more people at the same time.
3. Circumvention: Difficult-to-imitate individual
characteristics must be selected by which a human
being can be uniquely identified to ensure reliable
differentiation.
4. Permanence: A feature must be selected that is
hardly subject to change.
5. Measurability: The user’s biometrics must be
measurable and quantifiable.
6. Security: The system must be robust, i. e. non-
intrusive.
7. User-friendliness: The system must be easy to use
for the user.
8. Acceptability: The users must give their consent
to the use of the procedure.
9. Economic feasibility: The cost of a biometric au-
thentication system must be reasonable.
Furthermore, additional requirements can be set for
the use of smartphones. A biometric authentication
system should be device-independent regardless of
the sensor technology. Authentication must also be
possible when switching devices, e. g., between the
work mobile phone and the private smartphone.
4.2 Authentication Process
The authentication process consists of two phases.
In the training phase, the characteristics of a person
are stored in a database after data collection, pre-
processing, and extraction of the characteristics. The
actual authentication of the person takes place in the
test phase, where the extracted features are compared
with the data stored in the database.
Data Collection and Relearning: Different sen-
sors are used to extract biometric data. The choice of
keyboard type (numeric keypad or virtual keyboard)
and sensors are factors for data collection. A number
field offers fewer possibilities than a virtual keyboard
on a smartphone. The accuracy increases with the
number of possible entries and thus with the choice
of password or input. It can be concluded that:
• The type of input and password has an influence
on security.
• The accuracy of the classification increases with
the number of recordings.
• Different environmental factors as well as psycho-
logical and physical changes result in different be-
haviors.
• Since behavior changes over the course of a life-
time and frequent repetition, the system should
dynamically adjust.
Pre-Processing: Data is not always of the same
quality, which is why it should be pre-processed to al-
low for better comparison. If data is hardly or poorly
pre-processed, the following steps will be more diffi-
cult, longer, and less accurate.
Feature Selection, Extraction, and Classification:
By extracting and selecting features, the characteris-
tics of a person are defined. During classification, a
new input is compared with the profiles and a decision
is made regarding legitimacy. The error rates (Sec-
tion 4.3), which represent security and usability, are
dependent on these process steps and are good indi-
cators for the usability of a KDS.
4.3 Evaluation Criteria
The effectiveness of a biometric authentication
method (i. e., distinction between legitimate and ille-
gitimate users) is determined by various error rates. In
the following, these evaluation criteria are explained.
4.3.1 Measurable Units of Binary Classification
For binary classification, the following measurable
units are given. To measure the data, the inputs are
divided into true positives (TP), false positives (FP),
false negatives (FN), and true negatives (TP).
Accuracy (AC). Accuracy is defined as the number
of correct predictions divided by the total number of
predictions as follows:
accuracy =
T P +TN
T P + T N + FP + FN
(1)
Precision (P). The precision answers the question
of what proportion of positive identifications are cor-
rect. This can be determined by FP and TP:
precision =
T P
T P + FP
(2)
Evaluation Scheme to Analyze Keystroke Dynamics Methods
359

Recall (R). The recall describes the proportion of
actual positives correctly identified, determined by
FN and TP:
recall =
T P
T P + FN
(3)
F1-Score. The F1-score verifies the accuracy of a
binary classification model for a data set:
F1 = 2 ∗
precision ∗ recall
T P + FN
(4)
4.3.2 Comparison Rates
Different error rates are applied (Crawford, 2010;
Pisani and Lorena, 2013; Alghamdi and Elrefaei,
2015; Lee et al., 2018). Figure 2 shows the corre-
lation of the error rates explained below.
Figure 2: Correlation of error rates.
Error. An error describes the incorrect assignment
of an example by the classifier.
False Rejection Rate (FRR). FRR defines the le-
gitimate users who are incorrectly rejected. This rate
is also called the False Nonmatch Rate (FNR), False
Alarm Rate, False Positive Rate (FRP), or Type 1
Error. FRR depends on the threshold set, which in-
dicates the degree of correspondence of the new in-
put to the reference data from which a user is recog-
nized as legitimate. According to the European Stan-
dard for Access Control (EN-50133), an authentica-
tion method should not reach a value for FRR above
1% to ensure security under European law.
FRR =
Total number incorrectly re jected users
Total number login attempts legimitate users
(5)
False Acceptance Rate (FAR). FAR defines the
percentage between the false granting of access by
fraudsters and the total number of fraudsters access-
ing the system. Often it is also called False Match
Rate (FRM) or Type 2 error. This rate depends on
the threshold set for the acceptance of a user. Accord-
ing to the European Standard for Access Control (EN-
50133), an authentication method should not reach a
value above 0.001% to ensure security.
FAR =
Total number incorrectly accepted user
Total number login attempts illlegimitate users
(6)
Equal Error Rate. In order to enable overall accu-
racy, EER or also called Crossover Error Rate (CER)
is used. EER is the intersection between FRR and
FAR (Figure 2).
Failure to Enrol Rate (FER). If a feature of bio-
metrics, such as typing behavior, cannot be used, then
FER is a metric for this.
FER =
Number o f persons with f ailed data recording
Total number o f potential users
(7)
Failure to Acquire Rate (FTA). FTA is a rate for
erroneous data recording and missing data generation
in comparison with the reference data.
FTA =
Counts o f f ailed data recordings a f ter traing
Total number o f potential users
(8)
4.3.3 Significance of the Comparative Rates
Due to the dependence of the comparison rates on
the data collected, statements should be viewed with
caution when comparing these from different studies.
FAR, FRR, and EER depend not only on the data col-
lected but also on the threshold set. For an adequate
statement, the threshold value is necessary to know.
An attacker starts with the probability of success p on
each attempt. If FAR = p for an input attempt corre-
sponds to 0.01 and FRR = q = 0.02, then FAR and
FRR change as follows on the second attempt:
FAR
2
= p + (1 − p) · p
FAR
2
= 0.01 + (1 − 0.01) · 0.01 = 0.0199
(9)
FRR
2
= q · q
FRR
2
= 0.02 · 0.02 = 0.0004
(10)
FAR, i. e., the ease of use, increases, and FRR, i. e.,
the safety, decreases with each further permitted at-
tempt after a failure. For a better comparison of
the evaluation criteria, the interrelationships between
them are shown below.
ICISSP 2023 - 9th International Conference on Information Systems Security and Privacy
360

Accuracy and EER. Depending on the EER, the
accuracy can be calculated as follows:
Accuracy = 1 − EER (11)
EER, FRR and FAR. The EER is calculated by the
intersection of FAR and FRR:
EER = 0.5(FAR + FRR) (12)
Because of the conditions set for FAR and FRR, the
maximum value for EER is as follows:
max(EER) = 0.5(0.01 + 0.001)
⇒ max(EER) = 0.5 · 0.011
⇒ max(EER) = 0.0055
⇒ max(EER) = 0.55%
(13)
4.3.4 Various Biometric Features
To compare different biometric features, the follow-
ing differentiation possibilities can be used.
Evaluation Criteria of a Biometric Feature.
1. Comfort: Includes user-friendliness.
2. Accuracy: Determines error rates in practical use.
3. Availability: Describes the potential user group.
4. Costs: Incurred through data collection.
Possibility of Imitating a Feature. If an attacker
wants to mimic a person’s biometric feature, this can
vary in difficulty depending on the feature. Features
can be categorized as follows:
1. Open: Feature can be observed without aids.
2. Slightly hidden: An observer can find the feature.
3. Covert: Feature can be detected by a specific de-
tector.
4. Severely hidden: The feature is not directly ob-
servable but defined by the results of functions.
Effort of the Attack. An attack on a system can be
subject to different difficulties:
1. Low effort: This exists if an accidental and un-
intentional penetration of the system is possible
without prior knowledge, with simple means, and
without a major expenditure of time.
2. Medium effort: If the attack lasts several hours to
days and the knowledge of general access infor-
mation is assumed, it is a medium effort on the
part of the attacker.
3. High effort: If good specialist knowledge or
higher is required and an attack lasts several
weeks, requires good opportunities, and operating
resources, then an attack has a high effort.
5 EVALUATION
5.1 Support Vector Machine and Radial
Basis Kernel
(Krishnamoorthy et al., 2018) propose a concept with
a Support Vector Machine (SVM) and Radial Ba-
sis Kernel (RBF). For data collection, they use their
own app for Android devices. The 94 participants
had to type in the password .tie5Roanl 30 times.
Pre-processing consists of five steps: 1) import the
data and remove duplicates; 2) exclude data below
a threshold; 3) delete geolocation information; 4)
search action types and improved errors; 5) generate
features for each keystroke and action type. 13 feature
types are extracted, resulting in 155 different features
for 77 users. For classification, linear SVM is ana-
lyzed. In order to improve the accuracy, the authors
apply RBF and compare it with SVM only.
5.2 Median Vector Proximity
(Al-Obaidi and Al-Jarrah, 2016) apply dynamic static
methods with median vector proximity. The 17 par-
ticipants had to type in a message five times. The
recorded data by the Android app is normalized and
min-max scaled. Next, seven features are extracted.
For classification, two vectors are established. In ad-
dition, different thresholds are tested to find the best
proportion between FAR and FRR.
5.3 Distance Vector Classification
(Alghamdi and Elrefaei, 2015) use Distance Vector
Classification (DVC) alone and in combination with
other methods. The authors programmed an Android
app, where 22 participants had to type in the password
766420 100 times. For preprocessing, the authors
evaluate min-max scaling, standard scale, euclidean
distance, and manhattan distance. They decide on the
manhattan distance and standard scale. For each par-
ticipant, 120 features are extracted. The authors eval-
uate different methods for the classification: DVC and
One-Class Support Vector Machine (OCSVM). With
DVC, better results are gained.
Evaluation Scheme to Analyze Keystroke Dynamics Methods
361
5.4 Analysis of the Approaches
Data Collection. The different approaches are sum-
marized in Table 1. The number of participants and
inputs is comparably small, with the second concept
having the lowest. Also, the keyboards differ: key-
boards chosen by the developers up to virtual key-
boards and number fields.
Table 1: Data collection of the chosen approaches.
Con.
Input People Input Features
5.1 .tie5Roanl 94 30 155
5.2 choosable 17 5 31/33
5.3 766420 22 100 120
Pre-Processing. As shown in Table 2, the methods
for pre-processing differ.
Table 2: Pre-processing of the approaches.
Concept Methods for pre-processing
5.1 Removal of duplicates, threshold,
and three further steps
5.2 Normalization, min-max scale
5.3 Manhatten distance, standard scale
Selection and Extraction of Features. Table 3 pro-
vides an overview of the feature types and amounts.
Concept 2 (x: length of input) requires fewer fea-
tures than concepts 1 and 3. All concepts apply time-
dependent and independent features. Concept 3 addi-
tionally takes device-specific features into account.
Table 3: Feature type and amount for each concept.
Feature type
5.1 5.2 5.3
Down-Up #16 #x #0
Up-Down #15 #x-1 #6
Down-Down #15 #x-1 #6
Up-Up #15 #0 #6
Down-Up (2-graph) #15 #0 #6
Pressure #16 #x #0
Size #16 #x #6
X-Y P #16 #0 #0
X-Y C #16 #0 #0
Avg. time #5 #0 #0
Avg. pressure #1 #1 #0
Avg. size #1 #1 #0
device-specific #8 #0 #18
D n #0 #0 #6
XyDn #0 #0 #12
XyUp #0 #0 #12
TOTAL #155 #5x #120
Classification. While concept 1 uses SVM with
RBF, both other concepts apply distance vector classi-
fication and evaluate different combinations (Table 4).
Table 4: Applied classification.
Concept Classification
5.1 SVM with RBF
5.2 Distance vector with two vectors
5.3 Distance vector with median
Comparison by Evaluation Criteria. The classifi-
cation with SVM gains better results if used together
with RBF. The inclusion of further features improves
the results of the classification. In addition, sex and
gender may have an impact on rotation, pressure, size,
and acceleration. In order to compare the three se-
lected approaches, we apply our evaluation criteria as
shown in Table 5. By converting the results of concept
1 to EER (0.026), we notice that the approach would
fulfill the requirements for an authentication method.
Table 5: Comparison by evaluation criteria.
Concept Features Evaluation criteria
5.1 36 Accuracy = 0.9740
F1-score = 0.9701
5.2 31/33 øEER = 0.1219
EER von σ = 0.1337
5.3 20 øEER = 0.0789
6 DISCUSSION
In this section, we discuss the evaluation metrics and
keystroke dynamics.
6.1 Evaluation Metrics
Based on the evaluation, we consider the require-
ments proposed in Section 4.3. The first concept ap-
plies different criteria (accuracy and F1 score) than
the others (FRR and EER). After converting the val-
ues according to formula 11, the accuracy corre-
sponds to an EER of 0.026. Even though the val-
ues are comparable, the data acquisition, the data
sets, and the overall setup of the experiments are not.
This means that one or several templates for experi-
ments and pre-defined data sets would help to evalu-
ate several approaches in a structured way. According
to the results, authentication with a given input per-
forms better than with a free input. The use of the
SVM seems to achieve better results than the statis-
tical methods. However, since the values depend on
many factors within the study and some of these are
ICISSP 2023 - 9th International Conference on Information Systems Security and Privacy
362

not disclosed, a comparison is difficult. Here, again,
an open access policy would improve a comparison.
6.2 Keystroke Dynamics
6.2.1 Requirements for Biometric Systems
The established requirements for biometric systems
are partly fulfilled by keystroke dynamics:
1. Universality: The following counter-example
proves that generality is not fully given. A blind or
hands-free person, e. g., can operate a smartphone
using the language assistant. However, if the typ-
ing behavior becomes a condition of the authenti-
cation, the system may not able to use it because
the voice assistant automatically enters the data.
2. Uniqueness: By the fluctuation of the typing be-
havior of a person and determining by similarities,
there is consequently the possibility for a charac-
teristic to describe several people. By combin-
ing it with other characteristics, such as the pres-
sure level, the probability to differentiate person A
from person B increases.
3. Circumvention:Due to the fluctuation of the typ-
ing behavior, a broader range is possible, which
is why a KDS works with similarity probabili-
ties. The more accurate and longer several people
are analyzed in their behavior, the more likely it
is that precise statements about different behavior
patterns of a person can be made.
4. Permanence: KDS is a behavior-based character-
istic, which changes depending on the psycholog-
ical and/or physical constitution. For example, a
person in an emergency situation wants access to
their smartphone to dial the emergency number. It
is likely that the tremors, which can cause excite-
ment, deny access.
5. Measurability: The ability to measure and detect
is given with a KDS since the characteristics are
determined and recorded by sensors, while other
features, e. g., pressure or coordinates, can be cal-
culated.
6. Security: This is not easy to measure for a KDS
as several factors play a role. A poorly set up sys-
tem has more security gaps than a securely de-
signed KDS and vice versa.
7. User-friendliness:Since for the use of the KDS,
no additional hardware is required and users do
not have to learn anything new, regardless of
whether it is a computer keyboard or virtual key-
board on the smartphone, the KDS can be seen as
easy to use.
8. Acceptability: If a user does not accept the anal-
ysis of their typing behavior and is convinced that
entering the password by using a password man-
ager is safer, the method of keystroke dynamics
fails. For keystroke dynamics, no further means
are required. However, the procedure is little
known to the public, so it is difficult to make a
statement about it.
9. Economic Feasibility: In order to implement au-
thentication using KDS, there are a few costs: no
specific hardware, but software. Extensive user
training is also not necessary.
Not all requirements are fulfilled. A biometric au-
thentication system should be independent of the sen-
sor technology applied in the smartphone. This may
vary dependent on the KDS – and partly even on
the scenario (e. g., broken screen). Therefore, a new
learning phase per device/scenario may be needed.
6.2.2 Risks
A biometric authentication system consists of differ-
ent steps, namely the data acquisition by means of
sensors, the pre-processing of the data, the extrac-
tion, the classification, and the storage of the refer-
ence data in a database or the comparison with the
reference data resp. the decision. Inside and between
all these steps, the system is vulnerable. In the case
of keystroke dynamics, the vulnerable system is typi-
cally part of the smartphone.
The accuracy is medium accurate with a maxi-
mum of 97% according to the selected papers. Due to
the changeable nature of the typing behavior, a perma-
nent analysis may be more precise. The typing behav-
ior cannot be simply imitated by observation but is the
result of a function. However, the feature is easy to
copy, for example, by key tracking, if no other prop-
erties are used except for the rhythm. Stronger adver-
saries, like the Russian Impersonation-as-a-Service
(IMPaaS) platform (Campobasso and Allodi, 2020)
or described by Mayrhofer and Sigg (Mayrhofer and
Sigg, 2021), could probably record other properties
as well. In addition, they could use protocol weak-
nesses and potential biases in keystroke dynamic pat-
terns. These depend on the smartphone and KDSs.
With a bigger distribution, the KDSs are more main-
streamed, making it easier for adversaries. There-
fore, the method of keystroke dynamics is not secure
enough to protect from these adversaries, especially
since the user’s smartphone is typically less secure.
Evaluation Scheme to Analyze Keystroke Dynamics Methods
363

7 CONCLUSION AND OUTLOOK
With the increasing demand for stronger authentica-
tion methods, biometric authentication systems are
being improved and implemented. Due to the grow-
ing number of sensors and diverse set of user-driven
features, keystroke dynamics is an on-the-go authen-
tication method, which does not hinder the user. But
is it good enough? In order to analyze this, we first es-
tablish several requirements leading to an evaluation
scheme. This evaluation scheme was applied to com-
pare three selected approaches. Based on the compar-
ison, keystroke dynamics and the gathered require-
ments are discussed. While the pure typing rhythm
is too inaccurate, the incorporation of other factors
such as pressure strength and size helps to improve
the method. In the next step, we plan to extend the
current evaluation and analyze and compare the se-
curity of keystroke dynamics with traditional authen-
tication methods. A real-world user study helps to
evaluate data acquisition under different environmen-
tal conditions. This may lead to a common dataset,
improving the comparison of different proposed ap-
proaches. Last but not least, we evaluate the addition
of emojis and other symbols.
REFERENCES
Al-Obaidi, N. M. and Al-Jarrah, M. M. (2016). Statisti-
cal Keystroke Dynamics System on Mobile Devices
for Experimental Data Collection and User Authenti-
cation. In Proceedings of the 9th International IEEE
Conference on Developments in eSystems Engineer-
ing (DeSE), pages 123–129.
Alghamdi, S. J. and Elrefaei, L. A. (2015). Dynamic User
Verification Using Touch Keystroke Based on medi-
ans Vector Proximity. In Proceedings of the 7th In-
ternational IEEE Conference on Computational Intel-
ligence, Communication Systems and Networks (CIC-
SyN), pages 121–126.
Alt, F. and Schneegass, S. (2022). Beyond passwords –
challenges and opportunities of future authentication.
IEEE Security & Privacy, 20(1):82–86.
Campobasso, M. and Allodi, L. (2020). Impersonation-
as-a-Service: Characterizing the Emerging Criminal
Infrastructure for User Impersonation at Scale. In
Proceedings of the 2020 ACM SIGSAC Conference
on Computer and Communications Security (CCS),
pages 1665–1680.
Crawford, H. (2010). Keystroke dynamics: Characteristics
and opportunities. In Proceedings of the 8th Inter-
national IEEE Conference on Privacy, Security and
Trust (PST), pages 205–212.
de Marcos, L., Mart
´
ınez-Herr
´
aiz, J.-J., Junquera-S
´
anchez,
J., Cilleruelo, C., and Pages-Ar
´
evalo, C. (2021). Com-
paring Machine Learning Classifiers for Continuous
Authentication on Mobile Devices by Keystroke Dy-
namics. Electronics, 10(14).
Kim, D. I., Lee, S., and Shin, J. S. (2020). A New Feature
Scoring Method in Keystroke Dynamics-Based User
Authentications. IEEE Access, 8:27901–27914.
Krishnamoorthy, S., Rueda, L., Saad, S., and Elmiligi, H.
(2018). Identification of User Behavioral Biometrics
for Authentication Using Keystroke Dynamics and
Machine Learning. In Proceedings of the 2nd Inter-
national ACM Conference on Biometric Engineering
and Applications (ICBEA), pages 50–57.
Lee, H., Hwang, J. Y., Kim, D. I., Lee, S., Lee, S.-H.,
and Shin, J. S. (2018). Understanding Keystroke
Dynamics for Smartphone Users Authentication and
Keystroke Dynamics on Smartphones Built-In Mo-
tion Sensors. Security and Communication Networks,
2018:2567463.
Li, S. Z. and Jain, A. (2009). Encyclopedia of Biometrics.
Springer.
Maalej, A. and Kallel, I. (2020). Does Keystroke Dynam-
ics tell us about Emotions? A Systematic Literature
Review and Dataset Construction. In Proceedings of
the 16th International IEEE Conference on Intelligent
Environments (IE), pages 60–67.
Mahfouz, A., Mahmoud, T. M., and Sharaf Eldin, A.
(2017). A Behavioral Biometric Authentication
Framework on Smartphones. In Proceedings of the
2017 ACM on Asia Conference on Computer and
Communications Security (ASIA CCS), pages 923–
925.
Makrushin, A., Kauba, C., Kirchgasser, S., Seidlitz, S.,
Kraetzer, C., Uhl, A., and Dittmann, J. (2021).
General Requirements on Synthetic Fingerprint Im-
ages for Biometric Authentication and Forensic In-
vestigations. In Proceedings of the ACM Work-
shop on Information Hiding and Multimedia Security
(IH&MMSec), pages 93–104.
Mayrhofer, R. and Sigg, S. (2021). Adversary Models for
Mobile Device Authentication. ACM Comput. Surv.,
54(9).
Monrose, F. and Rubin, A. D. (2000). Keystroke dynamics
as a biometric for authentication. Future Generation
Computer Systems, 16(4):351–359.
Pisani, P. H. and Lorena, A. C. (2013). A systematic re-
view on keystroke dynamics. Journal of the Brazilian
Computer Society, 19(4):573–587.
Preibusch, S. and Bonneau, J. (2010). The Password Game:
Negative Externalities from Weak Password Practices.
In Alpcan, T., Butty
´
an, L., and Baras, J. S., editors,
Decision and Game Theory for Security, pages 192–
207. Springer Berlin Heidelberg.
Schiavone, E., Ceccarelli, A., Bondavalli, A., and Car-
valho, A. M. (2016). Usability assessment in a multi-
biometric continuous authentication system. In Pro-
ceedings of the 7th IEEE Latin-American Symposium
on Dependable Computing (LADC), pages 43–50.
Shekhawat, K. and Bhatt, D. P. (2019). Recent Advances
and Applications of Keystroke Dynamics. In Proceed-
ings of the International IEEE Conference on Com-
ICISSP 2023 - 9th International Conference on Information Systems Security and Privacy
364

putational Intelligence and Knowledge Economy (IC-
CIKE), pages 680–683.
Singh, S., Inamdar, A., Kore, A., and Pawar, A. (2020).
Analysis of Algorithms for User Authentication us-
ing Keystroke Dynamics. In Proceedings of the In-
ternational IEEE Conference on Communication and
Signal Processing (ICCSP), pages 0337–0341.
Srivastava, H. (2013). A Comparison Based Study on Bio-
metrics for Human Recognition. IOSR Journal of
Computer Engineering, 15:22–29.
Teh, P. S., Teoh, A. B. J., and Yue, S. (2013). A Survey of
Keystroke Dynamics Biometrics. The Scientific World
Journal, 2013:408280.
Zamsheva, M., Deutschmann, I., Julitz, D., and Bienert, A.
(2020). Person Authentication with BehavioSense Us-
ing Keystroke Biometrics. In Proceedings of the Inter-
national ACM Conference on Pattern Recognition and
Intelligent Systems (PRIS).
Zirjawi, N., Kurtanovic, Z., and Maalej, W. (2015). A Sur-
vey about User Requirements for Biometric Authen-
tication on Smartphones. In Proceedings of the 2nd
IEEE Workshop on Evolving Security and Privacy Re-
quirements Engineering (ESPRE), pages 1–6.
Evaluation Scheme to Analyze Keystroke Dynamics Methods
365
