
Building a DNA Methylation Aging Clock Model on Less Labelled
Data Using Item Response Theory
Keiji Yasuda
1,2
, Miyuki Nakamura
1
, Masatoshi Nagata
1
and Masaru Honjo
1
1
KDDI Research, Inc., 2-1-15 Ohara, Fujimino, Saitama, 356-8502, Japan
2
Nara Institutes of Science Technology, 8916-5 Takayama-cho, Ikoma, Nara 630-0192, Japan
Keywords: DNA Methylation Aging Clock, Item Response Theory, Biomarkers for Aging.
Abstract: A method is proposed for DNA methylation analysis using item response theory. The analysis method consists
of two steps: a cytosine phosphate guanine (CpG) sites selection step, and a parameters estimation step.
Experiments are carried out to compare several CpG site selection conditions and evaluate if item response
theory (IRT) can be applied to methylation analysis. According to the results of an experiment on public data
measured by infinium HumanMethylation450 BeadChip, even under the condition of less age-labelled
epigenetic data, CpG site filtering works well and the following IRT-based epigenetic clock model produced
precise performance.
1 INTRODUCTION
The development of DNA sequence analysis
technologies has enabled not only DNA genotyping
but also measurement of epigenetic information such
as DNA methylation level. DNA methylation
phenomena are often observed at cytosine phosphate
guanine (CpG) sites where a cytosine base is followed
by guanine base.
By using methylation analysis, some molecular
biology studies have revealed the impacts of DNA
methylation within an organism such as repression of
gene expression (Jones, 2012). Other studies
(Horvath, 2013, Hannum et al., 2013, Liu et al., 2020)
in this field have identified the relationship between
DNA methylation and aging. This research has
resulted in the development of several analysis
methods that use DNA methylation information as
aging indicators, often referred to as the epigenetic
clock.
The main idea of conventionl epigenetic clock
reseach is to use methylation levels of CpG sites to
predict biological age using a regression model. Since
the dimension size of independent variables is very
large, regularized regression models are often used to
avoid the effect of multicollinearity.
This paper describes a new methylome analysis
method for the epigenetic clock. The method
incorporates item response theory (IRT) which has
been developed and used in the field of psychometric
research. This method has two strong advantages.
One is robustness against methylation measurement
noise such as the batch effect. The other is its
applicability to unlabelled (age unknown) epigenome
data.
In this paper, section 2 describe related work in
the field of epigenetic clock research. Section 3
explains the proposed analysis method including
formulation of IRT. Section 4 shows the
experimental results. Finally, section 5 concludes the
paper.
2 RELATED WORK
It is known that the DNA methylation pattern in the
human genome is associated with individual
chronological age. Some specific genomic position
(CpG site) shows a differential methylation level. To
date, several epigenetic clock models have been
proposed to predict biological/chronological age
using differential methylation patterns (Horvath,2013,
Hannum et al., 2013). These epigenetic clocks consist
of different subsets of CpG sites that are selected from
450K or more sites measured by Infinium®
HumanMethylation450 BeadChip or a high-
throughput sequencer. Notably, the subsets of CpG
sites derived from different epigenetic clocks are
Yasuda, K., Nakamura, M., Nagata, M. and Honjo, M.
Building a DNA Methylation Aging Clock Model on Less Labelled Data Using Item Response Theory.
DOI: 10.5220/0011624400003414
In Proceedings of the 16th International Joint Conference on Biomedical Engineering Systems and Technologies (BIOSTEC 2023) - Volume 3: BIOINFORMATICS, pages 139-145
ISBN: 978-989-758-631-6; ISSN: 2184-4305
Copyright
c
2023 by SCITEPRESS – Science and Technology Publications, Lda. Under CC license (CC BY-NC-ND 4.0)
139

highly divergent (Liu et al., 2020), implying that they
reflect distinct aspects of biological age.
For age prediction by epigenetic clocks, linear
regression models, such as elastic net regression, have
been widely used (Horvath 2013, Hannum et al., 2013,
Field et al., 2018). In addition to using linear
regression models, neural network models have been
developed in recent years to predict age (Galkin et al.,
2021, Lima Camillo et al., 2022). However, it is
known that the DNA methylation level at some CpG
sites is susceptible to DNA methylation measurement
platforms (Shu et al., 2020). Indeed, the predicted
ages obtained using DNA methylation sometimes
suffer from technical noise, resulting in relatively
large errors of up to 9 years (Higgins-Chen et al.,
2022).
The analysis method presented in this paper
differs from conventional epigenetic clock research in
two crucial aspects. One is the robustness against
methylation measurement noise and the other is the
ability to use data without an age label.
3 PROPOSED ANALSYSIS
METHOD
This section explains IRT and the methylome analysis
method using IRT. First, formulation of IRT is shown.
Then, we explain how IRT can be applied to
methylation analysis.
3.1 Item Response Theory
Item response theory (IRT) is a psychometric model
which enables the latent traits of human subjects to be
estimated from test results. Currently, IRT is being
used for crucial tests such as the Test of English for
International Communication (TOEIC), Test of
English as a Foreign Language (TOEFL) and the
Graduate Record Examination (GRE).
IRT research has a long history and several
models have been proposed since the advent of
modern test theory (Rash, 1960), including 3-
parameter logistic models (Barton, 1981), the graded
response model (Samejima, 1969), and the
continuous response model (Samejima, 1973). In our
research, we use a 2-parameter logistic (2PL) model
(Birnbaum, 1968), which is the second simplest
model among several IRT models. The following
parts of this subsection explain the formulation of the
2PL model.
As a precondition, the target test consists of
multiple test items (𝑖∈𝐼) which are answered by
multiple human subjects (𝑠∈𝑆). As a result of testing,
we obtain the response matrix 𝑥
,
∈𝑋
×
which has
binary elements. Here 0 and 1 stand for the wrong and
correct answer, respectively.
2PL expresses each item using 2 parameters
( 𝑎
,𝑏
), which are item discrimination and item
difficulty. By using a logistic function, 𝑝
,
, which is
the probability that human Fsubject 𝑠 with latent trait
(𝜃
) gives a correct answer to item 𝑖, is modeled by
the following formula
𝑃
,
𝑥
,
=1𝜃
,𝑎
,𝑏
)=
(
)
(1)
where 𝐷(= 1.7 ) is a scaling constant.
Given 𝑋 , the marginal maximum likelihood
method (Hsieh, 2010) estimates item parameters
(𝑎
,𝑏
). Then, the latent traits of each human subject
are estimated on 𝑋 and estimated item parameters by
the maximum likelihood method. In this study, we
use this flow, which is the most basic approach for
IRT parameter estimation. However, there are several
different algorithms for IRT parameter estimation
such as Bayesian estimation or deep learning (Hsieh,
2010, Yeung, 2019).
3.2 Progressive Methylation Status
Modelling by IRT
An elastic net model, which is a frequently used
regression model in conventional epigenetic clock
research, selects useful CpG sites and builds a
regression model at the same time. However, a 2PL
IRT model does not suitable CpG site selection from
all available CpG sites since this model presumes
single dimensionality of latent traits, while available
CpG sites can contain multiple latent traits. Hence,
we apply CpG site selection from all available CpG
sites as a first step. As the second step, we apply IRT
to selected CpG sites. After item parameter
estimation, we exclude CpG sites with too large
(𝑎
>10 ) or too small (𝑎
<0.5 ) value
discrimination parameters because such CpG sites are
regarded as too peaky or less informative to be used
for epigenetic clock research.
For CpG site selection, we compare several
selection methods as follows
Selection with full data: Selects the CpG sites
by the correlation coefficient (𝑟
) calculated by
the following formula.
𝑟
=
1
𝑆
∑
(𝑧
,
−𝑧̅
,
)(𝑐
−𝑐̅
)
1
𝑆
∑
(𝑧
,
−𝑧
̅
,
)
1
𝑆
∑
(𝑐
−𝑐
̅
)
(2)
BIOINFORMATICS 2023 - 14th International Conference on Bioinformatics Models, Methods and Algorithms
140

Table 1: Data set for the experiments.
Table 2: Experimental conditions for CpG site selection.
where 𝑐
is the chronological age of human
subjects 𝑠, and 𝑧
,
is preprocessed value
of methylation rate at CpG site i of human
subject s. Details of the preprocessing are
explained in 4.1.1. Here, the correlation
coefficients are calculated on the training data
set.
Selection with Less Data: The only difference
between this selection and the previously
mentioned selection is the data set used for the
coefficient calculation. Here, we use a small-
sized development data set instead of a training
set.
Selection without Age Information: Selects
CpG sites based on the Item-Test or Item-Total
(I-T) correlation (𝑟
) given by the following
formula.
𝑟
=
1
𝑆
∑
𝑧
,
−𝑧̅
,
(
𝑡
−𝑡
̅
)
1
𝑆
∑
𝑧
,
−𝑧̅
,
1
𝑆
∑(
𝑡
−𝑡
̅
)
(3)
where
𝑡
= 𝑧
,
(4)
This method is often used to filter out unsuitable
test items (Henrysson, 1963), when the test is
designed.
CpG site selection with full data is the same data
usage setting as that employed in conventional
research of epigenetic clock that uses age information
and methylation rates of CpG sites for all human
subjects. Semi-supervised selection and unsupervised
settings are new settings for epigenetic clock research.
These settings focus on effective utilization of
epigenome data, which do not contain age
information on human subjects. We refer to a setting
of small-size well-regulated data and large-size not
well-regulated data availability as “selection with less
data setting.” And, “CpG site selection without an
age information setting” is a setting where we have
large-size data but the data has no age label for each
human subject at all.
For the following IRT parts, we simply consider
each selected CpG site as a test item, then apply IRT
to estimate item (CpG sites) parameters and the DNA
methylation aging clock as latent traits (𝜃
). Since
IRT does not use age information for parameter
estimation, it is expected to model progressive
methylation status as a latent trait.
Apart from the single-cell experimental setting,
methylation measurement results are given as
averaged methylation rate on multiple cells. In such a
case, we simply binarize the methylation rate using a
threshold of 0.5 before applying IRT. This binarize
preprocessing has both an advantage but also a
disadvantage. The advantage is gaining robustness
against methylation measurement noise such as the
batch effect. The disadvantage is that binarization
reduces the information. Although binarization
preprocessing has this disadvantage, robustness
against noise is a very important aspect especially
when we use epigenetic data collected by other
studies.
Data set type Average age Minimum age Maximum age # of subjects (S )# of CpG sites (I )
Test set 54.22 20 99 142 13,751
Development set 56.30 21 90 142 13,751
Training set 54.91 20 112 1,138 13,751
Building a DNA Methylation Aging Clock Model on Less Labelled Data Using Item Response Theory
141
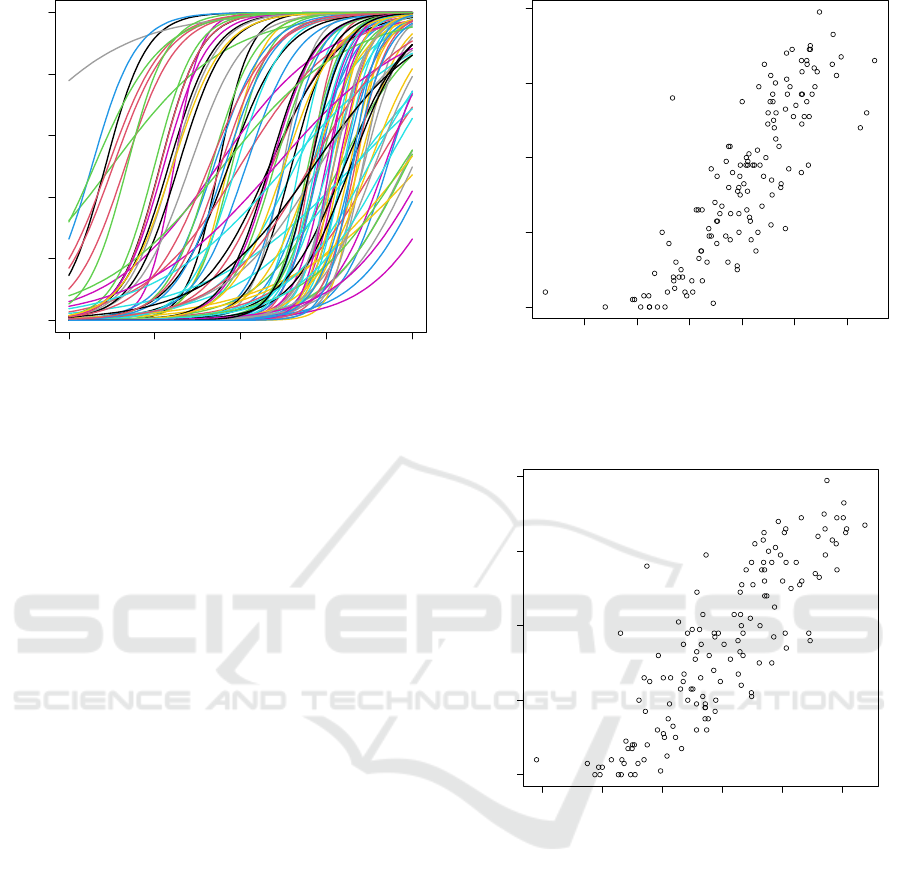
Figure 1: Item characteristic curve (CpG site selection with
full data).
4 EXPERIMENTS
4.1 Experimental Settings
For the experiments, we used epigenome open data
(Xion et al., 2022) measured by infinium
HumanMethylation450 BeadChip (450K). The data
consist of epigenetic read data from 21 body tissues.
From these 21 tissues, we use whole blood data
because the data of the tissue contains the largest
number of human subjects.
4.1.1 Data and Pre-Processing
Before we carry out CpG site selection and IRT
experiments, we apply the following pre-processing
as data cleaning.
Step 1: We discard subjects aged under 20 years.
(1,422 subjects remained after this step.)
Step 2: CpG sites containing missing values are
discarded. (166,863 CpG sites remained after
this step)
Step 3: If the correlation coefficient calculated
by Eq. 2 is the negative value for CpG i, we
covert raw value of the methylated rate 𝑧
,
(∈𝑍)
as follows
If ( 𝑟
< 0)
foreach 𝑠∈𝑆
Figure 2: Relationship between human subjects’ age and
estimated latent trait on the test set (CpG site selection with
full data).
Figure 3: Relationship between subjects’ age and estimated
latent trait on the test set (CpG site selection with less data).
𝑧
,
=1−𝑧
,
else
foreach 𝑠∈𝑆
𝑧
,
=𝑧
,
The pre-processing in this step is to align
methylation direction toward aging.
Step 4: Randomly divide 1,422 subjects into
three sets, the test set, development set and
training set. (Each of these sets contain 142, 142
and 1,138 subjects, respectively.)
−4 −2 0 2 4
0.00.2 0.81.0
La
t
en
t
t
r
ai
t
Probability of methylation
0.4 0.6
−3 −2 −1 0 1 2
20 40 60 80 100
Latent trait
Chronological age
−3 −2 −1 0 1 2
20 40 60 80 100
Latent trait
Chronological age
BIOINFORMATICS 2023 - 14th International Conference on Bioinformatics Models, Methods and Algorithms
142
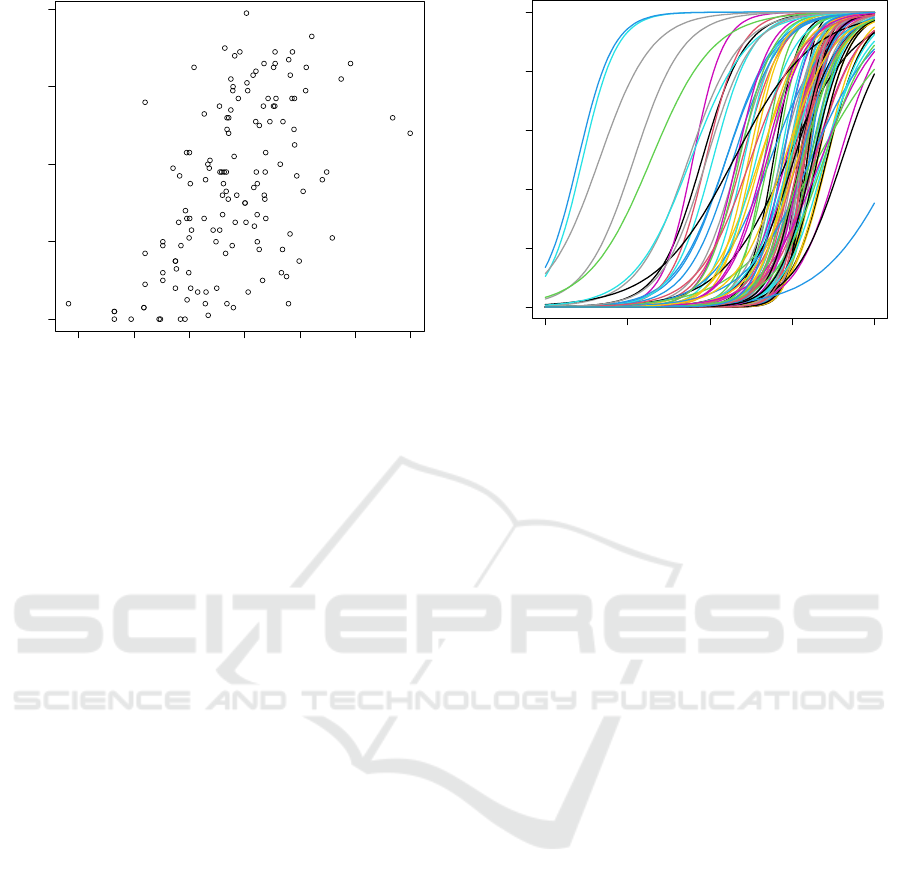
Figure 4: Relationship between subjects’ age and estimated
latent trait on the test set (selection without age
information).
Step 5: Binarize methylation rate of each CpG
site applying a threshold of 0.5 as follows
If (𝑧
,
≤0.5)
𝑥
,
=0
else
𝑥
,
=1
Step 6: Remove CpG sites if 10% or fewer
subjects have a value of 0 or 1. (13,751 CpG
sites remained after this step.)
Table 1 shows the statistics for the data sets used
for CpG site selection and IRT experiments.
4.1.2 Experimental Conditions
As we explained in 3.2, we carried out CpG site
selection experiments under three different
conditions. Table 2 shows the data usage for CpG
selection and the IRT experiments. As shown in the
table, item parameter estimation and the evaluation
process are performed under the same condition.
Since the item parameter estimation process does not
require a correct value for latent traits, we only use
the binarized CpG methylated rate for the estimation.
Each selection condition is evaluated by the results of
the following IRT process. For the evaluation metric,
we employ the correlation between chronological age
and estimated latent traits on the test set. Thus, we use
the age information of the test set for the evaluation.
Figure 5: Item characteristic curve (CpG site selection
without age information).
4.2 Experimental Results
First, we show the experimental results of CpG site
selection with full data. Here, we select the top 100
CpG sites that were highly correlated with subjects’
age on the training set. Figure 1 shows item
characteristic curves which are the results of item
parameter estimation on the 100 CpG sites. In this
figure, the horizontal axis indicates latent trait (𝜃) and
vertical axis indicates methylation probability, which
is 𝑃
(
𝑥
=1
|
𝜃). As shown in the figure, many of the
100 CpG sites tend to be methylated in high latent
trait, which indicates an older person. However, there
are still some CpG sites which are methylated in
lower latent trait. By using the estimated item
parameters, we estimate the latent trait of human
subjects on the test set. Figure 2 shows the
relationship between estimated latent trait and the
chronological age of human subjects. As shown in the
figure, there is high correlation between the two sets
of values (r = 0.850). These results demonstrate the
efficiency of 2PL IRT for methylation analysis in
epigenetic clock research.
Second, we show the results of CpG site selection
with less data. Figure 3 shows the relationship
between estimated latent traits and the chronological
age of human subjects. Also 100 CpG sites are
selected by the correlation with age on the
development set. The only condition that differs
between the settings of Fig. 2 and 3 is the data used
for CpG site selection. As shown in the figure, a high
correlation is observed between the two sets of values
(r = 0.836). These results show the possibility of
using age label-less epigenetic data, provided smaller
age labelled data are available.
−3 −2 −1 0 1 2 3
20 40 60 80 100
Latent trait
Chronological age
−4 −2 0 2 4
0.00.2 0.81.0
Latent trait
Probability of methylation
0.4 0.6
Building a DNA Methylation Aging Clock Model on Less Labelled Data Using Item Response Theory
143

Figure 6: Test information function of CpG site set selected
without age information.
Third, we show the results of CpG site selection
without age information. Figure 4 shows the
relationship between estimated latent traits and the
chronological age of human subjects in the case
where age label-less selection is applied. Here, CpG
sites are selected by IT correlation calculated by Eq.
3 on the training set. The same number of CpG sites
as the previous experiments are used for item
parameter estimation. Comparing the results in Fig4
to Fig. 2, the correlation between the two sets of
values is very low (r = 0.528). Figure 5 shows the
item characteristic curves of the selected 100 CpG
sites. Looking at the figure, variation in the 𝑏
parameter
1
is very small. Most of them have a value
greater than 0. These findings indicate that these CpG
sites are not useful for estimating latent traits less than
0. Figure 6 shows fisher information (𝐼
(𝜃))
given by Eq. 5.
𝐼
(𝜃)=
∑
𝐷
𝑎
𝑃
(𝜃)(1 − 𝑃
(𝜃))
(5)
𝐼
(𝜃) is also called as test information function
which is used to calculate variance of estimated 𝜃
(𝑉[𝜃
|𝜃]) by the following formula.
𝑉𝜃
𝜃=1/𝐼
(𝜃)
(6)
In the figure, the vertical and horizontal axes indicate
𝐼
and 𝜃, respectively. According to the figure,
the set of CpG sites has a very small amount of
information to estimate 𝜃 where it is less than 0. By
incorporating viewpoint of test information in the
future work, we may improve the deviation in low
value range of 𝜃 (𝜃 < 0 in Fig 4) .
1
𝑏
= 𝜃, when 𝑃
(
𝑥
=1
)
= 0.5
Figure 7: Relationship between data size and test set
correlation.
4.3 Discussion on Data Size
Here, we discuss data size for selection with less data
condition. The previous subsection showed the
results of the selection using the development set
which consists of methylation data of 142 age-known
human subjects. In this subsection, we change
development set size from 10 to 142 subjects by
random sampling from the original development set.
Then, apply selection and IRT experiments in the
same manner as the previous experiments.
Figure 7 shows the results of the experiments.
In the figure, the horizontal axis indicates data
size of the development set. And the vertical axis
indicates correlation between the chronological age
and latent trait on the test set. For each condition, top
100 CpG sites are selected based on correlation
calculated by Eq. 2. Then, apply IRT parameters
estimation for each selected CpG sites.
As shown the figure, estimated latent trait
correlates well with chronological age, even if only
20 age-known subjects are available for the CpG site
selection.
5 CONCLUSIONS AND FUTURE
WORK
We proposed an IRT-based method for methylation
analysis. First, the method selects CpG sites using a
correlation-based metric, then applies IRT to selected
data. In the experiments, we compared three selection
conditions using open epigenome data measured on
whole blood by infinium Human Methylation 450
BeadChip.
−4−2024
0 20406080100120
Latent trait
Information
0.5
0.55
0.6
0.65
0.7
0.75
0.8
0.85
0.9
0.95
1
0 102030405060708090100110120130140150
Correlation Coeficient
Number of subjects for CpG filtering
BIOINFORMATICS 2023 - 14th International Conference on Bioinformatics Models, Methods and Algorithms
144

According to the experiments, CpG site selection
with partially or fully age-labeled data works well
with following IRT parameter estimations. Since the
IRT parameter estimation part does not use any age
information, the model is thought to estimate
progressive methylation status as a latent trait.
Meanwhile, CpG site selection with no age
information does not work well. Further analysis
shows that the selected CpG sites have small variation
in the difficulty parameter (b_i), and this causes
deviation in low value range of θ. In future research,
we will improve age label-less selection by
considering not only IT-correlation but also the test
information of a set of CpG sites. Another unfinished
work is an evaluation of each item (CpG site) based
on item fit statistics. By removing the CpG site whose
response does not fit to logistic function, we may
improve the analysis results.
Differing from the conventional regression
method, IRT-based analysis gives rich information
such as discrimination and difficulty parameters for
each CpG site. These parameters are thought to
indicate “how fast” and “when” CpG sites will be
methylated. We will also advance our research in
relation to these points of view.
REFERENCES
Barton, M. A. et al. (1981). An upper asymptote for the
three-parameter logistic item-response model.
Princeton, N.J.: Educational Testing Service.
Birnbaum, A. (1968). Some Latent Trait Models and their
Use in Inferring an Examinee’s Ability, Statistical
Theories of Mental Test Scores (pp. 397–479).
Field, A.E. et al. (2018). DNA Methylation Clocks in
Aging: Categories, Causes, and Consequences.
Molecular Cell, volume 71, issue 6, pp.882-895.
Galkin, F., et al. (2021), DeepMAge: A Methylation Aging
Clock Developed with Deep Learning. Aging and
disease, volume 12, issue 5, pp. 1252-1262.
Hannum, G. et al. (2013). Genome-wide Methylation
Profiles Reveal Quantitative Views of Human Aging
Rates, volume 49, issue 2, pp. 359-367.
Henrysson, Sten (1963). Correction of item-total
correlations in item analysis. Psychometrika, volume
28, issue 2, pp.211–218.
Higgins-Chen, A.T., et al. (2022) A computational solution
for bolstering reliability of epigenetic clocks:
implications for clinical trials and longitudinal tracking.
Nature Aging, volume 2, pp. 644–661.
Horvath, S. (2013). DNA methylation age of human tissues
and cell types. Genome Biology, volume 14, p. 3156.
Hsieh, M. (2010). A Comparison of Bayesian MCMC and
marginal maximum likelihood methods in estimating
the item parameters for the 2PL IRT model,
International Journal of Innovative Management,
Information & Production, volume 1, Number 1, pp.81-
89.
Jones, P. A. (2012). Functions of DNA methylation:
islands, start sites, gene bodies and beyond, Nature
Reviews Genetics, volume 13, pp. 484–492.
Lima Camillo, L.P. et al. (2022). A pan-tissue DNA-
methylation epigenetic clock based on deep learning.
npj Aging 8, article number 4.
Liu, L. et al. (2020). Underlying features of epigenetic
aging clocks in vivo and in vitro. Aging Cell, volume
19, issue 10.
Rash, G. (1960). Probabilistic models for some intelligence
and attainment tests, Danish Institute for Educational
Research.
Samejima, (1969). F. Estimation of latent ability using a
response pattern of graded scores, Psychometrika
Volume 34, pp. 1–97.
Samejima, F. (1973). Homogeneous case of the continuous
response model. Psychometrika, volume 38, pp.203–
219.
Shu, C. et al. (2020). Comparison of methylation capture
sequencing and Infinium MethylationEPIC array in
peripheral blood mononuclear cells. Epigenetics &
Chromatin, volume 13, article number 51.
Yeung, C. (2019). Deep-IRT: Make deep learning based
knowledge tracing explainable using item response
theory, Proc. of the 12th International Conference on
Educational Data Mining.
Xiong, Z. et al. (2022). EWAS Open Platform: integrated
data, knowledge and toolkit for epigenome-wide
association study, Nucleic Acids Research, volume 50,
Issue D1, pp. D1004–D1009.
Building a DNA Methylation Aging Clock Model on Less Labelled Data Using Item Response Theory
145
