
Interactive Indoor Localization
Based on Image Retrieval and Question Response
Xinyun Li
1
a
, Ryosuke Furuta
2 b
, Go Irie
1 c
, Yota Yamamoto
1 d
and Yukinobu Taniguchi
1 e
1
Department of Information and Computer Technology, Tokyo University of Science, Tokyo, Japan
2
Institute of Industrial Science, The University of Tokyo, Tokyo, Japan
Keywords:
Indoor Localization, Image Recognition, Similarity Image Search, Scene Text Information.
Abstract:
Due to the increasing complexity of indoor facilities such as shopping malls and train stations, there is a need
for a new technology that can find the current location of the user of a smartphone or other device, as such
facilities prevent the reception of GPS signals. Although many methods have been proposed for location
estimation based on image search, accuracy is unreliable as there are many similar architectural indoors,
and there are few features that are unique enough to offer unequivocal localization. Some methods increase
the accuracy of location estimation by increasing the number of query images, but this increases the user’s
burden of image capture. In this paper, we propose a method for accurately estimating the current indoor
location based on question-response interaction from the user, without imposing greater image capture loads.
Specifically, the proposal (i) generates questions using object detection and scene text detection, (ii) sequences
the questions by minimizing conditional entropy, and (iii ) filters candidate locations to find the current location
based on the user’s response.
1 INTRODUCTION
The number o f pedestrians getting lost has been in-
creasing becau se of the increasing complexity of in-
door facilities such as shopping malls. Accordingly,
there is need for a new technology for smartphones or
other devices that can ea sily determine the user’s cur-
rent location. The indoor location market is projected
to grow from USD 8.8 billion in 2022 to USD 24.0
billion by 2027, at a Com pound Annual G rowth Rate
(CAG R) of 22.4% during the forecast per iod (Market-
sandMarkets, 2022).
To achieve this goal, many localization methods
based on image recognition, such as (Torii et al.,
2015), have been p roposed and stu died in the area of
computer vision for a long time. This approach saves
pre-cap tured images with location information (refer-
ence images) in a database, and the curre nt lo c ation is
estimated by comparing the user’s image (que ry im-
age) with the refer ence images in the database and
identifyin g the closest match. This metho d does not
a
https://orcid.org/0000-0002-8920-942X
b
https://orcid.org/0000-0003-1441-889X
c
https://orcid.org/0000-0002-4309-4700
d
https://orcid.org/0000-0002-1679-5050
e
https://orcid.org/0000-0003-3290-1041
require any special equipmen t and can be used in any
location as long a s a database of reference images
is availab le . However, unlike outdoor locations, in-
door locations have many similar architectu ral fea-
tures, such as a cluster of restaurants and clothing
stores as shown in Figure 1, an d there are few un-
ambiguous cues available for loc a lization. Theref ore,
a single query image is usually not enough to achieve
high accuracy.
To solve the indoor specific problems, among
the many solutions, (Chiou et al., 2020; Li et al.,
2021) have been proposed to improve accuracy by in-
creasing the number of capture directions used as in-
put. However, taking multiple query images is time-
consumin g, and increases th e issue of legal and ethi-
cal consider ations, such as the difficulty of taking p ic -
tures when a person is in fro nt of the camera.
To r e duce the number of query images while keep-
ing the accuracy, we propose a method for accurately
estimating the current indoor location by asking the
user to answer generated questions. The main con-
tribution of this paper are as follows: (i) Our pr o-
posal yields highly a ccurate interactive localization
by short question-response sequences with the user.
The question(s) are generated by object detection and
scene text detection. (ii) To redu c e the number of
question-responses, we propo se a q uestion selection
796
Li, X., Furuta, R., Irie, G., Yamamoto, Y. and Taniguchi, Y.
Interactive Indoor Localization Based on Image Retrieval and Question Response.
DOI: 10.5220/0011624300003417
In Proceedings of the 18th International Joint Conference on Computer Vision, Imaging and Computer Graphics Theory and Applications (VISIGRAPP 2023) - Volume 4: VISAPP, pages
796-803
ISBN: 978-989-758-634-7; ISSN: 2184-4321
Copyright
c
2023 by SCITEPRESS – Science and Technology Publications, Lda. Under CC license (CC BY-NC-ND 4.0)
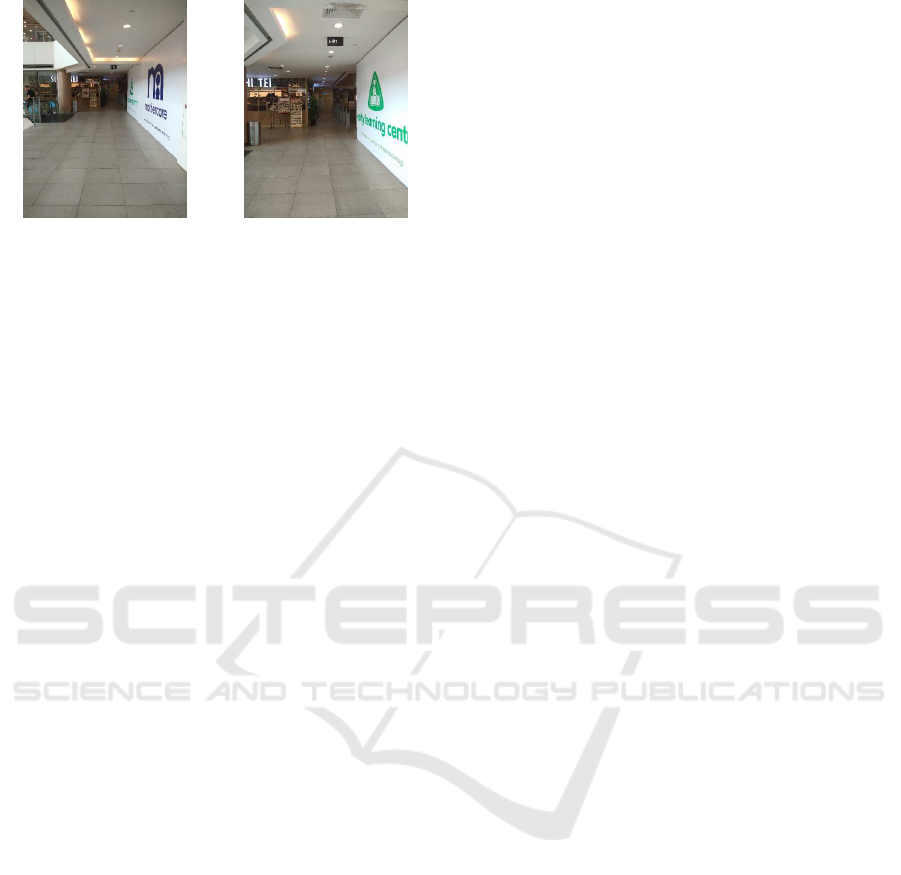
(a) (b)
Figure 1: (a) and (b) are similar, but they are actually about
10 m apart.
method based on conditiona l entropy. This reduces
the number of needed query to 1, and the user need to
respond with only “ye s” or “no” to an average of 2.75
questions to get location information. (iii) Expe ri-
ments on two shopping mall datasets show that the
proposed method can achieve better accuracy than th e
non-interactive m ethod comp a red (Chio u et al., 2020;
Li et al., 2021 ), which c aptures images in multiple di-
rections while keeping the number of images taken to
a single shot.
2 RELATED WORKS
2.1 Localization Based on Image Search
Many indoor localization methods using images have
been proposed . Examples (Gao et al., 2016; Dong
et al., 20 19) include using images captured by a
smartphone in combination with sensors to identify
the location. Although these methods are able to re-
duce the cost of cr e ating reference im ages, in complex
indoor environments the signal is subject to strong in-
terference which degrades accuracy.
As a method that uses only images, and so dis-
penses with sen sors, (Taira et al., 2018 ) u se dense
features such as DenseSI FT (Liu et al., 2008) and
estimate 6DoF camera poses to achieve highly ac-
curate localization on a large scale. (Li and He,
2021) p roposed a robust localization method for dy-
namic environments that uses video images and text
informa tion. The method pro posed by (Wan g et al.,
2015) uses text dete ction, shop facade segmentation,
and map information. In addition, (Radenovi´c et al.,
2018) proposed Ge neralized Mean Pooling (G eM
Pooling), which generalizes the pooling layer calcu-
lation for similar image search when extrac ting image
features using convolutional ne ural networks (CNN);
they demon strated high accu racy.
In this paper, we use image features from GeM
Pooling for a similar image search and improve the
accuracy by ad ding interaction b y question an d re-
sponse.
2.2 Localization Using Multi-View
Images
(Liu et al., 2017) proposed a meth od for estimating
the current location from images and geomagnetic
signals by processing multi-view images in Multi-
view Graph (MVG). They condu cted extensive exper-
iments on three types of buildings and showed that an
accuracy of 1 m was successfully achieved even when
noise and outliers occupied 30% of the data. How-
ever, the method does not acco unt for differences be-
tween views, and thus cannot cap ture robust local rep-
resentations.
To solve this problem, (Chiou et al., 2020) pro-
posed Gra ph Location Ne tworks (GLN), a new ar-
chitecture based on Graph Convolutional Networks
(GCN). This method extracts features from multi-
view images using ResNet152 trained on Image Net
and uses GCN, whose nodes represent the locations
of image captu re points, to connect location info rma-
tion and image features; it offers robust estimation o f
correct location. Furthermore, they use a zero-shot
learning approach to reduce the labor cost of taking
referenc e imag e s allowing the system to be deployed
in large indoor environments.
Considering the problem that there are ma ny simi-
lar architectural features indoors, (Li et a l., 2 021) pro-
posed a method that uses multi- view images w ith four
shooting directions (front, behind, left, and right) as
the query and introduced the term of multi-view im-
age distance to effectively evaluate the dissimilarity
between q uery and reference images. Although we
obtained higher accuracy than (Chiou et al., 2020),
it did not solve the problem that users have to take
many images, which is not only time-consuming but
also burdensome in te rms of legal and ethical consid-
erations.
To solve this problem, this paper focuses on es-
timating the current location by using the user’s re-
sponses to questions.
3 PROPOSED METHOD
To improve the accuracy of current location estima-
tion, this pap er proposes a method that combines im-
age search using a single query image and location
filtering by question responses (Figure 2). By asking
the user ab out th e presence or absence of store signs
Interactive Indoor Localization Based on Image Retrieval and Question Response
797

Figure 2: Flowchart of localization based on question response.
Figure 3: The result of object detection. which is used to
generate the questions.
and objects in similar architectural features, the cur-
rent location can be identified more precisely. The
flow of the proposed m e thod is described below.
3.1 Similar Image Search
From a single query image taken by the user, locations
linked to the top K similar images from the database
are selected as possible locations using similarity-
based image search. In addition, the databa se in-
cludes refe rence images R
R
R
k
= {R
ka
}
a=1,2,3,4
, which
are taken in 4 directions at every location in the fa-
cility. k = 1, 2, ··· , N
R
, and N
R
are th e number of ref-
erence images.
3.2 Question Generation
Our method generates questions Q
i
(i = 1, 2, . . . ) from
all reference images R
R
R
k
in the following way.
Object Label. As shown in Figure 3, we use an
object detec tor to find objec ts (desk, chair, etc.)
and generate questions such as “Are you close to a
(object label)?” Objects that change in a short span of
time (e.g., person, bag) and objects th at do not exist
(a) The result of scene text
detection.
(b) The image to be presented
to the dr at the same time as
the generated question.
Figure 4: The scene text detection is to detect the position
of scene text from reference images and generate the most
effective questions.
indoors (e.g., dog) are not included in the search. In
the case of Figure 3, the questions “Are you close to
chairs?”, “Are you clo se to a potted plan t? ” and “Are
you close to a cup” are generated.
Scene Text Information. As shown in Figure
4, the position of scene text is detected from the
referenc e image (Figure 4(a)) and a text image
(Figure 4(b)) is presen te d to the user. At the same
time the question “Can you see this signboard?” is
generated.
3.3 Question Selection
To get the correc t answer with fewer questions, we de-
fine conditiona l entropy H
Q
i
, a measure of the amount
of information included in question Q
i
, and find the
question that has the minimum conditional entropy:
H
Q
i
= −
K
∑
k=1
∑
j∈{Yes,No}
P(B
i j
)P(A
k
|B
i j
)log
2
P(A
k
|B
i j
),
(1)
where A
k
is the event that possible location k is cor-
rect, P(B
i j
) is the posterior probability when user re-
sponds to question Q
i
with j ∈ {Ye s, No}. Its proba-
VISAPP 2023 - 18th International Conference on Computer Vision Theory and Applications
798
bility is de fined as:
P(B
i j
) =
1
K
∑
k
score
ik
, j = Yes
1
K
∑
k
(1 − score
ik
), j = No
(2)
score
ik
∈ [0, 1] is defined as the confidence score if
object class i is detected in the reference image R
R
R
k
,
and 0 if not detec ted. Also, score
ik
= 1 if scene text is
detected, and score
ik
= 0 otherwise.
P(A
k
|B
i j
) is the posterior probability when the
user is at possible location k and responds j ∈
{Yes, No} to question Q
i
. It is d efined as:
P(A
k
| B
i j
) =
score
ik
·e
S
k
∑
K
l=1
score
il
·e
S
l
,
, j = Yes
(1−score
ik
)·e
S
k
∑
K
l=1
(1−score
il
)·e
S
l
, j = No
(3)
where S
k
is the similarity between reference image R
k
and the query image.
3.4 Filtering Possible Locations
Question Q
∗
i
that has minimum conditional entr opy
Q
∗
i
= arg min
i
H
Q
i
(4)
will be asked to the user, and we remove the possible
locations that do not match the user’s response. The
process stops when the number of possible locations
is reduced to one, or when there are no more questions
to ask the user. If all the possible location s have been
removed, th e location with maximum image similar-
ity (top 1) is ou tput.
4 EXPERIMENTS
To evaluate the effectiveness of the proposed method,
the following methods were compared.
• Similar image search:
Feature vecto rs are extracted using GeM Pooling
(Radenovi´c e t al., 2018). To measure the sim ilar-
ity between images, cosine similarity is used . See
Section 4.2 for details.
• Multi-view image distance (Li et al., 2021):
Multi-view images with 4 different shooting di-
rections (front, behind , left, and right) are used
as the query. The multi-view image d istance is
the summation of the Euclidean distances of the
query and reference image pairs, which are cre-
ated withou t duplication.
• Ours
Moreover, we cond ucted an ablation study to evaluate
the
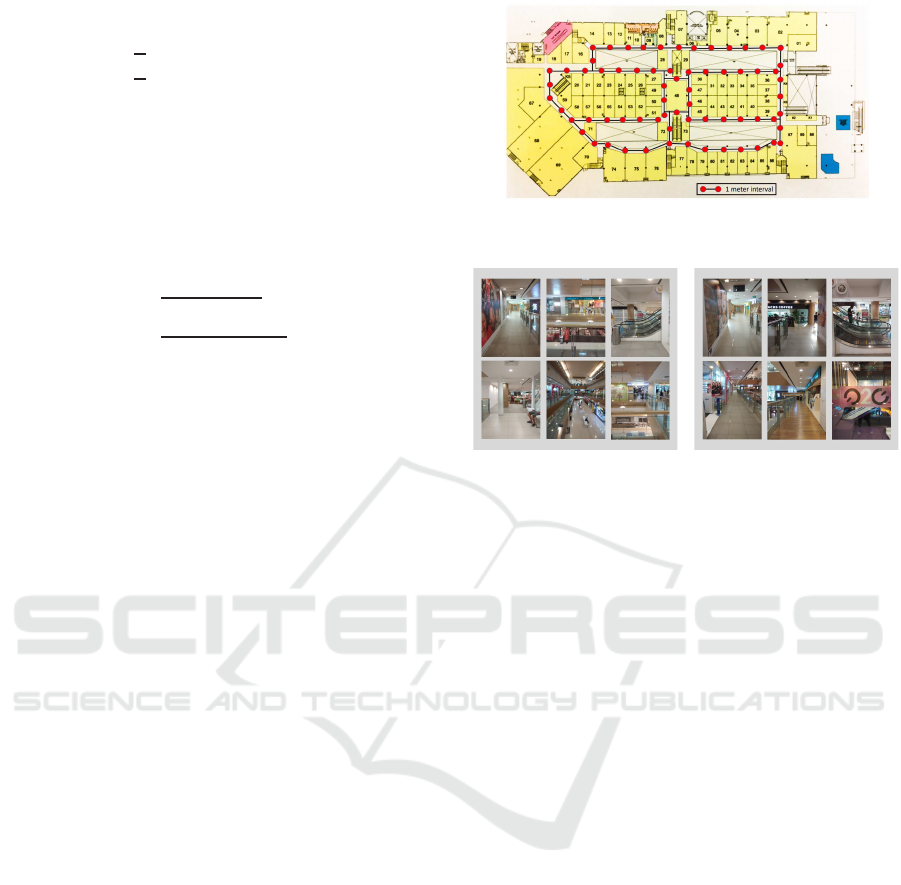
(a) An illustration of reference image locations. The map is
for illustrative purposes only (Chiou et al., 2020).
(b) Reference images. (c) Query images.
Figure 5: West Coast Plaza (WCP) Dataset (Chiou et al.,
2020).
• relationship between the number of initial possi-
ble locations and accur acy.
• effect of each question generation module.
• effectiven e ss of conditio nal entropy in question
selection.
4.1 Dataset
(a) West Coast Plaza Dataset
WCP Dataset (Chiou et al., 2020) is a public dataset
of images taken at a shopp ing mall in Singapore (floor
area: 15, 000m
2
). Examples of the reference images
and query images are shown in Figur e 5(b) and Figure
5(c), respectively. We have reference images of 316
locations × 4 directions (1, 264 images in total) taken
at about 1 m intervals, as shown in Figure 5(a), with
a Vivo Y79 and query images of 78 locations × 4 d i-
rections (312 images in total) were taken at r andom
locations with a Vivo Y79.
(b) Mall Dataset
Mall Dataset (Sun et al., 201 7) is image data taken at a
shopping mall (Figure 6(a)) in Jiangsu, China. Exam-
ples of reference images and query images taken are
shown in Figure 6(c) and Figure 6(d). The reference
images are 682 images taken with a Nikon D5300 at
about 1 m intervals (Figure 6(b)). The query images
are images taken by six different smartphone cameras.
Interactive Indoor Localization Based on Image Retrieval and Question Response
799
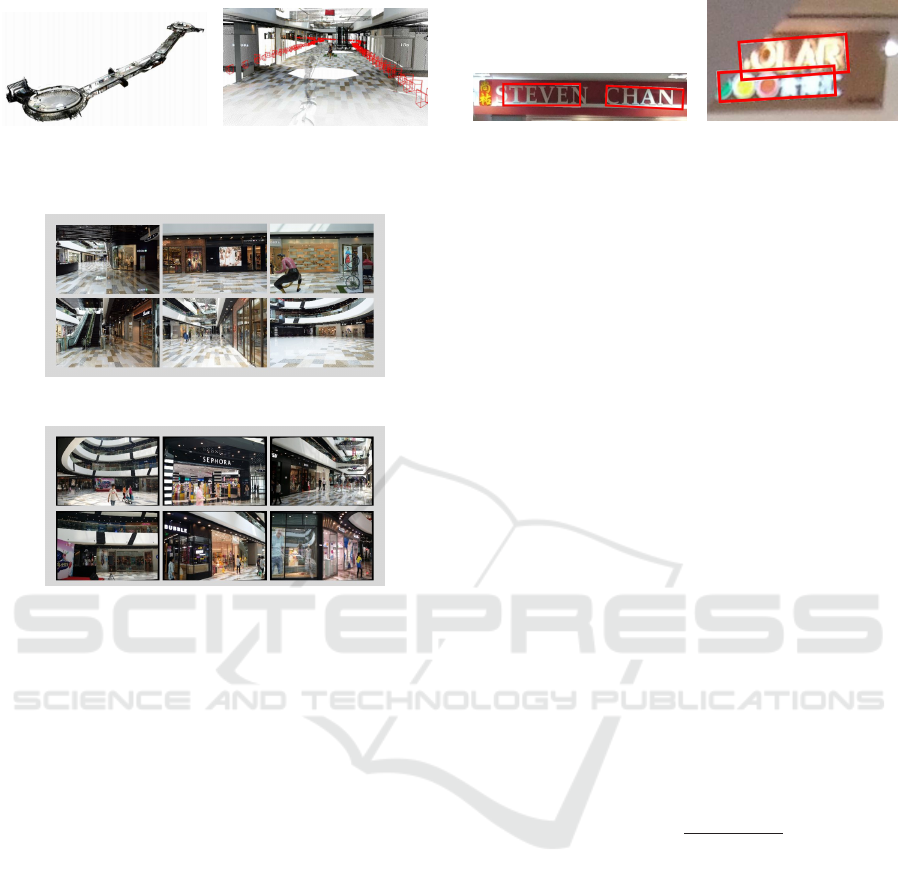
(a) Captured point cloud in
birds-eye view. (Sun et al .,
2017)
(b) Close-up of the camera
poses for capturing database
images. (Sun et al., 2017)
(c) Reference images.
(d) Query images.
Figure 6: Mall Dat aset (Sun et al., 2017).
However, in this experiment, only a subset of images
(80 images) taken with an iPhone4s were tested.
4.2 Experimental Setting
Similar Image Search. For feature extraction, we
use GeM Poolin g (Radenovi´c et al., 2018) As the
backbone network, we used ResNet152, which was
trained o n g oogle-landmarks-2018 (Noh et al., 2017),
and includes whitening. We determine similar images
by cosine similarity, and the top 5 retrieved images
are conside red a s possible ima ges.
Object Detection. Cascade Mask-RCNN (He
et al., 2017) with Swin Transformer (Liu et al., 2021)
backbone was used for object detection. Of the 3 6
types of labels detected, we kept 3 3 object labels
that have been present in indoor facilities for a long
time (desks, chairs, etc.) and removed 3 other labels
(people, dogs, bags).
Scene Text Detection. EAST (Zhou et al., 2017) was
used. Furthermore, we perform scene text recognitio n
(Bautista and Atienza, 2022) on the detected bound-
ing box. Images that were successfully recognized
(a) The image that could be
presented to the user.
Output: STEVENCHAN
(b) The image to be
deleted.
Output: -
Figure 7: The result of scene text recognition.
(Figure 7(a)) are presented to the user, while images
that failed (Figure 7( b)) are deleted .
Question Response. The 4 direction query im-
ages have the correct object label and scene text
informa tion manually assigned. Since the location
and tim e of capture of the query image and the
referenc e image do not match, the final estimation
result does not always match the correct answer,
even if the user’s answer is accurate. In addition,
the question “Are you close to **?” was a nswered
with “y es” regardless of the distance to the objects or
signboards.
4.3 Evaluation Metrics
We tested the effectiven ess of our proposed method
using two evaluation metrics and the average number
of questio ns as described below.
One-Meter-Level Accuracy. The percentage of
query images where the distances between the
estimated location and the ground truth location are
within 1 m is determined as:
Accuracy =
∑
N
query
q=1
C(I
q
)
N
query
, (5)
where, C(I
q
) is set to 1 if the distanc e from the query
images to detected location is within 1 m, and 0
otherwise. N
query
is th e number of query locations, I
q
is the q-th query image.
Cumulative Distribution Function of Localization
Error at distance x (CDF@x). The percentage
of query images where the distanc es between the
estimated location and the ground truth location are
within x m is repor ted as the second evaluation met-
ric. T he percentage of correct answers is calculated
in th e same way as in equation (5). However, C(I
q
)
was set to 1 if the distance from the query images to
detected location was w ithin x m, and 0 otherwise.
Average number of Questions. To evaluate the
efficiency of the proposed approach, we determined
VISAPP 2023 - 18th International Conference on Computer Vision Theory and Applications
800
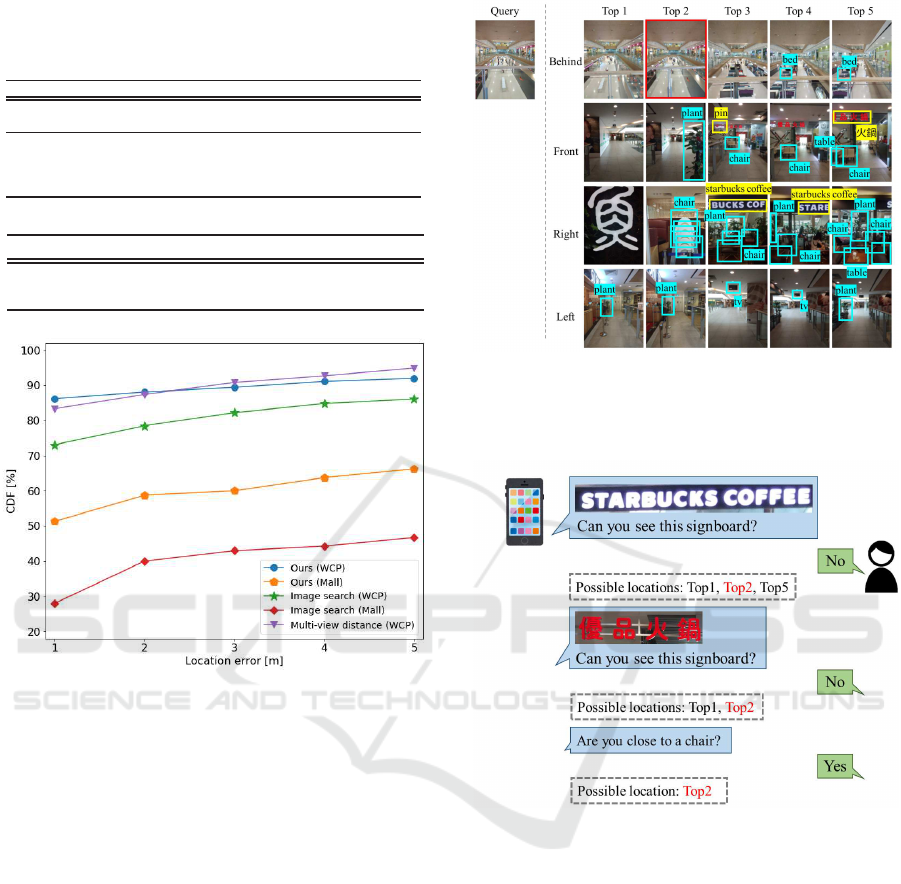
Table 1: Comparison of proposed and conventional meth-
ods.
(a) WCP Dataset
Method Direction(s) Avg. # questions Accuracy[%]
image search 1 - 73.1
Ours 1 2.75
86.2
GLN
4 - 79.9
(Chiou et al., 2020)
Multi-view distance
4 - 84.0
(Li et al., 2021)
(b) Mall Dataset
Method Av g. # questions Accuracy[%]
image search - 27.5
Ours 2.73
51.3
Figure 8: The CDF curves of the localization error of the
previous and our approaches.
the number of questions posed to the user before
there was only one possible location or no more
questions were possible.
5 RESULTS AND DISCUSSIONS
5.1 Accuracy and Average Number of
Questions
(a) West Coast Plaza Dataset
The results are shown in Table 1(a). The proposed
method improved accuracy by 13.1 points compared
to the conventional method (similar image retr ieval
with 1 sho oting direction). In other words, th e pro-
posed method achieves the same level of accuracy as
the conven tional method (Li et al., 2021) with 4 di-
rections while requiring the user to a nswer a n average
of 2.75 questions. This is 6.3 points better than GL N
and 2.2 points better than the multi-view image dis-
tance approach, both of dem and 4 query images from
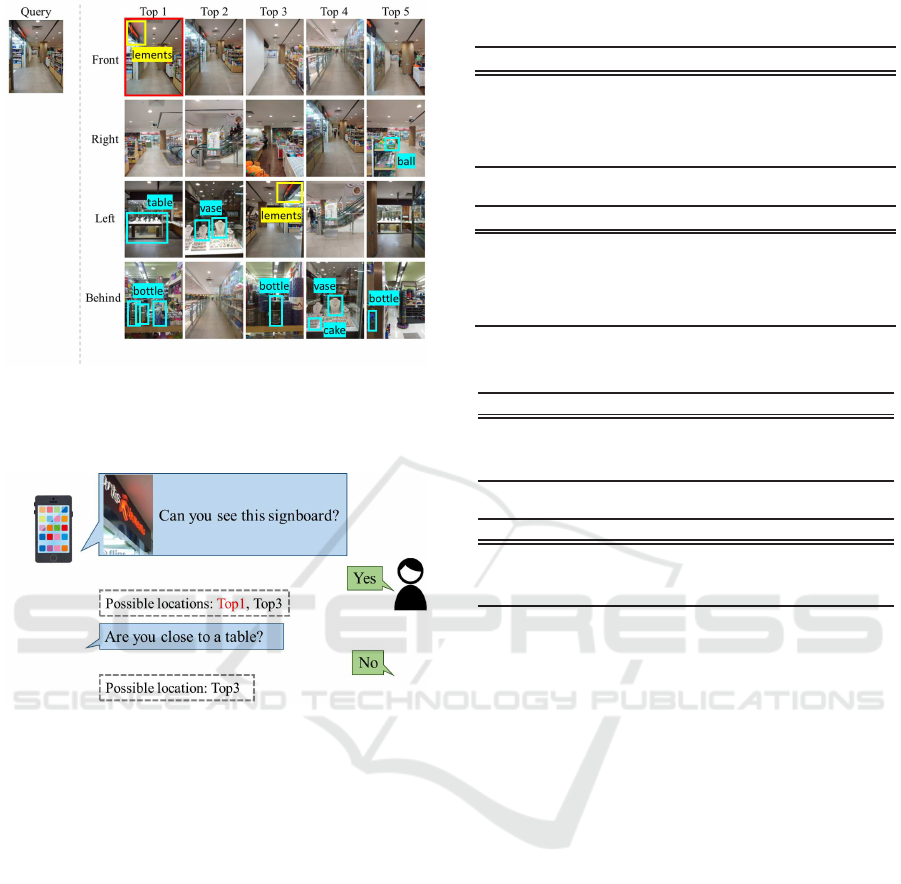
(a) The results of possible images, object detection and
scene text detection. The correct image is in
red. The re-
sults of scene text detection are in
cyan, and the results of
object detection are in
yellow.
(b) Question and response with the user. The correct loca-
tion is in
red.
Figure 9: Localization success by proposal.
different directions. Therefore, it can be said that pro-
posal offers greater a c curacy with far less user effort.
The CDF@x result, shown in Figure 8, confirm
that the proposed method achieved higher accuracy
than image searc h even when the loca tion error be-
tween the estimate d location and the ground truth
was increased to 5 m. T his fact proves the effective-
ness of the prop osed method. However, the proposed
method achieved lower accuracy than multi-view dis-
tance, when the location error was more than 3 m.
The reason may be that the generated questions do
not take into acc ount the relationship between views.
As shown in Figure 9(a), although th is query im-
age failed to get the correct answer at the top p osi-
tion using similarity image search, the c orrect answer
Interactive Indoor Localization Based on Image Retrieval and Question Response
801
(a) The results of possible images, object detection and
scene text detection. The correct image is in
red. The re-
sults of scene text detection are in
cyan, and the results of
object detection are in
yellow.
(b) Question and response with the user. The correct loca-
tion is in
red.
Figure 10: Failures of the proposal.
could be attained by generating questions like Fig ure
9(b) and Q&A with the user.
However, as shown in the failure example (Figure
10(a)), when object detection fails or the correct im-
age is missing, images that were actually correct were
deleted during Q&A with the user (Figure 10(b)).
(b) Mall Dataset
The re sults are shown in Table 1(b). Due to the
change o f object by time zone difference and the
capture of many images at an oblique direction, this
dataset achieved only 27.5% corr e ct answers in simi-
lar image retr ieval. We improved the accuracy by 23.8
points by posing an average of 2.73 questions to the
user.
Table 2: Accuracy vs. number of initial proposed locations.
(a) WCP Dataset
initial images Avg. # questions Accuracy[%]
3 1.91 84.3
5 2.75 86.2
7 3.35 86.8
10 3.96 87.1
(b) Mall Dataset
initial images Avg. # questions Accuracy[%]
3 2.11 50.0
5 2.73 51.3
7 3.23 52.5
10 3.49 56.3
Table 3: Impact of question generation modules.
(a) WCP Dataset
Method Avg. # questions Accuracy[%]
object only 3.26 76.9
scene text only 2.31 84.0
scene text + object 2.75
86.2
(b) Mall Dataset
Method Avg. # questions Accuracy[%]
object only 2.43 45.0
scene text only 2.08 38.8
scene text + object 2.73
51.3
5.2 Accuracy vs. Number of Initial
Possible Locations
Table 2 lists the relationship between the number of
possible images a nd accuracy. For both datasets, the
accuracy improves with the number of initial images.
Thus, it is possible to obtain the correct image by r e-
sponding to the questions. However, as this increases
the burden on the user, it is important to decide on the
optimum number of possible images.
5.3 Impact of Question Generation
Modules
As shown in Table 3, if all object labels are correctly
detected, the result is more accur ate than the result of
similar image search. However, in locations with a lot
of restaurants and clothing sto res, judg ments based
on objects alone are not enough. Similarly, the de-
tection of signboard information by scene text direc-
tion a chieve h igh accuracy, but still lower than that of
multi-view image distance (84.0%). We can see that
the combination of object label and scene text infor-
mation provides the highest accuracy.
VISAPP 2023 - 18th International Conference on Computer Vision Theory and Applications
802

Table 4: Comparisons of the results of selecting questions
randomly vs. according to conditional entropy
(a) WCP Dataset
Method Avg. # questions Accuracy[%]
random 3.01 81.3
entropy 2.75 86.2
(b) Mall Dataset
Method Avg. # questions Accuracy[%]
random 3.12 41.3
entropy 2.73
51.3
5.4 Impact of Conditional Entropy
To show the effect of conditional entropy, we com-
pared the results achieved with randomly selected
questions. As shown in Table 4, WCP Dataset and
Mall Dataset improved accuracy by 4.9 points and
10.0 points when using conditiona l entropy rather
than randomly selected questions. In selecting ques-
tions, we let the questions of scene text information,
which is comparatively easy to locate, be more likely
to be selecte d, while questions that have low con-
fidence object labels are less likely to be selected.
Therefore, localization can be more accurate. In ad-
dition, the average number of questions was also re-
duced by about 0.4.
6 CONCLUSIONS
In this paper, in order to reduce the burden on the
user and at the same time achieve highly accurate in-
door localization, we proposed a method that gener-
ates qu estions from reference images and filters the
possible locations based on responses from the user to
questions used by the method. The results o f exper-
iments on two datasets showe d that even in the case
of extremely low accuracy in similar image retrieval,
an average of 2.75 respo nses, without increasing the
number of captured query images need ed, resulted in
higher accuracy than the conventional m ethod.
As a future challenge, methods such as fine-tuning
using indoor datasets will be considered to improve
the a c curacy of obje ct detection. Furthermore, to gen-
erate questions that users are comfortable responding
to, and que stions that consider the difference betwee n
views, it is worth checking Visual Question Genera-
tion (VQG) as it can be adapted for localizatio n. Last
but not least, the problem of the fall in accura cy due
to changes in stores or objects because of timezone
differences sho uld be resolved.
REFERENCES
Bautista, D. and Atienza, R. (2022). Scene Text Recogni-
tion with Permuted Autoregressive Sequence Models.
In ECCV, Cham. Springer International Publishing.
Chiou, M. J. et al. (2020). Zero-Shot Multi-View Indoor
Localization via Graph Location Networks. In ACM
Multimedia, pages 3431–3440.
Dong, J. et al. (2019). ViNav: A Vision-Based Indoor Nav-
igation System for Smartphones. IEEE Trans Mob
Comput, 18(6):1461–1475.
Gao, R . et al. (2016). Sextant: Towards Ubiquitous Indoor
Localization Service by Photo-Taking of the Environ-
ment. IEEE Trans Mob Comput, 15(2):460–474.
He, K. et al. (2017). Mask R - CNN. In ICCV, pages 2961–
2969.
Li, S. and He, W. (2021). VideoLoc: Video-based Indoor
Localization with Text Information. In INFOCOM,
pages 1–10.
Li, X. et al. (2021). Accurate Indoor Localization Using
Multi-View Image Distance. IEVC.
Liu, C. et al. (2008). SIFT Flow: Dense Correspondence
Across Different Scenes. In ECCV, pages 28–42.
Springer.
Liu, Z. et al. (2017). Multiview and Multimodal Pervasive
Indoor Localization. In ACM Multimedia, pages 109–
117.
Liu, Z. et al. (2021). Swin Transformer: Hierarchical Vision
Transformer using Shifted Windows. arXiv preprint
arXiv:2103.14030.
MarketsandMarkets (2022). Indoor Location Market
by Component (Hardware, Solutions, and Services),
Technology (BLE, UWB, Wi-Fi, RFID), Application
(Emergency Response Management, Remote Monitor-
ing), Organization Size, Vertical and Region - Global
Forecast to 2027. MarketsandMarkets.
Noh, H. et al. (2017). Large-Scale Image Retrieval with
Attentive Deep Local Features. In ICCV, pages 3456–
3465.
Radenovi´c, F. et al . (2018). Fine-Tuning CNN I m-
age Retrieval with No Human Annotation. TPAMI,
41(7):1655–1668.
Sun, X. et al. (2017). A Dataset for Benchmarking Image-
Based Localization. In CVPR, pages 5641–5649.
Taira, H. et al. (2018). InLoc: Indoor Visual Localization
with Dense Matching and View Synthesis. In CVPR,
pages 7199–7209.
Torii , A. et al. (2015). 24/7 Place Recognition by View
Synthesis. In CVPR, pages 1808–1817.
Wang, S. et al. (2015). Lost Shopping! Monocular Local-
ization in Large Indoor Spaces. In ICCV, pages 2695–
2703.
Zhou, X. et al. (2017). EAST: an Efficient and Accurate
Scene Text Detector. In CVPR, pages 5551–5560.
Interactive Indoor Localization Based on Image Retrieval and Question Response
803
