
1D-SalsaSAN: Semantic Segmentation of LiDAR Point Cloud with
Self-Attention
Takahiro Suzuki, Tsubasa Hirakawa
a
, Takayoshi Yamashita
b
and Hironobu Fujiyoshi
c
Chubu University, Kasugai, Japan
Keywords:
Semantic Segmenatation, Point Cloud, Self-Attention, 1D-CNN.
Abstract:
Semantic segmentation on the three-dimensional (3D) point-cloud data acquired from omnidirectional light
detection and ranging (LiDAR) identifies static objects, such as roads, and dynamic objects such as vehicles
and pedestrians. This enables us to recognize the environment in all directions around a vehicle, which is
necessary for autonomous driving. Processing such data requires a huge amount of computation. Therefore,
methods have been proposed for converting 3D point-cloud data into pseudo-images and executing semantic
segmentation to increase the processing speed. With these methods, a large amount of point-cloud data are lost
when converting 3D point-cloud data to pseudo-images, which tends to decrease the identification accuracy
of small objects such as pedestrians and traffic signs with a small number of pixels. We propose a semantic
segmentation method that involves projection using Scan-Unfolding and a 1D self-attention block that is on
the basis of the self-attention block. As a result of an evaluation using SemanticKITTI, we confirmed that the
proposed method improves the accuracy of semantic segmentation, contributes to the improvement of small-
object identification accuracy, and is sufficient regarding processing speed. We also showed that the proposed
method is fast enough for real-time processing.
1 INTRODUCTION
With autonomous driving technology, it is essential
to understand the environment around the vehicle.
Therefore, research on autonomous driving such as
object detection and semantic segmentation has at-
tracted a great deal of attention. One such topic is
semantic segmentation, which enables a detailed un-
derstanding of the environment and is classified into
two methods: one using RGB (rgb, green, blue) im-
ages from in-vehicle camera images and the other us-
ing three-dimensional (3D) point-cloud data acquired
from light detection and ranging (LiDAR). LiDAR
can accurately acquire 3D information even at night
and in bad weather conditions, which is difficult to
segment using image-based methods using camera
images. Because of these advantages, deep-learning-
based research using omnidirectional LiDAR that ac-
quires information in all directions has been actively
conducted.
Methods using omnidirectional LiDAR can be
classified as those using the acquired 3D point-cloud
a
https://orcid.org/0000-0003-3851-5221
b
https://orcid.org/0000-0003-2631-9856
c
https://orcid.org/0000-0001-7391-4725
data without any conversion process (Ding and Feng,
2019; Liu et al., 2019; Rosu et al., 2019), converting
the point-cloud data into 2D pseudo-images (Alonso
et al., 2020; Simony et al., 2018; Meyer et al., 2019),
and converting the point-cloud data into a voxel (Mat-
urana and Scherer, 2015; Cheng et al., 2021; Shi
et al., 2020). Methods of converting point-cloud data
to pseudo-images reduces the computational cost and
processing time, which are the disadvantages of us-
ing 3D point clouds, because they can execute the
same processing as for images. A typical method
for converting point-cloud data to pseudo-images is
SalsaNext (Cortinhal et al., 2020) proposed by Tiago
et al. SalsaNext is on the basis of SalsaNet (Ak-
soy et al., 2020), and uses the context module for
global-information acquisition and a method called
pixel-shuffle layer (Shi et al., 2016) for lightweight
up-sampling to achieve high discrimination and real-
time performance. However, the identification accu-
racy for small objects, such as motorcycles and signs,
is low compared with that for cars and roads due to
loss of data when 3D point-cloud data are converted
to pseudo-images.
We propose a semantic-segmentation method
called 1D salsa self-attention network (1D-
SalsaSAN) by introducing a 1D self-attention
Suzuki, T., Hirakawa, T., Yamashita, T. and Fujiyoshi, H.
1D-SalsaSAN: Semantic Segmentation of LiDAR Point Cloud with Self-Attention.
DOI: 10.5220/0011624100003417
In Proceedings of the 18th International Joint Conference on Computer Vision, Imaging and Computer Graphics Theory and Applications (VISIGRAPP 2023) - Volume 5: VISAPP, pages
445-452
ISBN: 978-989-758-634-7; ISSN: 2184-4321
Copyright
c
2023 by SCITEPRESS – Science and Technology Publications, Lda. Under CC license (CC BY-NC-ND 4.0)
445

block (1D-SAB), which is a 1D version of the SAB
(Zhao et al., 2020) in SalsaNext. With 1D-SalsaSAN,
self-attention of the point-cloud data of each laser
ID acquired from LiDAR is calculated in order to
take into account the relationship between point
clouds. This enables the processing to be adapted to
the characteristics of the point-cloud data acquired
from LiDAR. By expressing the detailed relationship
between each point cloud as weights, we can improve
the identification accuracy for small objects such
as motorcycles and signs, which are not identified
accurately with conventional semantic-segmentation
methods. In addition, a projection method called
Scan-Unfolding (Triess et al., 2020) is also used
to obtain pseudo-images from 3D point-cloud data.
This suppresses the loss of 3D point cloud data
when converting them to pseudo-images and enables
feature extraction close to the original point-cloud
information. The results of evaluation experiments
using SemanticKITTI (Behley et al., 2019) indicates
that 1D-SalsaSAN improves the accuracy of semantic
segmentation by projection using Scan-Unfolding
and then processing with 1D-SAB. We confirmed that
it contributes to the improvement of the identification
accuracy of small objects. We also showed that its
processing speed is faster than that of SalsaNext.
2 RELATED WORK
Studies on omnidirectional LiDAR-based deep learn-
ing robust to nighttime and bad weather conditions,
under which objects are difficult to detect with image-
based methods, have been conducted, and many
methods have been proposed. As mentioned above,
methods using 3D point-cloud data can be categorized
as those for converting 3D point-cloud data into vox-
els, using 3D point-cloud data without any conversion
process, and converting 3D point-cloud data into 2D
pseudo-images. They differ in the way they represent
the point cloud. In this section, each type and the typ-
ical methods are described.
2.1 Voxel-Based Methods
Voxel-based methods first converts a 3D point-cloud
data as a voxels. The voxelized point-cloud data are
then input to a network consisting of 3D convolutions
to obtain results. VoxelNet (Zhou and Tuzel, 2018)
is a object detection method from the 3D point-cloud
data divided into voxels. VoxelNet contains a feature
learning network (FLN). In FLN, the 3D information
is divided into equally spaced voxels, and the shape
information in each voxel is obtained. The feature
values of each point in the voxel are also calculated
and combined with the feature values of each voxel.
The feature values of each point is then used for fea-
ture extraction and output object regions.
Voxel-based methods make it easy to retain the
original information of a 3D point-cloud data and
smooth feature extraction by 3D convolution is possi-
ble. They also improve on the sparseness of 3D point-
cloud data by grouping them by voxel, making them
easier to handle for each task. However, due to the
cubical representation of voxel data, this is computa-
tionally expensive and decreases the process speed.
2.2 Point-Wise Methods
With methods for using acquired 3D point-cloud-
based data without any conversion process, a point
cloud is directly input to a network for processing (Qi
et al., 2017a; Qi et al., 2017b). The (x, y, z) coordi-
nate information and the reflection intensity values of
point clouds are input to a network.
PointNet (Qi et al., 2017a) can be applied to sev-
eral tasks such as three-class classification and seg-
mentation. It is composed of a spatial transformer
network (STN), classification network, and segmen-
tation network. First, we reduce the noise for the in-
put point cloud in the STN. The next step is to ex-
tract the features of each point cloud from the con-
volution process by using the classification network.
Max pooling is then used to extract the overall fea-
tures and classify them. For segmentation, the overall
features extracted in the classification network and the
local features of each point cloud are combined and
input to the segmentation network. The convolution
process is executed several times again, and segmen-
tation is executed for each point cloud. PointNet may
lack detailed spatial information, thus may not be able
to capture the local structure. Threfore, PointNet++
(Qi et al., 2017b) have been proposed to solve this
problem, which applies the PointNet process hierar-
chically. It is also possible to extract pseudo-local fea-
tures by inputting neighboring points that have been
clustered. This solves the problems with PointNet and
improves the accuracy of class classification and seg-
mentation.
Thus, the original information of a 3D point-cloud
data is retained, and accurate feature extraction is pos-
sible. These methods also eliminates the computa-
tional cost of converting to voxels, etc. However,
processing 3D point-cloud data as they are requires
a huge amount of storage space. The associated com-
putational cost of processing point-cloud data is also
high, which may result in a reduction in processing
speed.
VISAPP 2023 - 18th International Conference on Computer Vision Theory and Applications
446

2.3 Pseudo-Image-Based Methods
With methods of converting a point-cloud data to
pseudo-images, the coordinates of the 3D point-
cloud data on a 2D pseudo-image are first calculated.
Pseudo-imaging is executed by plotting each point on
its coordinates. The converted pseudo-image is sub-
jected to a 2D convolutional process similar to that for
normal images and used for various tasks such as ob-
ject detection and semantic segmentation. A typical
method is SalsaNext (Cortinhal et al., 2020).
SalsaNext is a semantic-segmentation method that
converts 3D point-cloud data acquired from omnidi-
rectional LiDAR into pseudo-images. The problem
with other such methods is that the entire network is
missing context information. To solve this problem,
SalsaNext introduces a context module on the basis of
SalsaNet (Aksoy et al., 2020), which enables global
context information to be obtained at the early stage
of the network. In addition, residual expansion con-
volution with a residual block (He et al., 2016) is used
in the encoder and decoder to obtain detailed spa-
tial information. These interact to enable extraction
of local and global features. By using dilated con-
volution (Lin et al., 2018) to expand the kernel size,
the number of parameters for expanding the receptive
field is decreased. Furthermore, the lightweight up-
sampling method pixel-shuffle layer (Shi et al., 2016)
is used in the decoder. Pixel-shuffle layer executes up-
sampling by sorting the output feature map, so it has
no weights, which decreases the computational cost.
As described above, SalsaNext achieves high iden-
tification and real-time performance by introducing
modules to increase processing speed and improve
segmentation accuracy.
The advantage of this method is that the 3D point-
cloud data can be used as a 2D image, which de-
creases computational cost and increases processing
speed. The disadvantage is that the representational
power of the 3D point cloud may be lost, for exam-
ple, a pixel and its neighboring pixels in the converted
pseudo-image are not neighboring points in the origi-
nal point cloud.
2.4 Problems with Conventional
Methods
The methods of converting 3D point-cloud data into
voxels and using such data without any conversion
process require huge computational cost in process-
ing the acquired 3D point-cloud data, which may de-
crease the processing speed. Conventional methods
in the 2D Images approach convert 3D point-cloud
data to pseudo-images to decrease computational cost
and increase the processing speed, which are the prob-
lems of two above methods. Therefore, many conven-
tional methods using pseudo-images have real-time
capability to match the driving speed of a car, which
is essential for autonomous driving. However, since
a large amount of data is lost when converting 3D
point-cloud data to pseudo-images, it is not possible
to obtain the features of small objects, e.g., motorcy-
cles and signs with relatively small point clouds, and
the identification accuracy for such objects tends to be
low.
3 PROPOSED METHOD
The 3D point-cloud data acquired from omnidirec-
tional LiDAR are dense in the horizontal direction.
Due to this characteristic, the resulting pseudo-image
also has more pixels in the horizontal direction and
less point-cloud data is lost. Our 1D-SalsaSAN uses
a 1D-SAB that focuses only on the horizontal direc-
tion to improve the identification accuracy for small
objects. In this section, we describe the processing
flow of 1D-SalsaSAN.
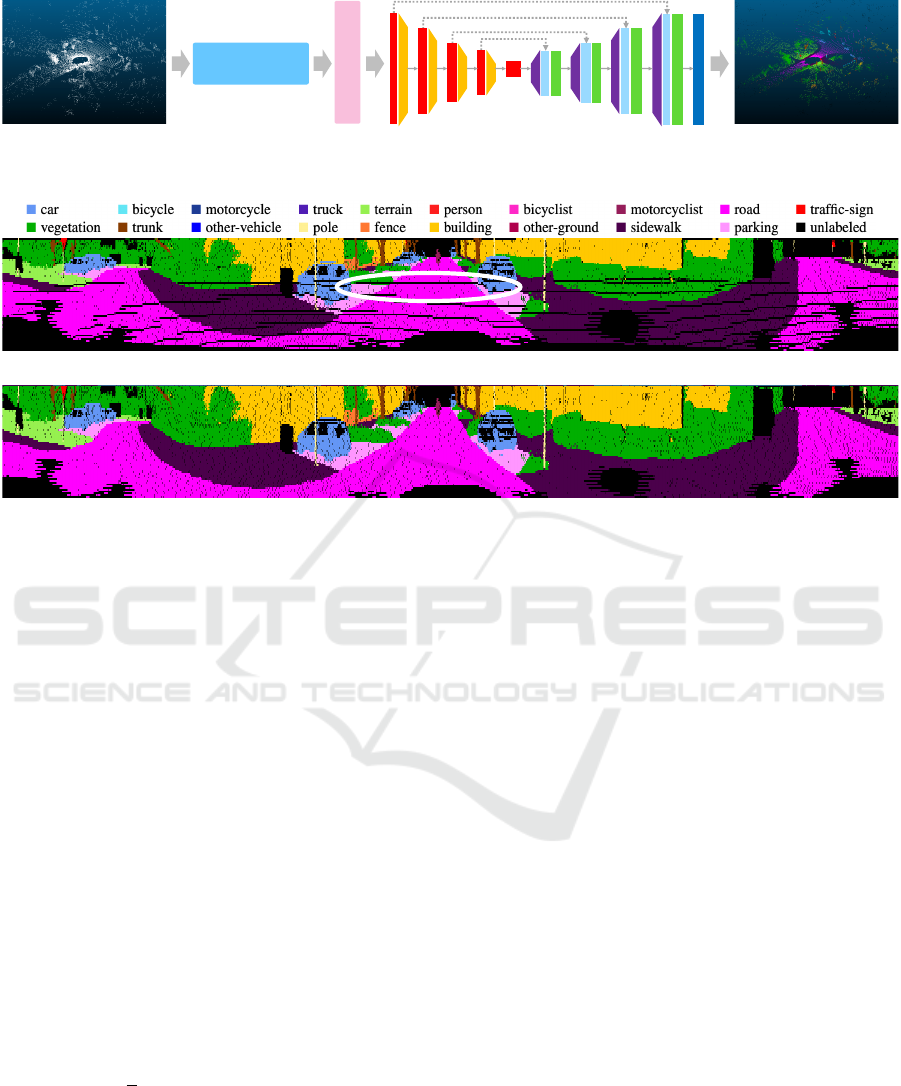
3.1 Processing Flow
Figure 1 shows the flow of 1D-SalsaSAN. It first con-
verts the 3D point-cloud data into a pseudo-image.
The vertical size of the pseudo-image is 64, which
matches the LiDAR used in this study, and the hori-
zontal size is 2048 because the horizontal irradiation
interval of LiDAR is 0.175 degrees. The number of
channels is 5: x, y, z, intensity, and depth. Next, the
vertical coordinate of the pseudo-image is input to
the 1D-SAB as the 1D-waveform data of each laser
ID in LiDAR. In the 1D-SAB, relationships between
point clouds are taken into account in the processing.
The feature map output from 1D-SAB is then input
to SalsaNext (without the context module) for convo-
lutional processing. If the 1D-SAB is simply added
as a module, the processing speed will decrease. For
autonomous driving, the processing speed is as im-
portant as the identification accuracy, so the context
module is removed from SalsaNext. The class proba-
bility for each pixel of the pseudo-image is then cal-
culated using the softmax function, and each point
of the original 3D point-cloud data is segmented by
post-processing on the basis of the k-nearest neighbor
(kNN) method.
1D-SalsaSAN: Semantic Segmentation of LiDAR Point Cloud with Self-Attention
447
input output
Projection
(Scan-Unfo lding)
1D-SAB
64×4×256
128 ×8×256
256×16×128
512×32×64
64×4×256
128 ×8×256
256×16×128
512×32×64
2048 ×64×32
SalsaNext (w/o Context module)
Figure 1: Overview of proposed method.
(a) Ego-motion
(b) Scan-Unforlding
Figure 2: Example of conversion of 3D point cloud data to pseudo-image.
3.2 LiDAR Point Cloud Representation
Conventional methods such as SalsaNext use Ego-
motion Corrected (Milioto et al., 2019) proposed
by Milioto et al. as the projection method. In
contrast, 1D-SalsaSAN uses Scan-Unfolding (Triess
et al., 2020) for 3D point-cloud data. Figure 2
shows an example of pseudo-images generated using
Ego-motion Corrected and Scan-Unfolding. In Ego-
motion Corrected (Figure 2(a)), some data are lost
when 3D point-cloud data are converted to a pseudo-
image (black pixels as shown in the white frame).
This is due to the fact that when calculating the co-
ordinates (u,v) on the pseudo-image for the projec-
tion of each point in 3D, different points will be on
the same pseudo-image coordinates, resulting in an
occlusion of the points. Scan-Unfolding executes pro-
jection in accordance with the order of the point-cloud
data acquired by LiDAR. First, only the horizontal co-
ordinate u of each point on the pseudo-image is cal-
culated using Equation 1.
u =
1
2
[1 − arctan(y,x)π
−1
] (1)
Next, the width between each neighboring point of the
u coordinate is calculated, and if it is more than the
threshold, the laser ID is considered to have changed
and the vertical coordinate v is shifted to the bottom.
Projection in this manner reduces the occlusion of
points with v coordinates on the pseudo-image and
suppresses the loss of point-cloud data, as shown in
Figure 2(b).
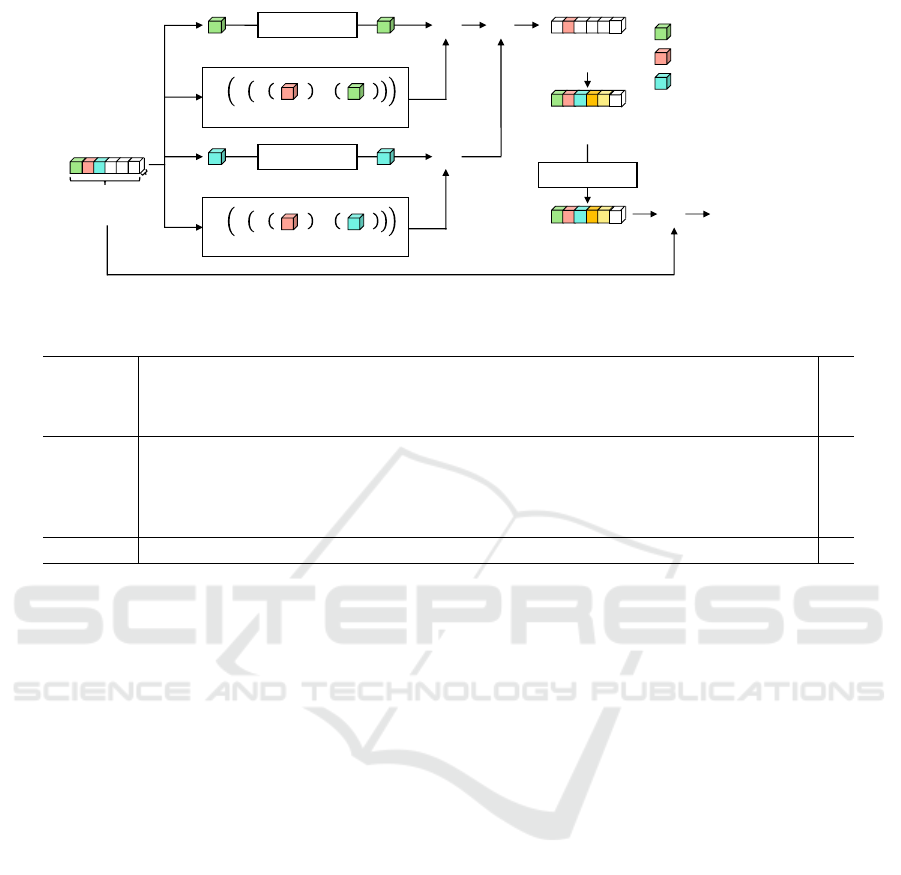
3.3 1- Dimensional Self-Attention Block
(1D-SAB)
We now explain the 1D-SAB. Figure 3 shows the de-
tailed structure of 1D-SAB. The pseudo-image is con-
sidered as 1D-wave data for each laser ID and input
to the 1D-SAB. Here, we denote input feature for the
1D-SAN as h, where the input size is [1 × w (width of
the pseudo-image) ×c (channels)]. The input data are
processed one point at a time, and the self-attention
of the corresponding point is calculated. When the
red value in Fig. 3 is the point of interest for the pro-
cess h
t
, the green h
t−1
is neighborhood 1, and the blue
h
t+1
is neighborhood 2. For each neighboring point,
we apply point-wise convolution.
We input the points of interest and neighboring
points into the learnable functions ϕ(·) and ψ(·).
Then, the outputs of ϕ(·) and ψ(·) are used for the
relational function δ, which is defined as
δ(ϕ(h
t
),ψ(h
t−1
)) = ϕ(h
t
) − ψ(h
t−1
),
δ(ϕ(h
t
),ψ(h
t+1
)) = ϕ(h
t
) − ψ(h
t+1
).
(2)
The mapping function γ(·) then aligns the number
of channels with the output of the first process. We
then we calculate the element-wise product with the
above-mentioned features by point-wise convolution.
VISAPP 2023 - 18th International Conference on Computer Vision Theory and Applications
448

The self-attention map (SAM) is generated by ex-
ecuting this process for neighboring points and sum-
ming them up. The generated SAMs are made to
have the same number of channels as the input chan-
nels by point-wise convolution. The input data are
added to this outputs as a skip mechanism to form
the final output. By using the 1D-SAB, we can give
a large weight to the important positions among the
point clouds and represent the relationship between
point clouds. Therefore, it is possible to obtain de-
tailed features of a point cloud.
3.4 Loss Function
For the loss function, we use a linear combination of
weighted cross-entropy loss and Lov ´asz-So f tmax loss
(Berman et al., 2018) on the basis of the SalsaNext.
The weighted cross-entropy loss is defined by
L
wce
(y, ˆy) = −
∑
i
α
i
p(y
i
)log(p(ˆy
i
)),
α
i
= 1/
p
f
i
,
(3)
where y
i
is the correct label, ˆy
i
is the predicted la-
bel, and f
i
is the frequency (number of points) of
the i
th
class. Weighted cross-entropy is used to cor-
rect for class-specific imbalances in the dataset. Also,
Lov ´asz-So f tmax loss is defined by
L
ls
=
1
|C|
∑
c∈C
∆J
c
(m(c)),
m
i
(c) =
1 − x
i
(c) if c = y
i
(c)
x
i
(c) otherwise
,
(4)
where |C| denotes the class number, ∆J
c
defines
the Lov
´
asz extension, and x
i
(x) ∈ [0,1] and y
i
(c) ∈
{−1,1} hold the predicted probability and ground-
truth label of pixel i for class c, respectively. Finally,
the total loss function can be expressed as follows:
L = L
wce
+ L
ls
.
3.5 Post-Processing
Pseudo-image-based methods may not be able to cor-
rectly provide prediction results to 3D point clouds
after inferring the class probabilities. Therefore, we
used, post-processing on the basis of the kNN method
(Milioto et al., 2019) to provide more accurate pre-
diction results to the 3D point cloud. With this post-
processing method, prediction labels are determined
for each pixel of the pseudo-image on the basis of the
kNN method. Next, which of the original 3D point-
cloud data each pixel falls into is determined in ac-
cordance with the calculated (u,v) coordinates. The
final prediction result for each pixel is then provided
to the corresponding 3D point cloud. For more de-
tails, we refer the readers to a previous study (Milioto
et al., 2019). Note that this post-processing is applied
to the network output during inference only and has
no effect on learning.
4 EXPERIMENTS
In this section, we discuss the evaluation of 1D-
SalsaSAN.
4.1 Experimental Settings
We evaluated the effectiveness of 1D-SalsaSAN by
comparing its accuracy and processing speed with
those of conventional methods that also use pseudo-
images. The conventional methods were SqueezeSeg
(Wu et al., 2018), SqueezeSegV2 (Wu et al., 2019),
RangeNet++ (Milioto et al., 2019), and SalsaNext
(Cortinhal et al., 2020). To evaluate the effectiveness
of the 1D-SAB, we assumed that Scan-Unfolding is
used as the projection method for SalsaNext. For the
training settings, we set the number of training epochs
to 300 and batch size to 24. The optimizer was Mo-
mentumSGD, and the initial learning rate was 0.01
(decayed by 0.01 per epoch during training). We used
intersection over union (IoU) between the segmenta-
tion result and the correct answer label for each point
cloud as the evaluation metrics.
The overall evaluation metric is Mean-IoU
(mIoU), which is the average of the IoU of each class.
4.2 Dataset
We used SemanticKITTI (Behley et al., 2019) for our
evaluation. SemanticKITTI is a real-world dataset
that is annotated for all point-cloud data in the KITTI
dataset (Geiger et al., 2012). The dataset consists of
22 scenes and 43,000 frames. Of these, 23,201 frames
from scenes 00 to scene 10 were used for training,
and 20,351 frames from scenes 11 to scene 21 were
used for evaluation. Among the training scenes, 4,071
frames of scene 08 were used as the validation data for
training. The identification target was 19 classes.
4.3 Quantitative Results
Table 1 lists the accuracies of the conventional meth-
ods and the 1D-SalsaSAN.
Evaluating the Effectiveness of 1D-SAB. From
Table 1, 1D-SalsaSAN improved in terms of mIoU
by 1.1 ppt compared with SalsaNext. When compar-
ing the accuracy of each class, the IoU of 7 among
1D-SalsaSAN: Semantic Segmentation of LiDAR Point Cloud with Self-Attention
449
1×𝑤×𝑐
𝑤
𝑐
input
1×1×𝑐
Pointwise Conv
1×1×𝑐′
𝛾 𝛿 𝜑 $$$$$$$$ , 𝜓 $$$$$$$$
1×1×𝑐 1×1×𝑐
1×1×𝑐
Pointwise Conv
1×1×𝑐′
𝛾 𝛿 𝜑 $$$$$$$$ , 𝜓 $$$$$$$$
1×1×𝑐 1×1×𝑐
Bn/ReLU
Self Attention Map
1×1×𝑐′
Generated SAM
1×𝑤×𝑐′
Pointwise Conv
SAM
1×𝑤×𝑐
Bn/ReLU
Output feature map
Skip Connection
:Attention Point (t)
:Neighborhood Point (t!−1)
:Neighborhood Point (t +1)
:Mapping function
:𝜑(%)!−!𝜓(%)
𝜑, 𝜓
𝛿(%)
𝛾
:Learnable function
⨀
⨀
⨁
⨁
Figure 3: Detailed structure of 1D-SAB.
Table 1: Quantitative comparison on SemanticKITTI test set (sequences 11 to 21). IoU scores are given in percentage [%].
Method
car
bicycle
motorcycle
truck
othe-vehicle
person
bicyclist
motorcyclist
road
parking
sidewalk
other-ground
building
fence
vegetation
trunk
terrain
pole
traffic sign
mean-IoU
SqueezeSeg 68.3 18.1 5.1 4.1 4.8 16.5 17.3 1.2 84.9 28.4 54.7 4.6 61.5 29.2 59.6 25.5 54.7 11.2 36.3 30.8
SqueezeSegV2 82.7 21.0 22.6 14.5 15.9 20.2 24.3 2.9 88.5 42.4 65.5 18.7 73.8 41.0 68.5 36.9 58.9 12.9 41.0 39.6
RangeNet++ 91.4 25.7 34.4 25.7 23.0 38.3 38.8 4.8 91.8 65.0 75.2 27.8 87.4 58.6 80.5 55.1 64.6 47.9 55.9 52.5
SalsaNext 93.2 51.9 39.3 31.7 29.3 60.3 57.8 8.9 91.7 61.3 75.7 29.0 89.1 61.8 83.2 64.1 67.6 53.8 61.4 58.5
1D-SalsaSAN 93.2 52.2 39.8 41.4 28.8 62.1 63.6 23.3 91.2 60.0 75.1 28.5 88.1 60.0 80.8 63.6 64.6 52.9 63.1 59.6
the 19 classes improved. The IoU of small objects,
such as bicycle, motorcycle, person, bicyclist, motor-
cyclist, and traffic-sign, improved. The IoU of motor-
cyclist showed the greatest improvement in accuracy
with 14.4 pt. This indicates that the 1D-SAB is able to
obtain detailed features from the relationships among
point clouds and weight objects with a small number
of point clouds. Therefore, we can confirm that 1D-
SalsaSAN contributes to improving the identification
accuracy of small objects. The mIoU is considered
to have improved because there are many classes for
which 1D-SalsaSAN is highly effective.
textbfComparison of accuracy with conventional
methods. From Table 1, 1D-SalsaSAN had the
highest mIoU. When the accuracy of each class was
compared, the IoU of 8 among the 19 classes was the
highest. In particular, the IoU of small objects, the
identification accuracy of which was expected to im-
prove, greatly improved. We can also confirm that the
accuracy of the remaining classes was almost equal to
that of the conventional method with the highest IoU.
Therefore, we can say that 1D-SalsaSAN is effective
for semantic segmentation.
4.4 Qualitative Results
Figure 4 shows an example of segmentation re-
sults using SalsaNext and 1D-SalsaSAN. Our 1D-
SalsaSAN was able to identify the correct answer
more accurately than SalsaNext. The white boxes in
the figure show examples of correct answer and iden-
tification results for the traffic-sign class. SalsaNext
misidentified part of a traffic-sign as a fence. How-
ever, 1D-SalsaSAN was able to correctly identify traf-
fic signs. This qualitatively indicates the effectiveness
of 1D-SalsaSAN.
4.5 Comparison of Processing Speed
Figure 5 shows a graph of the relationship between
accuracy and processing speed for each method. All
processing-speed measurements were conducted us-
ing an NVIDIA Quadro RTX A6000. The process-
ing speed of 1D-SalsaSAN was 77.6 Hz, which is
18.0 Hz faster than SalsaNext. We speculate that
this is because the computational process of the 1D-
SAB is less than that of the context module removed
from SalsaNext. The real-time performance of 1D-
SalsaSAN is sufficient because omnidirectional Li-
DAR usually acquires data while rotating at 5 Hz to
20 Hz. SqueezeSeg, which had the fastest process-
ing speed, had the lowest mIoU, as shown in Table 1.
SqueezeSegV2 was also faster than 1D-SalsaSAN,
but its mIoU was 20.0 ppt lower than 1D-SalsaSAN.
For autonomous driving tasks, both accuracy and
speed are important metrics, so 1D-SalsaSAN is the
most effective for semantic segmentation in terms of
both.
VISAPP 2023 - 18th International Conference on Computer Vision Theory and Applications
450
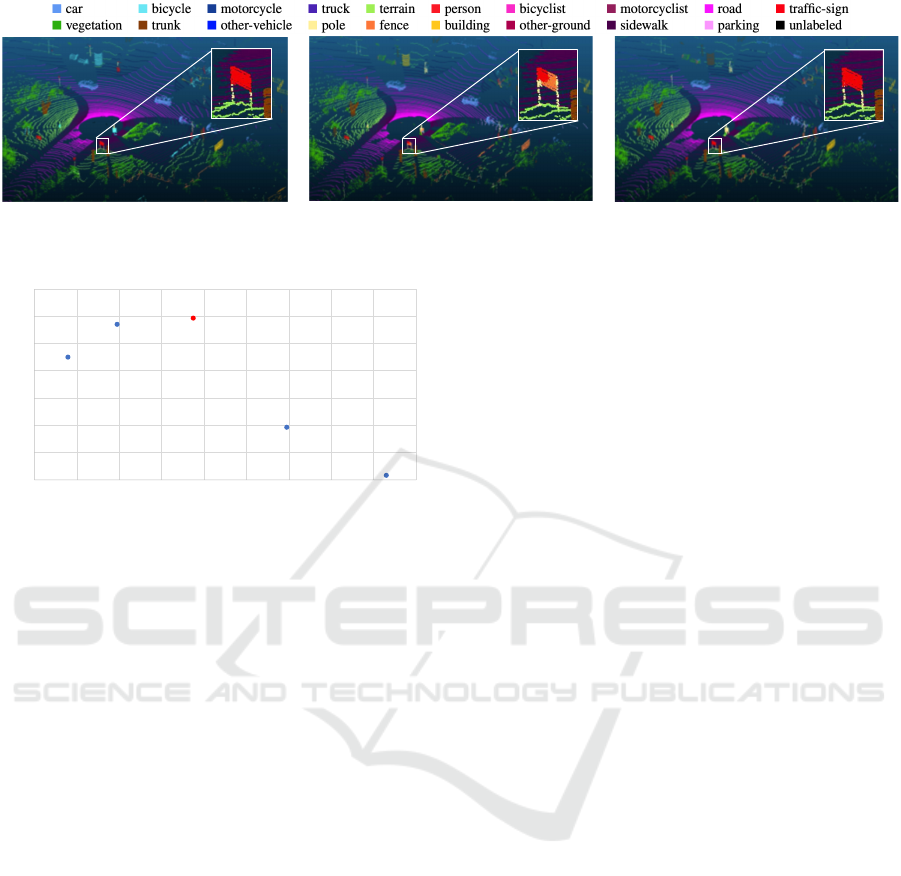
(a) Ground truth (b) SalsaNext (c) 1D-SalsaSAN
Figure 4: Examples of segmentation results.
Sque ezeSeg
Sque ezeSegV2
RangeNet++
SalsaNext
1D-SalsaSAN
30
35
40
45
50
55
60
65
40 50 60 70 80 90 100 110 120 130
mIoU [%]
processing speed [Hz ]
Figure 5: Relationship between accuracy and processing
speed for each method.
5 CONCLUSIONS
We proposed 1D-SalsaSAN, which uses a 1D-SAB
to improve the identification accuracy for small ob-
jects. From the evaluation experiments, we confirmed
that the 1D-SAB improves the overall segmentation
accuracy, especially for small objects. The process-
ing speed also improved compared which that of Sal-
saNext, indicating that the real-time performance re-
quired for autonomous driving was sufficiently main-
tained. Our future work includes further improvement
in identification accuracy through data augmentation,
confirmation of the generalizability of 1D-SalsaSAN
through evaluation experiments using other data sets,
and investigation of the network structure.
REFERENCES
Aksoy, E. E., Baci, S., and Cavdar, S. (2020). Salsanet: Fast
road and vehicle segmentation in lidar point clouds for
autonomous driving. In 2020 IEEE Intelligent Vehi-
cles Symposium (IV), pages 926–932.
Alonso, I., Riazuelo, L., Montesano, L., and Murillo, A. C.
(2020). 3d-mininet: Learning a 2d representation
from point clouds for fast and efficient 3d lidar se-
mantic segmentation. IEEE Robotics and Automation
Letters, 5(4):5432–5439.
Behley, J., Garbade, M., Milioto, A., Quenzel, J., Behnke,
S., Stachniss, C., and Gall, J. (2019). SemanticKITTI:
A Dataset for Semantic Scene Understanding of Li-
DAR Sequences. In Proc. of the IEEE/CVF Interna-
tional Conf. on Computer Vision (ICCV).
Berman, M., Rannen Triki, A., and Blaschko, M. B. (2018).
The lov
´
asz-softmax loss: A tractable surrogate for the
optimization of the intersection-over-union measure
in neural networks. In Proceedings of the IEEE Con-
ference on Computer Vision and Pattern Recognition,
pages 4413–4421.
Cheng, R., Razani, R., Taghavi, E., Li, E., and Liu, B.
(2021). (af)2-s3net: Attentive feature fusion with
adaptive feature selection for sparse semantic segmen-
tation network. In Proceedings of the IEEE/CVF Con-
ference on Computer Vision and Pattern Recognition
(CVPR), pages 12547–12556.
Cortinhal, T., Tzelepis, G., and Aksoy, E. E. (2020). Sal-
sanext: Fast, uncertainty-aware semantic segmenta-
tion of lidar point clouds for autonomous driving.
Ding, L. and Feng, C. (2019). Deepmapping: Unsupervised
map estimation from multiple point clouds. In Pro-
ceedings of the IEEE/CVF Conference on Computer
Vision and Pattern Recognition (CVPR).
Geiger, A., Lenz, P., and Urtasun, R. (2012). Are we ready
for Autonomous Driving? The KITTI Vision Bench-
mark Suite. In Proc. of the IEEE Conf. on Computer
Vision and Pattern Recognition (CVPR), pages 3354–
3361.
He, K., Zhang, X., Ren, S., and Sun, J. (2016). Deep resid-
ual learning for image recognition. In Proceedings of
the IEEE Conference on Computer Vision and Pattern
Recognition (CVPR).
Lin, D., Ji, Y., Lischinski, D., Cohen-Or, D., and Huang, H.
(2018). Multi-scale context intertwining for semantic
segmentation. In Proceedings of the European Con-
ference on Computer Vision (ECCV).
Liu, X., Qi, C. R., and Guibas, L. J. (2019). Flownet3d:
Learning scene flow in 3d point clouds. In Proceed-
ings of the IEEE/CVF Conference on Computer Vision
and Pattern Recognition (CVPR).
Maturana, D. and Scherer, S. (2015). Voxnet: A 3d convolu-
tional neural network for real-time object recognition.
In 2015 IEEE/RSJ International Conference on Intel-
ligent Robots and Systems (IROS), pages 922–928.
Meyer, G. P., Laddha, A., Kee, E., Vallespi-Gonzalez, C.,
and Wellington, C. K. (2019). Lasernet: An efficient
1D-SalsaSAN: Semantic Segmentation of LiDAR Point Cloud with Self-Attention
451

probabilistic 3d object detector for autonomous driv-
ing. In Proceedings of the IEEE/CVF Conference on
Computer Vision and Pattern Recognition (CVPR).
Milioto, A., Vizzo, I., Behley, J., and Stachniss, C. (2019).
Rangenet ++: Fast and accurate lidar semantic seg-
mentation. In 2019 IEEE/RSJ International Confer-
ence on Intelligent Robots and Systems (IROS), pages
4213–4220.
Qi, C. R., Su, H., Kaichun, M., and Guibas, L. J. (2017a).
Pointnet: Deep learning on point sets for 3d classifica-
tion and segmentation. In IEEE Conference on Com-
puter Vision and Pattern Recognition, pages 77–85.
Qi, C. R., Yi, L., Su, H., and Guibas, L. J. (2017b). Point-
net++: Deep hierarchical feature learning on point sets
in a metric space. arXiv preprint arXiv:1706.02413.
Rosu, R. A., Sch
¨
utt, P., Quenzel, J., and Behnke, S. (2019).
Latticenet: Fast point cloud segmentation using per-
mutohedral lattices. CoRR, abs/1912.05905.
Shi, S., Guo, C., Jiang, L., Wang, Z., Shi, J., Wang, X.,
and Li, H. (2020). Pv-rcnn: Point-voxel feature set
abstraction for 3d object detection. In Proceedings
of the IEEE/CVF Conference on Computer Vision and
Pattern Recognition (CVPR).
Shi, W., Caballero, J., Huszar, F., Totz, J., Aitken, A. P.,
Bishop, R., Rueckert, D., and Wang, Z. (2016). Real-
time single image and video super-resolution using an
efficient sub-pixel convolutional neural network. In
Proceedings of the IEEE Conference on Computer Vi-
sion and Pattern Recognition (CVPR).
Simony, M., Milzy, S., Amendey, K., and Gross, H.-M.
(2018). Complex-yolo: An euler-region-proposal for
real-time 3d object detection on point clouds. In Pro-
ceedings of the European Conference on Computer Vi-
sion (ECCV) Workshops.
Triess, L. T., Peter, D., Rist, C. B., and Zollner, J. M.
(2020). Scan-based semantic segmentation of lidar
point clouds: An experimental study. In 2020 IEEE
Intelligent Vehicles Symposium (IV), pages 1116–
1121.
Wu, B., Wan, A., Yue, X., and Keutzer, K. (2018). Squeeze-
seg: Convolutional neural nets with recurrent crf for
real-time road-object segmentation from 3d lidar point
cloud. ICRA.
Wu, B., Zhou, X., Zhao, S., Yue, X., and Keutzer, K. (2019).
Squeezesegv2: Improved model structure and unsu-
pervised domain adaptation for road-object segmenta-
tion from a lidar point cloud. In ICRA.
Zhao, H., Jia, J., and Koltun, V. (2020). Exploring self-
attention for image recognition. In CVPR.
Zhou, Y. and Tuzel, O. (2018). Voxelnet: End-to-end learn-
ing for point cloud based 3d object detection. In IEEE
Conference on Computer Vision and Pattern Recogni-
tion, pages 4490–4499.
VISAPP 2023 - 18th International Conference on Computer Vision Theory and Applications
452
