
SalienceNet: An Unsupervised Image-to-Image Translation Method for
Nuclei Saliency Enhancement in Microscopy Images
Emmanuel Bouilhol
1,2
, Edgar Lefevre
2
, Thierno Barry
3
, Florian Levet
3,4
, Anne Beghin
5,8,9
,
Virgile Viasnoff
5,6,7
, Xareni Galindo
3
, R
´
emi Galland
3
, Jean-Baptiste Sibarita
3
and Macha Nikolski
1,2
1
Universit
´
e de Bordeaux, CNRS, IBGC, UMR 5095, 33000, Bordeaux, France
2
Universit
´
e de Bordeaux, Bordeaux Bioinformatics Center, 33000, Bordeaux, France
3
University of Bordeaux, CNRS, IINS, UMR 5297, Bordeaux, France
4
University Bordeaux, CNRS, INSERM, Bordeaux Imaging Center, BIC, UAR 3420, US 4, Bordeaux, France
5
Mechanobiology Institute, National University of Singapore, Singapore, Singapore
6
IRL 3639 CNRS, Singapore, Singapore
7
Department of Biological Sciences, National University of Singapore, Singapore, Singapore
8
Immunology Translational Research Programme, Yong Loo Lin School of Medicine, National University of Singapore,
Singapore, Singapore
9
Department of Microbiology and Immunology, National University of Singapore, Singapore, Singapore
Keywords:
Bioimaging, Deep Learning, Microscopy, Image Processing, Nuclei Segmentation.
Abstract:
Automatic segmentation of nuclei in low-light microscopy images remains a difficult task, especially for high-
throughput experiments where the need for automation is strong. Low saliency of nuclei with respect to the
background, variability of their intensity together with low signal-to-noise ratio in these images constitute a
major challenge for mainstream algorithms of nuclei segmentation. In this work we introduce SalienceNet,
an unsupervised deep learning-based method that uses the style transfer properties of cycleGAN to transform
low saliency images into high saliency images, thus enabling accurate segmentation by downstream analysis
methods, and that without need for any parameter tuning. We have acquired a novel dataset of organoid images
with soSPIM, a microscopy technique that enables the acquisition of images in low-light conditions. Our
experiments show that SalienceNet increased the saliency of these images up to the desired level. Moreover,
we evaluated the impact of SalienceNet on segmentation for both Otsu thresholding and StarDist and have
shown that enhancing nuclei with SalienceNet improved segmentation results using Otsu thresholding by
30% and using StarDist by 26% in terms of IOU when compared to segmentation of non-enhanced images.
Together these results show that SalienceNet can be used as a common preprocessing step to automate nuclei
segmentation pipelines for low-light microscopy images.
1 INTRODUCTION
Segmentation of cell nuclei is of particular interest
for a number of applications such as cell detection,
counting or tracking, morphology analysis and quan-
tification of molecular expression. Being able to au-
tomatically segment cell nuclei with high precision is
particularly important in the case of high-throughput
microscopy imaging, where it is often the first step
for downstream quantitative data analysis workflows.
Indeed, the quality of downstream quantitative analy-
ses is heavily dependent on the accuracy of segmenta-
tion, making precise nuclei segmentation essential for
drawing meaningful biological conclusions.
Many solutions have been developed, as exempli-
fied by computational competitions such as reported
in (Caicedo et al., 2019). Among popular classical
image analysis methods used for nuclei segmentation
are thresholding and watershed algorithm (Malpica
et al., 1997) as well as active contour (Li et al., 2007).
Challenges for automatizing this process are due
to a number of image characteristics that can strongly
vary between biological and image acquisition con-
ditions. Among them, we can cite such aspects as
morphological differences between nuclei from dif-
ferent tissues, heterogeneity of intensity and texture,
Bouilhol, E., Lefevre, E., Barry, T., Levet, F., Beghin, A., Viasnoff, V., Galindo, X., Galland, R., Sibarita, J. and Nikolski, M.
SalienceNet: An Unsupervised Image-to-Image Translation Method for Nuclei Saliency Enhancement in Microscopy Images.
DOI: 10.5220/0011623500003414
In Proceedings of the 16th International Joint Conference on Biomedical Engineering Systems and Technologies (BIOSTEC 2023) - Volume 2: BIOIMAGING, pages 41-51
ISBN: 978-989-758-631-6; ISSN: 2184-4305
Copyright
c
2023 by SCITEPRESS – Science and Technology Publications, Lda. Under CC license (CC BY-NC-ND 4.0)
41

variation in spatial organization such as the presence
of both sparse or dense images with touching nuclei,
as well as imaging artifacts (e.g., low signal-to-noise
ratio or out-of-focus signal) (Zhou et al., 2019). This
results in the necessity to fine-tune numerous parame-
ters between different image acquisitions, or even be-
tween individual images.
Recent deep-learning based tools such as Cellpose
(Stringer et al., 2021) and StardDist (Schmidt et al.,
2018) have greatly reduced the necessity to choose
specific parameters. However, despite these impor-
tant methodological advances, no single combination
of methods and parameters can be adopted to auto-
matically perform nuclei segmentation in all images,
due to the aforementioned heterogeneity of biological
samples and technical artifacts (Hollandi et al., 2022).
In particular, live-cell imaging represents a stumbling
block for these techniques, since these images are of-
ten acquired with low light levels and thus have very
low SNR and artifacts. Moreover, current supervised
Deep Learning models for nuclei segmentation fol-
low the supervised paradigm and thus require well
annotated datasets, which (i) engenders bias due to
inaccuracy and incompleteness of available segmen-
tation, where nuclei are improperly annotated and un-
evenly distributed across images (He et al., 2020) and
(ii) limits application to datasets with different image
characteristics.
In this paper, instead of focusing on the segmen-
tation itself, we propose to tackle this problem by en-
hancing the nuclei prior to segmentation step, making
the task easy for classical nuclei segmentation tools.
Specifically, we take advantage of recent advances in
the field of unsupervised generative adversarial net-
works, aiming to translate images from the source
domain to the target domain and alleviating the im-
age annotation requirement. For nuclei enhancement
task, the target domain corresponds to images with
highly salient nuclei, where strong signal difference
between the nuclei and background make segmenta-
tion straightforward.
In this work, we introduce SalienceNet, a novel
unsupervised Deep Learning-based approach for nu-
clei saliency enhancement in microscopy images that
does not require image annotation when there is need
to train the network on new data with different char-
acteristics. We showcase how this can be achieved
for translating organoid images acquired with low
light into contrasted output images, by training the
SalienceNet without providing the network with prior
annotation of newly acquired low contrast images.
SalienceNet gives a new twist to automatic nuclei
segmentation by adapting the domain style transfer
framework to this specific task, and thus does not
require extensive annotation. We trained a ResNet-
based CycleGAN with a custom loss function dedi-
cated to the task of nuclei enhancement, where the in-
tensity of the nuclei and in particular their borders, are
made more salient regardless of the contrast, intensity,
textures, or shapes of the nuclei in the input data. Fur-
thermore, we evaluated the impact of the obtained nu-
clei enhancement on the downstream nuclei segmen-
tation by performing segmentation using conventional
methods on the enhanced images and have shown that
such a pipeline achieves better performance than seg-
menting the nuclei directly on the original images.
We demonstrate here that incorporating SalienceNet
in a standard segmentation pipeline, makes it possible
to avoid the manual parameter fine-tuning steps.
2 RELATED WORK
2.1 Nuclei Segmentation
Nucleus segmentation methods can be partitioned in
two major groups: those that rely on classical image
processing approaches and those that propose Deep
Learning models. For a thorough review, we refer the
reader to (Hollandi et al., 2022).
Image processing pipelines usually contain a num-
ber of filtering and thresholding steps combined, if
needed, with basic morphological operators to differ-
entiate nuclei (Malpica et al., 1997; Li et al., 2007).
A number of such methods are available as plug-
ins of the main biological analyses open-source soft-
ware tools such as Fiji (Schindelin et al., 2012), ICY
(De Chaumont et al., 2012), QuPath (Bankhead et al.,
2017) or CellProfiler (McQuin et al., 2018). The de-
velopment of classical image processing methods for
nuclei segmentation is still an active field. For exam-
ple, in a recently published image processing library,
CLIJ2 (Haase et al., 2020), the authors proposed a nu-
clei segmentation pipeline ”Voronoi Otsu Labeling”
in which they first denoise the images with Gaussian
blur, second to separate regions using Vorono
¨
ı tessel-
lation, and to finally obtain a binary mask by apply-
ing an Otsu thresholding to obtain the segmentation.
However, time-consuming parameter fine-tuning is
required from the user at different steps of such clas-
sical image processing pipelines, making process-
ing large amount of data impractical (Hollandi et al.,
2022).
The need for an automatized solution capable to
segment the nuclei in images with different charac-
teristics, pushed for the adoption of methods based
on Deep Learning. The U-Net architecture (Ron-
neberger et al., 2015) is used as part of recent Deep
BIOIMAGING 2023 - 10th International Conference on Bioimaging
42

Learning nucleus/cell segmentation methods, such as
Cellpose (Stringer et al., 2021) and StarDist (Schmidt
et al., 2018). Another successful architecture is Mask
R-CNN, that has been recently adapted for nuclei
segmentation by the authors of nucleAIzer (Hollandi
et al., 2020). ImageJ has recently proposed Deep
Learning-based segmentation plugins, and pre-trained
models are available through DeepImageJ (G
´
omez-de
Mariscal et al., 2021).
The success of the aforementioned Deep Learn-
ing methods for nuclei segmentation is in particular,
due to the use of large and relatively varied train-
ing datasets, with images acquired using different
microscopy modalities. Nevertheless, establishing a
general solution is still an unmet need, especially for
images acquired with novel microscopy techniques,
such as for example the live-cell imaging (Ettinger
and Wittmann, 2014) that reduces the intensity of the
light sources of the microscope to a minimum in or-
der to limit the photo-damage to the cells thus be able
to observe them over long periods of time. Result-
ing images have a reduced signal intensity and low
SNR. Importantly, having both (i) not been part of the
training and evaluation datasets of the aforementioned
methods and (ii) having different characteristics, such
images represent a yet unsolved challenge for nuclei
segmentation.
Moreover, the performance of the existing super-
vised deep-learning methods depends on the amount
of high-quality annotated data available for training.
Despite the large effort that was put to produce pub-
licly available labels for nuclei segmentation, such as
the 2018 Data Science Bowl competition, such data is
often partially or even incorrectly labeled (He et al.,
2020).
2.2 Image Preprocessing
A frequently used approach to overcome the difficulty
of segmentation is to preprocess the images to im-
prove their quality. In the case of nuclei, such en-
hancement mainly concerns the contrast between the
nuclei and the background. Most traditional image
enhancement techniques rely on filtering (low pass,
high pass) or on naive noise removal such as Gaus-
sian blur. Other methods are based on normaliza-
tion of image intensity, such as histogram equaliza-
tion or contrast stretching (see for review (Qi et al.,
2021)). However, in the same way as the segmenta-
tion methods themselves, these image preprocessing
techniques lack the generalization ability. For exam-
ple, filtering or signal normalization is not applicable
to images with low SNR, as it cannot distinguish well
enough the signal from the background.
Deep Learning has been also applied at the pre-
processing step, in particular to estimate the trans-
formation function between sets of acquired images
and their enhanced counterparts through supervised
learning. One of the first and most successful meth-
ods was introduced with the CARE network (Weigert
et al., 2018), designed to restore fluorescence mi-
croscopy data without the need to generate manual
training data. The authors showed that it is possi-
ble to learn the mapping between low-intensity and
high-intensity image pairs using a U-Net based neu-
ral network. In the case of live-cell imaging, this
makes possible to restore the image quality. How-
ever, two characteristics of this network limit the gen-
eralization capacity of CARE to new types of im-
ages. First, CARE network follows the supervised
training paradigm and thus requires matching pairs of
the same image and the corresponding nuclei masks,
which is time-consuming. Second, CARE comports
5 separately trained networks and uses a disagree-
ment score between the individual network predic-
tions to eliminate unreliable results, which implies
that images with characteristics that strongly differ
from those in the training set will not be well restored
(Weigert et al., 2018).
2.3 Image to Image Translation
Image quality enhancement has also been approached
through image to image translation deep learning
methods. The goal is to transform an image having
a particular style (source style) into a desired target
style. The most efficient models are based on GANs
(Pang et al., 2021; Wang et al., 2020). Authors of
pix2pix (Isola et al., 2017) were the first to apply a
GAN-based architecture to perform the image to im-
age translation. It is a fully supervised method that
requires large paired image datasets to train the trans-
lation model that transforms the source images to the
desired target images. In the context of nuclei seg-
mentation, pix2pix has been used by the authors of
nucleAIzer for data augmentation of their training nu-
clei datasets. Specialized image enhancement models
have been since proposed, such as Cycle-CBAM (You
et al., 2019) for retinal image enhancement and UW-
CycleGAN (Du et al., 2021) for underwater image
enhancement, both based on the CycleGAN architec-
ture. Moreover, enhancement of objects of interest
has been proposed by the authors of DE-CycleGAN
(Gao et al., 2021) to enhance the weak targets for the
purpose of accurate vehicle detection.
SalienceNet: An Unsupervised Image-to-Image Translation Method for Nuclei Saliency Enhancement in Microscopy Images
43

3 PROPOSED METHOD
In this section, we present the SalienceNet nuclei
saliency enhancement network in detail. We first
present the network’s architecture, and then we dis-
cuss the custom generator loss function that drives the
saliency enhancement.
3.1 Network Architecture
SalienceNet implements the image style transfer for
nuclei microscopy images with CycleGAN architec-
ture (Zhu et al., 2017) where the network is com-
posed of two Generative Adversarial Network (GAN)
blocks that exchange information during training as
shown in figure 1.
Let X be the domain of acquired nuclei images
and Y the style domain of images with enhanced
nuclei saliency. Images do not have to be paired.
SalienceNet translates an image from domain X to the
target domain Y by learning a mapping G : X → Y
such that the distribution of images from G(X ) is in-
distinguishable from Y by an adversarial loss.
The architecture is based on the simultaneous
training of two generator models and two discrimi-
nator models (see figure 1). First, generator G takes
input from the domain X and outputs images for the
target style domain Y , and second, generator F takes
input from the domain Y and generates images for the
domain X. Adversarial discriminator models are used
to drive the training by estimating how well the gener-
ated images fit the domain: D
Y
distinguishes the out-
puts of G(X) from domain Y ; in the same manner, D
X
distinguishes the outputs of F(Y ) from domain X.
In our model the discriminators D
X
and D
Y
are
implemented as PatchGAN classifiers, composed of
4 convolution blocks (see figure 2), each containing
a convolution layer, an instance normalization layer
and an activation layer (LeakyReLU). The generators
G and F are implemented as ResNets having the same
structure with 3 down convolutions, followed by 9
residual blocks, before applying 2 transpose convo-
lutions and one last convolution layer with a Tanh ac-
tivation (see figure 2).
The discriminator is implemented as a PatchGAN
model that outputs a square feature map of values,
each value encoding the probability that the corre-
sponding patch in the input image is real. These val-
ues are further averaged to generate the global likeli-
hood.
Since the mapping G : X → Y is highly under-
constrained, CycleGAN couples it with an inverse
mapping F : Y → X : the output ”fake Y ” from the
X → Y generator is used as input to the Y → X gener-
ator, whose output ”cycle X ” should match the orig-
inal input image X (and vice versa). This is en-
forced though the cycle consistency loss to obtain
F(G(X)) ≈ X and G(F(Y )) ≈ Y .
3.2 Generator Loss Function
An additional generator loss is used to enforce the cy-
cle consistency and to measure the difference between
the generated output ”cycle X” and X as well as be-
tween the ”cycle Y ” and Y . This regularization makes
possible to constrain the generation process to image
translation.
For SalienceNet we defined the generator loss
function as a combination of three terms: (i) the Mean
Squared Error (MSE), (ii) the Mean Gradient Error
(MGE) and (iii) the Mean Structural SIMilarity index
(MSSIM).
The Mean Squared Error (MSE) computes the
mean of the squared differences between true and pre-
dicted values L
MSE
=
1
N
∑
N
i=1
((x
i
) − ( ˆx
i
))
2
. This term
ensures that the generator does not produce outliers
too far from the target domain. However, MSE used
alone is known to lead to blurring due to the averaging
between possible outputs, which in image-to-image
translation can lead to low-quality blurred results.
In the case of nuclei segmentation, blurring can
yield images where nuclei boundaries are particularly
difficult to accurately segment. To solve this gradient
problem, we added the Mean Gradient Error (Lu and
Chen, 2022) term L
MGE
that measures the differences
in edges of objects between two images, with the aim
to learn sharp edges. It is based on vertical and hori-
zontal Sobel operators (Kanopoulos et al., 1988), G
v
and G
h
:
G
v
= Y ∗
−1 −2 −1
0 0 0
1 2 1
G
h
= Y ∗
−1 0 1
−2 0 2
−1 0 1
.
where ∗ is the convolution operator.
These gradients are combined to define a global
pixel-wise gradient map G =
p
G
v
2
+ G
h
2
. The gra-
dient map for predicted images
ˆ
G is computed in the
same way. The L
MGE
is the defined as:
L
MGE
=
1
n
1
m
n
∑
i=1
m
∑
j=1
G(i, j) −
ˆ
G(i, j)
2
Finally, to drive the network to produce images
with a structure similar to the input structure, we
added L
MSSIM
the Mean Structural SIMilarity index
BIOIMAGING 2023 - 10th International Conference on Bioimaging
44
G: X ⟶ Y
Fake Y
(output)
F: Y ⟶ X
Fake X
(output)
D
Y
D
X
Generator loss Y to X
Generator loss X to Y
X (input)
Cyclic X
Cycle-consistency loss
Y (input)
Cyclic Y
Cycle-consistency loss
Feature
map
Feature
map
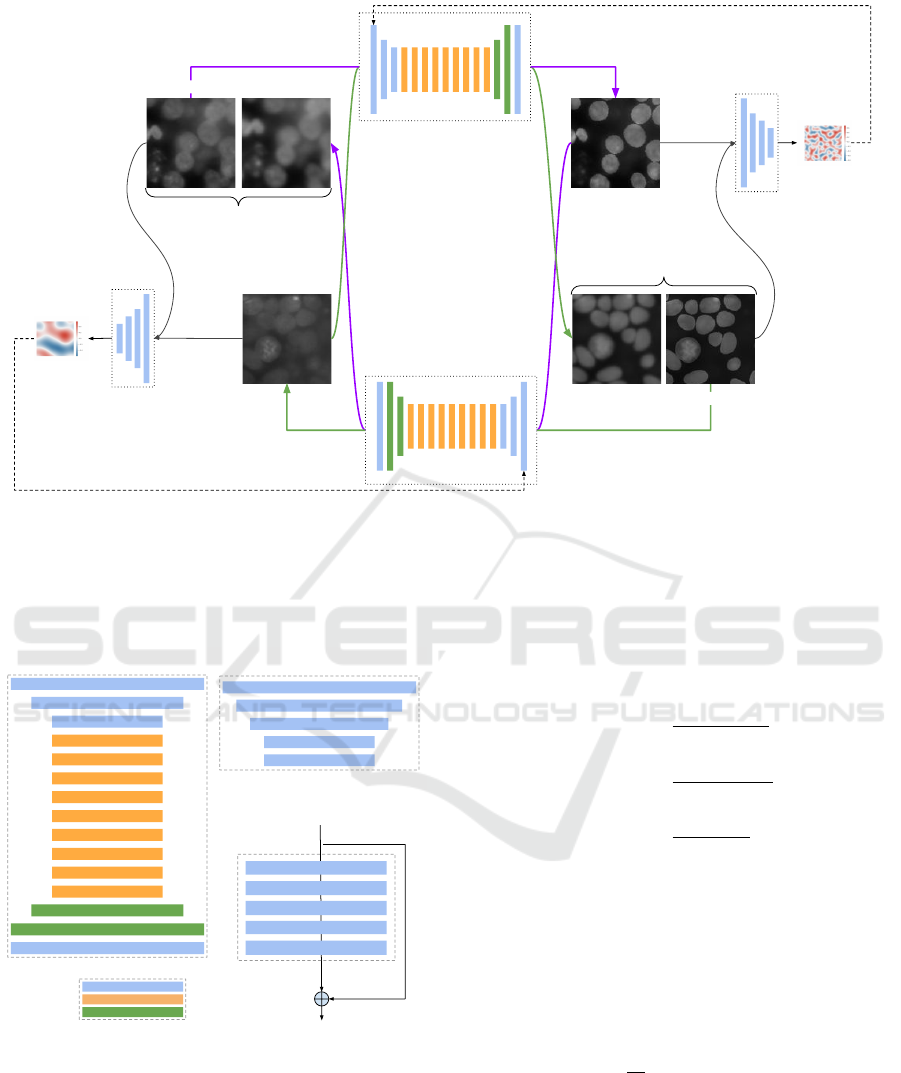
Figure 1: Architecture of SalienceNet. The network is composed by 2 GANs, each GAN having a Generator G and a
Discriminator D. The main element of the Generator is a residual network, while the discriminator is a PatchGAN whose
output is a feature map. The generator loss is computed based in this feature map. The inputs to the network are X(input) and
Y (input), and the outputs are Fake X and Fake Y , corresponding to G(F(Y )) and F(G(X)), respectively. Cycle consistency
loss is computed between the original image X and it’s reconstructed image F(G(X)) and between Y and it’s reconstructed
image G(F(Y )).
64 filters, 7x7, s = 1
128 filters, 3x3, s = 2
256 filters, 3x3, s = 2
256 filters, 3x3, s = 1
256 filters, 3x3, s = 1
256 filters, 3x3, s = 1
256 filters, 3x3, s = 1
256 filters, 3x3, s = 1
256 filters, 3x3, s = 1
256 filters, 3x3, s = 1
256 filters, 3x3, s = 1
256 filters, 3x3, s = 1
128 filters, 3x3, s = 2
64 filters, 3x3, s = 2
1 filters, 7x7, s = 1
64 filters, 4x4, s = 2
128 filters, 4x4, s = 2
256 filters, 4x4, s = 2
512 filters, 4x4, s = 2
1 filters, 4x4, s = 2
Generator Discriminator
Convolution block
Residual block
Transpose Convolution
Legend
Residual block
Conv2D, 256, 3x3, s = 1
Instance normalization
Activation (ReLu)
Conv2D, 256, 3x3, s = 1
Instance normalization
Shortcut
F(𝒙)
F(𝒙) + 𝒙
𝒙
Figure 2: Composition of the networks constituting
SalienceNet. Generators embed a residual network com-
posed of 9 residual blocks, each block being itself com-
posed of 2 convolution layers. Convolution blocks are
composed of a convolution layer, an instance normalization
layer and an activation layer which is ReLU for the genera-
tor and LeakyReLU for the discriminator.
(MSSIM) (Wang et al., 2004) as the last term. This
loss function compares two images based on lumi-
nance l, contrast c and structural information s:
l(x,y) =
2µ
x
µ
y
+ c
1
µ
2
x
+ µ
2
y
+ c
1
c(x,y) =
2σ
x
σ
y
+ c
2
σ
2
x
+ σ
2
y
+ c
2
s(x,y) =
σ
xy
+ c
3
σ
x
σ
y
+ c
3
where µ
x
and µ
y
denote the mean intensity for the in-
put and generated image respectively; σ
x
and σ
y
are
standard deviation for the original and generated im-
ages; c
1
,c
2
and c
3
are constants used to avoid insta-
bility when the denominators are close to 0.
The mean SSIM can be obtained over the entire
image using a local window as follows:
L
MSSIM
(x,y) =
1
M
M
∑
i=1
l(x
i
,y
i
) · c(x
i
,y
i
) · s(x
i
,y
i
)
where x and y denote the input and the generated im-
age, respectively, while x
i
and x
j
are the images at the
i-th window when the local window slides over the
original and generated images, and M is the number
of local windows in the image.
In the case of SalienceNet the intuition for the
MSSIM loss for the X → Y generator is to enforce the
SalienceNet: An Unsupervised Image-to-Image Translation Method for Nuclei Saliency Enhancement in Microscopy Images
45
Organoids Synth. low saliency
Source datasets
LocalizationScreen DataBowlSynth. high saliency
Targ et datasets
SalienceNet
Training Training
Organoids
Synthetic
Source datasets enhanced by SalienceNet
Segmentation
(StarDist, OTSU)
Nuclei segmentation
Masks (organoids)
Masks (synthetic)
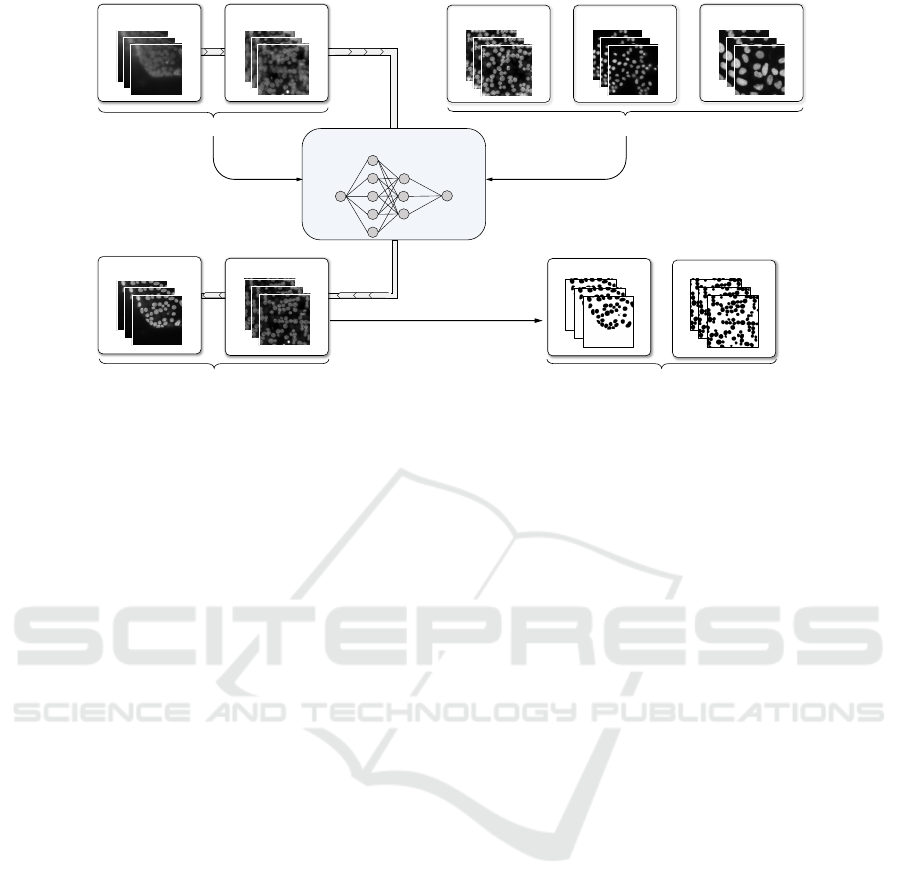
Figure 3: Training and evaluation of SaliencyNet. 90% of source style datasets and of the experimental target style datasets
were used to train the network. It was then applied to the remaining 10% of the source style datasets to obtain enhanced
images. Nuclei in the images enhanced by SalienceNet were segmented using classical methods with fixed parameters.
luminance enhancement, while for the Y → X gener-
ator to preserve the structure.
The total loss function is defined as the weighted
sum of the three terms:
L
total
= αL
MSE
+ βL
MGE
+ γL
MSSIM
where α, β and γ are the weights of each correspond-
ing term so that the sum α + β + γ = 1.
4 DATASETS
To train and evaluate our SalienceNet enhancement
method, we have collected different datasets (see fig-
ure 3). First, two experimentally acquired and ex-
pertly segmented datasets (see section 4.2), which
have been previously extensively used for training
segmentation models. Second, we have acquired a
dataset of organoid images with low-light conditions
that specifically represents the segmentation chal-
lenge that we want to address, as well as generated the
corresponding synthetic datasets (see sections 4.1 and
4.2). These images belong to one of the two styles:
1. Source style with low saliency of nuclei
(organoid and synthetic low saliency datasets),
2. Target style with high saliency of nuclei (two
experimental datasets and the synthetic high
saliency dataset).
4.1 Source Style Datasets
To evaluate whether SalienceNet enables precise nu-
clei segmentation, we acquired a 3D cell culture
dataset with the soSPIM technique. soSPIM is a sin-
gle objective light-sheet microscopy approach capa-
ble of streamlining 3D cell cultures with fast 3D live-
imaging at speeds up to 300 3D cultures per hour
(Galland et al., 2015; Beghin et al., 2022). We se-
lected 11 neuroectoderm organoids exhibiting a wide
variety of shapes and densities. These organoids have
been differentiated from hESCs, fixed at day 8, im-
munostained with DAPI and imaged using soSPIM,
yielding 1056 2D slices. These 2D image slices are
composing the DS
org
dataset.
To augment the source style dataset, in addition to
the experimental 1056 2D image slices, we generated
synthetic images. First, we performed an expert seg-
mentation of nuclei on each individual 2D slice. Sec-
ond, images paired with their annotated masks were
used to train a simple CycleGAN. Finally, this Cy-
cleGAN model was applied to transform randomly
placed elliptical shapes (roughly approximating nu-
clei shapes) into organoid look-alike images. The
elliptical shapes provide “nuclei” masks in a trivial
way. We generated 1500 synthetic low-saliency im-
ages, denoted by DS
synth
.
4.2 Target Style Datasets
The goal of our network is to learn to transform an
image i into e(i), where saliency (Kim and Varshney,
2006) at nuclei location is enhanced. To provide the
target style dataset for training the SalienceNet net-
work, we have collected two experimental datasets
where the nuclei saliency was already satisfactory for
segmentation by classical pipelines and for which the
nuclei segmentation masks are available. We comple-
BIOIMAGING 2023 - 10th International Conference on Bioimaging
46
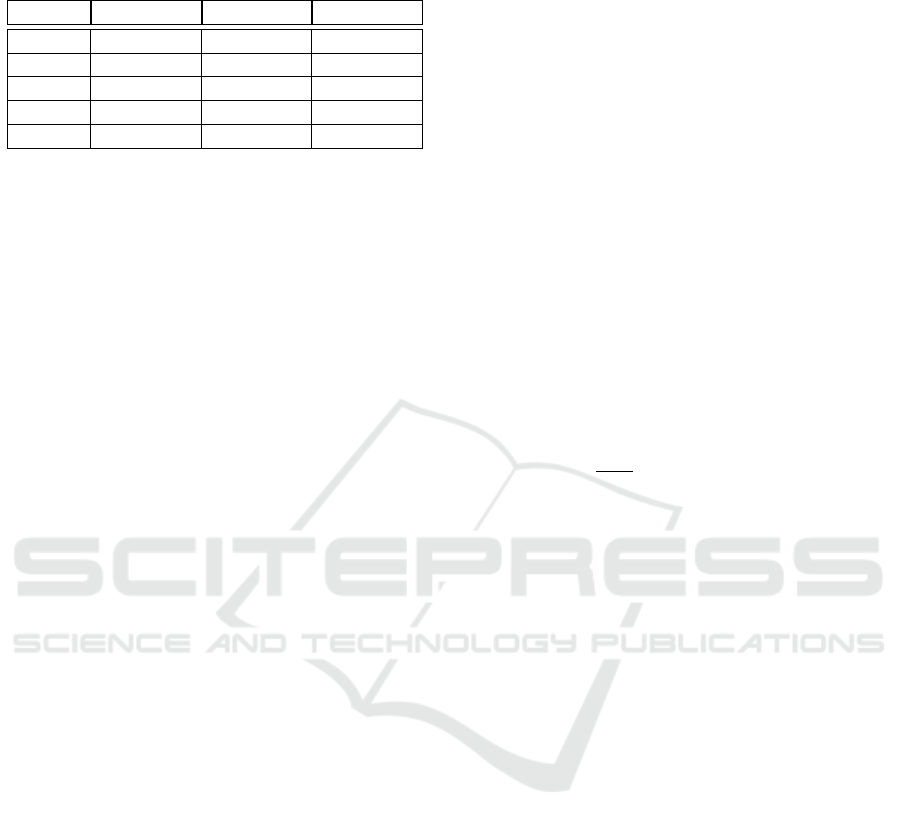
Table 1: Number of images and nuclei in each dataset (DS
column) used for the training and testing of SalienceNet.
DS #Images #Nuclei Style
DS
org
1056 43633 Source
DS
synth
1500 128962 Source
TS
LS
568 20754 Target
TS
DB
551 23121 Target
TS
synth
2000 171915 Target
mented them by a synthetic high-saliency dataset.
In 2018, a Data Science Bowl competition orga-
nized by Kaggle released a dataset for a challenge of
”Identification and Segmentation of Nuclei in Cells”
of images acquired under different conditions and of
different cell types and that vary in size, magnifica-
tion, and imaging method (brightfield and fluores-
cence). Nuclei masks have been manually created by
specialists and are provided with the dataset. For the
purpose of this paper, only grayscale cell culture im-
ages were kept, yielding the TS
DB
with 551 images.
Experimentally acquired nuclei images from hu-
man cell lines (Chouaib et al., 2020) were used to de-
fine the TS
LS
dataset. It is composed of 568 images
from 57 different acquisition conditions of 32 gene
expression measured in the study for the purpose of
performing a localization screen. Nuclei masks have
been acquired with NucleAIzer.
The synthetic high-saliency dataset, TS
synth
, was
generated following the same procedure as DS
synth
(see section 4.1) with 2000 images, but with enhanced
saliency. Nuclei masks are provided by the input gen-
eration procedure (elliptical shapes).
Taking these 3 datasets together (summarized in
table 1), the target style dataset contains 3119 images.
5 RESULTS
To train the SalienceNet models, we split each of the
two source datasets as well as the two experimental
target datasets (see figure 3) into train and test subsets,
in 90% and 10% proportions. The test datasets are
denoted DS
t
org
, DS
t
synth
, TS
t
DB
and TS
t
LS
, respectfully.
We then performed the hyperparameter search by
exploring all possible combinations of α, β, and γ
(weights of the loss components, see section 3.2) with
step of 0.1 in order to estimate which combination of
parameters yielded the best model. This resulted in 42
models, denoted by (α,β, γ) combinations in figure 5.
Moreover, for comparison purposes we have trained
a vanilla CycleGAN model, without any modification
with respect to the original CycleGAN network.
All the 42 SalienceNet models and the vanilla Cy-
cleGAN were applied to the 4 test datasets DS
t
org
,
DS
t
synth
, TS
t
DB
and TS
t
LS
to perform saliency enhance-
ment. The original images and their enhanced coun-
terparts were then segmented, without any parameter
tuning, using two widely used segmentation methods:
1. the non-parametric version of the classical seg-
mentation Otsu thresholding method with an
adaptive threshold,
2. StarDist, a deep-learning based segmentation,
with the 2D fluo versatile model as provided by
(Schmidt et al., 2018), without re-training on our
data or supplementary fine-tuning.
The resulting masks were then compared with
ground truth. For this purpose, expert ground truth
annotation was performed on the DS
t
org
test dataset;
nuclei masks (ground truth) were already available for
the 3 other test datasets (see sections 4.1 and 4.2).
To measure the quality of the resulting segmenta-
tion, we computed the intersection over union (IOU)
for each image to quantify the overlap (in pixel
count) between the segmentation and the ground
truth: IOU =
|S∩G|
|S∪G|
, where S is the mask resulting
from segmentation and G is the ground truth mask.
SalienceNet Enables Accurate Nuclei Segmenta-
tion. First, we determined the most performant
model with respect to our goal of segmenting low
SNR images from live-cell imaging by looking at
the enhancement performance on organoid images.
Figure 5 shows the IOU scores for segmentation by
StarDist of both enhanced (by 42 models) and non-
enhanced images, and that for each image of the ex-
perimental organoid test dataset DS
t
org
. Individual
model results for Otsu segmentation being very simi-
lar (albeit slightly worse), are not shown in this figure.
The IOU is shown in figure 5 for each image with
respect to the ground truth. The geometric mean of
all non-enhanced image’s IOU was 0.49 for StarDist
segmentation and 0.45 for Otsu segmentation, while
the geometric mean for IOU after saliency enhance-
ment ranged from 0.54 to 0.75 for StarDist and from
0.48 to 0.75 for Otsu segmentation. Best results
were obtained for segmentation after enhancement by
the SalienceNet model with α = 0.2, β = 0.2, and
γ = 0.6, with a geometric mean of IOU of 0.75 for
both StarDist and Otsu. We denote this model by M.
The impact of this model M on the quality of the
downstream segmentation was computed as the ratio
of IOU for images enhanced with M over the IOU
of non-enhanced images. Impact values range be-
tween 1.08 and 2.57 for Otsu segmentation and be-
tween 1.09 and 10.73 for StarDist segmentation; no-
tice that the lower bound is > 1 in both cases.
SalienceNet: An Unsupervised Image-to-Image Translation Method for Nuclei Saliency Enhancement in Microscopy Images
47
Original image StarDist SalienceNet
SalienceNet+
StarDist
Ground truth
Organoids
Organoids
Zoom In
Synthetic
Zoom In
Synthetic
Figure 4: Examples of segmentation results by StarDist obtained without enhancement and after enhancement by SalienceNet
M model. Sample images come from two low saliency test datasets: DS
t
org
for the two upper rows, and DS
t
synth
for the two
lower rows. Rows 2 and 4 show a zoom-in of the respective rows right above.
Stardist
Otsu
Stardist
Otsu
Impact
0.8
0.7
0.6
0.5
0.4
0.3
0.2
0.1
StarDist
CycleGAN
(0.4, 0.2, 0.4)
(0.3, 0.4, 0.3)
(0.2, 0.6, 0.2)
(0.1, 0.8, 0.1)
(0.4, 0.4, 0.2)
(0.3, 0.3, 0.4)
(0.2, 0.2, 0.6)
(0.1, 0.1, 0.8)
(0.4, 0.4, 0.4)
(0.5, 0, 0.5)
(0.4, 0.3, 0.3)
(0.6, 0.2, 0.2)
(0.8, 0.1, 0.1)
(0.9, 0, 0.1)
(0.8, 0, 0.2)
(0.7, 0, 0.3)
(0.6, 0, 0.4)
(0.4, 0, 0.6)
(0.3, 0, 0.7)
(0.2, 0, 0.8)
(0.1, 0, 0.9)
(0, 0, 1)
(0, 0.9, 0.1)
(0, 0.8, 0.2)
(0, 0.6, 0.4)
(0, 0.5, 0.5)
(0, 0.4, 0.6)
(0, 0.3, 0.7)
(0, 0.2, 0.8)
(0, 0.1, 0.9)
(0.8, 0.2, 0)
(0.9, 0.1, 0)
(0.7, 0.3, 0)
(0.6, 0.4, 0)
(0.5, 0.5, 0)
(0.4, 0.6, 0)
(0.3, 0.7, 0)
(0.2, 0.8, 0)
(0.1, 0.9, 0)
(1, 0, 0)
(0, 1, 0)
1
10
1.2
1.4
1.6
1.8
2.2
2.4
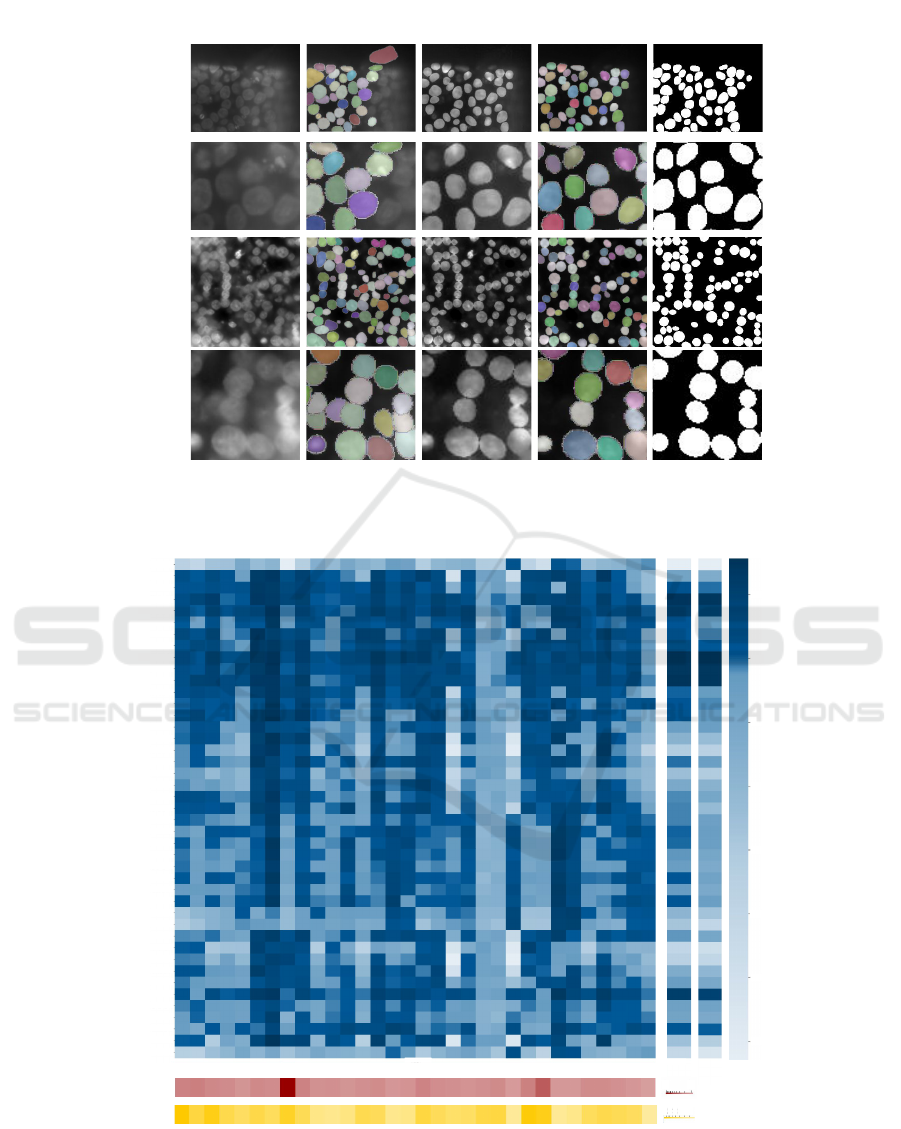
Figure 5: Heatmap of the IOU values for each image segmentation of DS
t
org
, after enhancement and without enhancement.
Average IOU values are shown in the two right columns (StarDist and Otsu). First line: IOUs obtained for non-enhanced
images; second line: IOUs after enhancement by the vanilla CycleGAN and segmentation by StarDist, all the other lines:
IOUs for segmentation by StarDist after enhancement by SalienceNet for different α,β and γ values. Bottom-most rows (red
and yellow color-scale) show the impact of M enhancement on segmentation quality as IOU ratio (log scale).
BIOIMAGING 2023 - 10th International Conference on Bioimaging
48
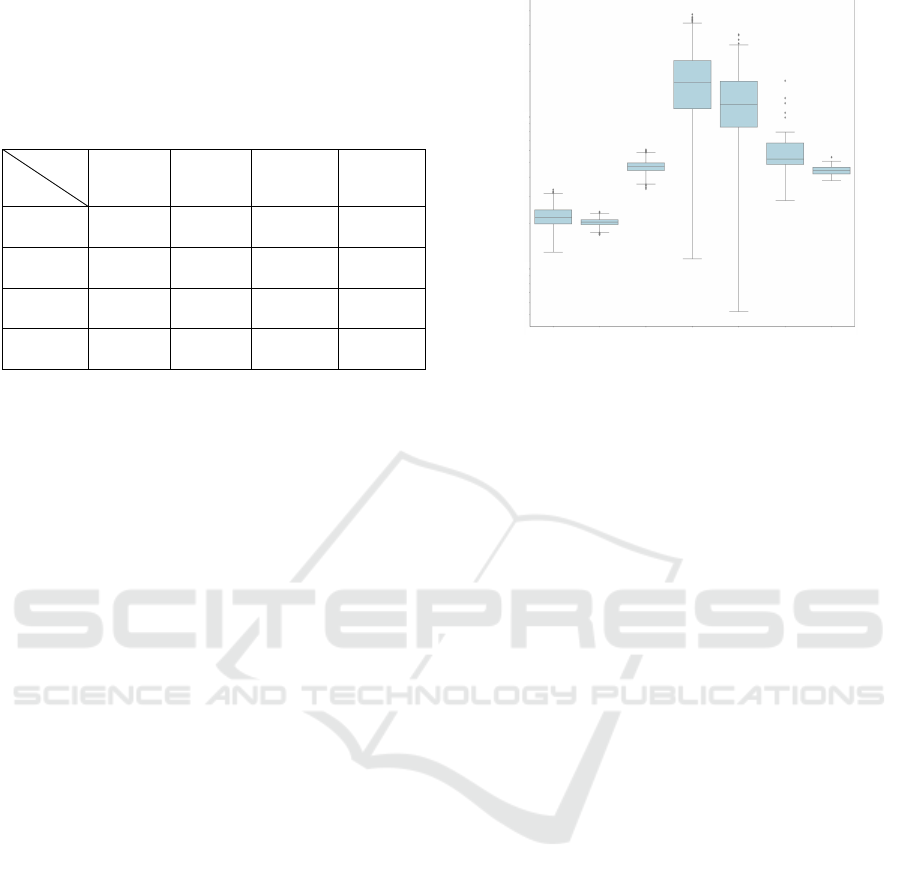
Table 2: IOU values for segmentation with Otsu or StarDist
of non-enhanced and enhanced with M SalienceNet (SN)
model images in 4 test datasets. All reported values are
the geometric mean, per dataset, of the IOU of individual
images. Top values in each cell correspond to the geometric
mean, bottom values between brackets show the values for
the 0.25 and 0.75 percentiles.
DS
IOU
Otsu
SN+
Otsu
StarDist
SN+
StarDist
DS
t
org
0.45 0.75 0.49 0.75
[0.38, 0.51] [0.74, 0.79] [0.38, 0.59] [0.74, 0.79]
DS
t
synth
0.62 0.90 0.62 0.86
[0.61, 0.67] [0.89, 0.90] [0.59, 0.65] [0.84, 0.87]
TS
t
LS
0.82 0.86 0.90 0.90
[0.80, 0.90] [0.83, 0.91] [0.88, 0.91] [0.88, 0.91]
TS
t
DB
0.69 0.78 0.83 0.83
[0.63, 0.86] [0.74, 0.87] [0.79, 0.88] [0.79, 0.88]
An illustration of StarDist segmentation results for
non-enhanced images and for those enhanced by M
for low saliency organoid images is provided in fig-
ure 4.
Table 2 shows the IOU values for the best model
M of SalienceNet applied to the 4 test datasets before
and after enhancement by SalienceNet. On one hand,
we observed that SalienceNet indeed improved the
accuracy of nuclei segmentation in low-light source
datasets. On the other hand, this table shows that for
the already salient images, SalienceNet did not de-
grade the quality of segmentation.
Together, these results show that saliency en-
hancement by SalienceNet enables accurate down-
stream nuclei segmentation by widely used methods
without need for parameter tuning.
SalienceNet Enhances Nuclei Saliency. To evalu-
ate whether SalienceNet improved saliency, we com-
puted its indirect measure - the Signal to Noise Ratio
(SNR) as SNR = (m − µ
B
)/σ , where m is the max-
imum pixel intensity within the nuclei masks in an
image, µ
B
is the mean value of the background and σ
is the standard deviation of the background. The SNR
was computed for the source style datasets DS
org
and
DS
synth
, and the target style datasets TS
synth
, TS
LS
and
TS
DB
. We also measured the SNR of the test datasets
DS
t
org
and DS
t
synth
after enhancement by SalienceNet.
We observed (see figure 6) that SalienceNet en-
hanced SNR in low-light images of DS
t
org
and DS
t
synth
close to the level of SNR of the already salient exper-
imental target style images TS
LS
and TS
DB
, and up to
the SNR level of the synthetic salient dataset TS
synth
.
DS
org
TS
DB
DS
Synt
h
TS
synth
TS
LS
DS
t
org
+ SN
DS
t
synth
+ SN
1
10
Figure 6: Signal to Noise Ratio (SNR) distributions. Box-
plots represent the distribution of SNR for the source style
images DS
t
org
and DS
t
synth
and the target style images TS
LS
TS
DB
, TS
synth
. SNR distributions of the test images after
enhancement with SalienceNet M model are shown for the
low-light DS
t
org
and DS
t
synth
datasets.
6 SUMMARY
In this work, we introduced SalienceNet, a
CycleGAN-based network specifically designed
to enhance nuclei’s saliency in low SNR images that
does not require annotation for training on new data.
We used the soSPIM light-sheet microscopy, a
technique that allows to illuminate the biological sam-
ple with little light compared to other methods, to ac-
quire organoid images. The result is that the illumi-
nation and the SNR are lower in these images and the
nuclei are less salient. We used these organoid images
as source style for training our network and further
for testing. To implement SalienceNet we combined
three loss functions with different properties and have
shown that our adaptation of CycleGan improved seg-
mentation results after enhancement relative to both
segmentation of non-enhanced images and of those
enhanced with the vanilla CycleGan.
We compared the segmentation results of widely
used non-parametric Otsu thresholding and StarDist
on both raw images and images enhanced with
SalienceNet of our novel organoid live-cell imaging
dataset. We have shown that using SalienceNet im-
proved the segmentation quality of both classical and
deep learning based nuclei segmentation algorithms
in low SNR nuclei images. It should be noted that
adding the SalienceNet enhancement step prior to nu-
clei segmentation did not degrade the quality of re-
sults for the already salient datasets.
Taken together, these results show that
SalienceNet: An Unsupervised Image-to-Image Translation Method for Nuclei Saliency Enhancement in Microscopy Images
49

SalienceNet is a useful new step for nuclei seg-
mentation workflows.
7 CODE AVAILABILITY
SalienceNet network’s code for training and testing
nuclei enhancement is fully open source and available
on GitHub at https://github.com/cbib/SalienceNet.
Our best pre-trained model M used in this study is
also available from the same GitHub page.
REFERENCES
Bankhead, P., Loughrey, M. B., Fern
´
andez, J. A., Dom-
browski, Y., McArt, D. G., Dunne, P. D., McQuaid,
S., Gray, R. T., Murray, L. J., Coleman, H. G., et al.
(2017). Qupath: Open source software for digital
pathology image analysis. Scientific reports, 7(1):1–7.
Beghin, A., Grenci, G., Sahni, G., Guo, S., Rajendiran, H.,
Delaire, T., Mohamad Raffi, S. B., Blanc, D., de Mets,
R., Ong, H. T., et al. (2022). Automated high-speed 3d
imaging of organoid cultures with multi-scale pheno-
typic quantification. Nature Methods, 19(7):881–892.
Caicedo, J. C., Goodman, A., Karhohs, K. W., Cimini,
B. A., Ackerman, J., Haghighi, M., Heng, C., Becker,
T., Doan, M., McQuin, C., et al. (2019). Nucleus seg-
mentation across imaging experiments: the 2018 data
science bowl. Nature methods, 16(12):1247–1253.
Chouaib, R., Safieddine, A., Pichon, X., Imbert, A., Kwon,
O. S., Samacoits, A., Traboulsi, A.-M., Robert, M.-C.,
Tsanov, N., Coleno, E., Poser, I., Zimmer, C., Hyman,
A., Le Hir, H., Zibara, K., Peter, M., Mueller, F., Wal-
ter, T., and Bertrand, E. (2020). A dual protein-mrna
localization screen reveals compartmentalized trans-
lation and widespread co-translational rna targeting.
Developmental Cell, 54(6):773–791.e5.
De Chaumont, F., Dallongeville, S., Chenouard, N., Herv
´
e,
N., Pop, S., Provoost, T., Meas-Yedid, V., Panka-
jakshan, P., Lecomte, T., Le Montagner, Y., et al.
(2012). Icy: an open bioimage informatics platform
for extended reproducible research. Nature methods,
9(7):690.
Du, R., Li, W., Chen, S., Li, C., and Zhang, Y. (2021). Un-
paired underwater image enhancement based on cy-
clegan. Information, 13(1):1.
Ettinger, A. and Wittmann, T. (2014). Fluorescence live cell
imaging. Methods in cell biology, 123:77–94.
Galland, R., Grenci, G., Aravind, A., Viasnoff, V., Studer,
V., and Sibarita, J.-B. (2015). 3d high-and super-
resolution imaging using single-objective spim. Na-
ture methods, 12(7):641–644.
Gao, P., Tian, T., Li, L., Ma, J., and Tian, J. (2021). De-
cyclegan: An object enhancement network for weak
vehicle detection in satellite images. IEEE Journal
of Selected Topics in Applied Earth Observations and
Remote Sensing, 14:3403–3414.
G
´
omez-de Mariscal, E., Garc
´
ıa-L
´
opez-de Haro, C.,
Ouyang, W., Donati, L., Lundberg, E., Unser, M.,
Mu
˜
noz-Barrutia, A., and Sage, D. (2021). Deepim-
agej: A user-friendly environment to run deep learn-
ing models in imagej. Nature Methods, 18(10):1192–
1195.
Haase, R., Royer, L. A., Steinbach, P., Schmidt, D., Di-
brov, A., Schmidt, U., Weigert, M., Maghelli, N.,
Tomancak, P., Jug, F., et al. (2020). Clij: Gpu-
accelerated image processing for everyone. Nature
methods, 17(1):5–6.
He, J., Wang, C., Jiang, D., Li, Z., Liu, Y., and Zhang,
T. (2020). Cyclegan with an improved loss func-
tion for cell detection using partly labeled images.
IEEE Journal of Biomedical and Health Informatics,
24(9):2473–2480.
Hollandi, R., Moshkov, N., Paavolainen, L., Tasnadi, E.,
Piccinini, F., and Horvath, P. (2022). Nucleus seg-
mentation: towards automated solutions. Trends in
Cell Biology.
Hollandi, R., Szkalisity, A., Toth, T., Tasnadi, E., Molnar,
C., Mathe, B., Grexa, I., Molnar, J., Balind, A., Gorbe,
M., et al. (2020). nucleaizer: a parameter-free deep
learning framework for nucleus segmentation using
image style transfer. Cell Systems, 10(5):453–458.
Isola, P., Zhu, J.-Y., Zhou, T., and Efros, A. A. (2017).
Image-to-image translation with conditional adversar-
ial networks. In Proceedings of the IEEE conference
on computer vision and pattern recognition, pages
1125–1134.
Kanopoulos, N., Vasanthavada, N., and Baker, R. L. (1988).
Design of an image edge detection filter using the
sobel operator. IEEE Journal of solid-state circuits,
23(2):358–367.
Kim, Y. and Varshney, A. (2006). Saliency-guided enhance-
ment for volume visualization. IEEE Transactions
on Visualization and Computer Graphics, 12(5):925–
932.
Li, G., Liu, T., Tarokh, A., Nie, J., Guo, L., Mara, A., Hol-
ley, S., and Wong, S. T. (2007). 3d cell nuclei seg-
mentation based on gradient flow tracking. BMC cell
biology, 8(1):1–10.
Lu, Z. and Chen, Y. (2022). Single image super-resolution
based on a modified u-net with mixed gradient loss.
signal, image and video processing, 16(5):1143–
1151.
Malpica, N., De Sol
´
orzano, C. O., Vaquero, J. J., Santos, A.,
Vallcorba, I., Garc
´
ıa-Sagredo, J. M., and Del Pozo, F.
(1997). Applying watershed algorithms to the seg-
mentation of clustered nuclei. Cytometry: The Jour-
nal of the International Society for Analytical Cytol-
ogy, 28(4):289–297.
McQuin, C., Goodman, A., Chernyshev, V., Kamentsky, L.,
Cimini, B. A., Karhohs, K. W., Doan, M., Ding, L.,
Rafelski, S. M., Thirstrup, D., et al. (2018). Cellpro-
filer 3.0: Next-generation image processing for biol-
ogy. PLoS biology, 16(7):e2005970.
Pang, Y., Lin, J., Qin, T., and Chen, Z. (2021). Image-to-
image translation: Methods and applications. IEEE
Transactions on Multimedia.
BIOIMAGING 2023 - 10th International Conference on Bioimaging
50

Qi, Y., Yang, Z., Sun, W., Lou, M., Lian, J., Zhao, W., Deng,
X., and Ma, Y. (2021). A comprehensive overview of
image enhancement techniques. Archives of Compu-
tational Methods in Engineering, pages 1–25.
Ronneberger, O., Fischer, P., and Brox, T. (2015). U-net:
Convolutional networks for biomedical image seg-
mentation. In International Conference on Medical
image computing and computer-assisted intervention,
pages 234–241. Springer.
Schindelin, J., Arganda-Carreras, I., Frise, E., Kaynig, V.,
Longair, M., Pietzsch, T., Preibisch, S., Rueden, C.,
Saalfeld, S., Schmid, B., et al. (2012). Fiji: an open-
source platform for biological-image analysis. Nature
methods, 9(7):676–682.
Schmidt, U., Weigert, M., Broaddus, C., and Myers, G.
(2018). Cell detection with star-convex polygons. In
International Conference on Medical Image Comput-
ing and Computer-Assisted Intervention, pages 265–
273. Springer.
Stringer, C., Wang, T., Michaelos, M., and Pachitariu, M.
(2021). Cellpose: a generalist algorithm for cellular
segmentation. Nature methods, 18(1):100–106.
Wang, L., Chen, W., Yang, W., Bi, F., and Yu, F. R. (2020).
A state-of-the-art review on image synthesis with gen-
erative adversarial networks. IEEE Access, 8:63514–
63537.
Wang, Z., Bovik, A. C., Sheikh, H. R., and Simoncelli, E. P.
(2004). Image quality assessment: from error visi-
bility to structural similarity. IEEE transactions on
image processing, 13(4):600–612.
Weigert, M., Schmidt, U., Boothe, T., M
¨
uller, A., Dibrov,
A., Jain, A., Wilhelm, B., Schmidt, D., Broaddus, C.,
Culley, S., et al. (2018). Content-aware image restora-
tion: pushing the limits of fluorescence microscopy.
Nature methods, 15(12):1090–1097.
You, Q., Wan, C., Sun, J., Shen, J., Ye, H., and Yu, Q.
(2019). Fundus image enhancement method based on
cyclegan. In 2019 41st annual international confer-
ence of the IEEE engineering in medicine and biology
society (EMBC), pages 4500–4503. IEEE.
Zhou, Y., Onder, O. F., Dou, Q., Tsougenis, E., Chen, H.,
and Heng, P.-A. (2019). Cia-net: Robust nuclei in-
stance segmentation with contour-aware information
aggregation. In International conference on informa-
tion processing in medical imaging, pages 682–693.
Springer.
Zhu, J.-Y., Park, T., Isola, P., and Efros, A. A. (2017).
Unpaired image-to-image translation using cycle-
consistent adversarial networks. In Proceedings of
the IEEE international conference on computer vi-
sion, pages 2223–2232.
SalienceNet: An Unsupervised Image-to-Image Translation Method for Nuclei Saliency Enhancement in Microscopy Images
51
