
ECA-CE: An Evolutionary Clustering Algorithm with Initial Population
by Clustering Ensemble
Chao Xu
1
, Chunlin Xu
2
and Shengli Wu
1
1
School of Computer Science, Jiangsu University, Zhenjiang, China
2
School of Computer Science,Guangdong Polytechnic Normal University, Guangzhou, China
Keywords:
Evolutionary Clustering, Clustering Ensemble, Supervised Classifier.
Abstract:
Evolutionary clustering is a type of algorithm that uses genetic algorithms to optimize clustering results.
Unlike traditional clustering algorithms which obtain clustering results by iteratively increasing the distance
between clusters and reducing the distance between instances within a cluster, the evolutionary clustering al-
gorithm tries to search for the optimal clustering result in the solution space. Not surprisingly, the initial pop-
ulation set in an evolutionary clustering algorithm has significant influence on the final results. To ensure the
quality of the initial population, this paper proposed a clustering ensemble-based method, ECA-CE, to do the
initial population for the evolutionary clustering algorithm. In ECA-CE, a clustering ensemble method, Hy-
brid Bipartite Graph Formulation, is applied. Extensive experiments are conducted on 20 benchmark datasets,
and the experimental results demonstrate that the proposed ECA-CE is more effective than two evolutionary
clustering algorithms F1-ECAC and ECAC in terms of Adjusted Rand index.
1 INTRODUCTION
In most real-world situations, data is unlabeled. Clus-
tering is an unsupervised learning algorithm that takes
an unlabeled dataset as input and divides it into a cer-
tain number of clusters, where data with similar char-
acteristics are grouped. The ideal clustering result
should be that all the clusters generated are indepen-
dent of each other and data within a cluster are rela-
tively compact.
Traditional clustering algorithms can be mainly
divided into three groups, including partition-based,
hierarchy-based, and graph-theory-based clustering
algorithms. The main idea of the partition-based algo-
rithms is to discover the groupings in the data by op-
timizing a specific objective function and iteratively
improving the quality of partitions (Kang et al., 2019).
The shortcoming of partition-based clustering algo-
rithms is that they can easily be trapped in a local op-
timum. Hierarchy-based clustering algorithms divide
data at different levels to form a tree-like structure
(Nielsen, 2016). The graph-based clustering algo-
rithms (Von Luxburg, 2007) construct an undirected
graph with similarity weights defined in a matrix and
then apply a clustering algorithm to partition the undi-
rected graph.
Different from those traditional methods, evo-
lutionary clustering algorithms utilize genetic algo-
rithms to search for the global optimal clustering re-
sults. F1-ECAC (Sainz-Tinajero et al., 2021b) and
ECAC (Sainz-Tinajero et al., 2021a) are two re-
cently proposed evolutionary clustering algorithms
that achieve good performance. However, one prob-
lem of F1-ECAC and ECAC is that the quality of the
initial population is unstable, which impacts the final
clustering results. If the evolutionary clustering al-
gorithm cannot start with a good initial population, it
will require more time to obtain the optimal clustering
result, or cannot find that at all.
To alleviate the above problem, this paper pro-
poses an evolutionary clustering algorithm, ECA-CE
(Evolutionary Clustering Algorithm with initial pop-
ulation by Clustering Ensemble), whose initial popu-
lation is produced by a clustering ensemble and em-
ploys multiple supervised classifiers to evaluate each
individual’s fitness. Our experimental results show
that the proposed method achieves better performance
than F1-ECAC and ECAC do.
The rest of the paper is organized as follows: Sec-
tion II summarizes related work. Section III describes
ECA-CE. The experimental settings and results for
the evaluation of the proposed method are presented
in Section IV. Finally, a summary is given in Section
V.
132
Xu, C., Xu, C. and Wu, S.
ECA-CE: An Evolutionary Clustering Algorithm with Initial Population by Clustering Ensemble.
DOI: 10.5220/0011621700003393
In Proceedings of the 15th International Conference on Agents and Artificial Intelligence (ICAART 2023) - Volume 3, pages 132-139
ISBN: 978-989-758-623-1; ISSN: 2184-433X
Copyright
c
2023 by SCITEPRESS – Science and Technology Publications, Lda. Under CC license (CC BY-NC-ND 4.0)

2 RELATED WORK
2.1 Traditional Clustering Algorithms
There are several types of traditional clustering algo-
rithms.
1. Partition-based algorithm: For a given initial
central point, a heuristic search method is used to it-
eratively update each cluster and its centroid until the
distance between any two instances within a cluster
is small enough and the distance between clusters is
large enough.
2. Hierarchy-based algorithm: To create clusters
in a hierarchical tree-like structure in which the root
node corresponds to the entire dataset, and branches
are created from the root node to form hierarchical
clusters. Mainly there are two types of hierarchy-
based clustering algorithms: fused hierarchical clus-
tering and partitioned hierarchical clustering. The
fused hierarchical clustering algorithm generates all
the nodes in a bottom-up style, while the latter does it
in a top-down style.
3. Graph-based algorithm: Each data point in a
dataset is represented as a node, the distance between
two data points is modeled by an edge between the
two nodes with a weight. In this way, the cluster-
ing problem can be transformed into a graph partition
problem, and the clustering results can be obtained by
applying some partition criteria such as minimum cut
on the graph.
In this study, we choose a typical method from
each category as the baseline for performance com-
parison. Also they are used as base clustering algo-
rithms for the clustering ensemble.
a) K-means: It is a well-known partition-based
method with multiple variants, such as k-medoids, k-
medians, etc. K-means is a centroid-based cluster-
ing algorithm. This method tries to shorten the av-
erage Euclidean distance from each data point to the
centroid of the cluster through iterative membership
change. Since K-means intends to build sufficiently
tight clusters, the algorithm is likely to fall into lo-
cal optima and is exceptionally sensitive to noisy data
points.
b) BIRCH: It constructs a cluster feature tree
(CFT) for the dataset. Since the algorithm uses a tree
model, then it is well-interpretable and can solve non-
spherical problems that cannot be solved by K-means.
However, the construction of the tree structure leads
to high time complexity. Therefore, BIRCH may not
be able to handle high-dimensional data.
c) Spectral Clustering: Spectral Clustering is a
graph-based algorithm. Spectral Clustering requires a
similarity matrix between instances to work. It is ef-
fective in dealing with sparse datasets. Due to the use
of dimensionality reduction, it is a more appropriate
solution for high-dimensional datasets than BIRCH.
However, as Spectral Clustering relies on similarity
matrices, different similarity matrices may yield dif-
ferent clustering results.
Algorithm 1: HBGF.
Require: dataset D =
{
X
1
,X
2
..,X
n
}
,X
i
=
{
x
1
,x
2
..,x
m
}
n is the number of instances and
m is the number of features.
graph partitioning algorithm package
L(SPEC (Shi and Malik, 2000) or METIS
(Karypis and Kumar, 1998)) )
1: V = D ∪C; C contains all
clusters,C =
c
j
|1 ≤ j ≤ k
∗
,k
∗
is the number of
clusters
2: E = φ;
3: for i = 1,...,n do:
4: for j = 1,...,k
∗
do:
5: if v
i
∈ v
j
then: v
i
is an instance.v
j
is a
cluster
6: E = E ∪
e
i j
add edge
e
id
= (v
i
,v
j
);
7: w
i j
= 1 Set equal weights for e
i j
;
8: end if
9: end for
10: end for
11: G = (V,E);
12: σ = L(G); Apply the specified graph
partitioning algorithm package on G
2.2 Evolutionary Clustering Algorithm
The evolutionary clustering algorithm generally ap-
plies the genetic search method to try to find the op-
timal results. In order to solve the density-related
clustering problem, Zhang et al. (Zhang et al., 2013)
proposed an evolutionary clustering algorithm based
on DBSCAN(Ester et al., 1996), and applied the time
smoothing degree penalty framework in the calcula-
tion process. Sainz Tinajero et al. (Sainz-Tinajero
et al., 2021a) proposed a single objective evolution-
ary clustering algorithm (ECAC) based on a super-
vised classifier, which uses random functions to ini-
tialize the population of solutions. After performing
selection, crossover, and mutation operations, a new
population is obtained. For the evaluation of a clus-
tering solution, we transform the solution to a classi-
fication problem, in which each instance is composed
of all the original attributes with a label correspond-
ing to a specific cluster. In order to let a classifier
ECA-CE: An Evolutionary Clustering Algorithm with Initial Population by Clustering Ensemble
133

work, they divide all the instances into two partitions:
Training and testing partitions. The training part is
used to train the classifier, and then the trained model
is applied to the testing part. Its AUC index is used
as the fitness metric of the clustering results. Multiple
supervised classifiers are used to make the evaluation
results more reliable. The best solution is kept in the
iterative process. The iteration stops when the end-
ing condition, either a predefined number of iterations
or a given AUC value, is satisfied. The author sub-
sequently proposed F1-ECAC (Sainz-Tinajero et al.,
2021b), a variant of ECAC, which uses F1 score to
replace AUC as the evaluation index.
Additionally, Mardi and Keyvanpour(Mardi and
Keyvanpour, 2021) applied the evolutionary cluster-
ing algorithm to set the initial points for the K-means
algorithm, which they believe can reduce the sensitiv-
ity of K-means to abnormal data.
3 PROPOSED ALGORITHM
3.1 ECA-CE
In this section, we describe ECA-CE in detail. We
will also discuss Hybrid Bipartite Graph Formula-
tion(HBGF) (Fern and Brodley, 2004), a clustering
ensemble algorithm, and how to use HBGF in ECA-
CE.
HBGF, a graph-based clustering ensemble algo-
rithm, was proposed by Fern et al. The pseudo-code
for the HBGF algorithm is shown in Algorithm 1. It
is expected that the clustering results generated by an
ensemble of multiple clustering algorithms are more
stable.
In ECA-CE, firstly we run three traditional clus-
tering algorithms including the aforementioned K-
means, BIRCH, and Spectral Clustering algorithm to
obtain three different clustering results. Then HBGF
is used to fuse them, and the fused clustering re-
sults are taken as an initial solution for the evolution-
ary clustering algorithm. We think that such an ini-
tial solution can help the evolutionary clustering al-
gorithm to find better solutions more quickly. Algo-
rithm 2 shows the process of the ECA-CE algorithm.
For a dataset D =
{
X
1
,X
2
..,X
n
}
,X
i
=
{
x
i1
,x
i2
..,x
im
}
,
where n denotes the number of instances and m de-
notes the number of features. ECA-CE calculates the
individual’s fitness in a supervised manner (Caruana
and Niculescu-Mizil, 2006).
Algorithm 2: ECA-CE.
Require: dataset D,the population size α ,number of
iterations β,number of clusters k
1: θ =
g
1
,g
2
,g
3
,...,g
j
,...g
n
= HBGF(D);
2: fmax = 0;
3: bestCrs = [];
4: for i = 1,...,α do:
5: θ
i
= random(θ); Using random functions to
increase the dissimilarity between chromosomes
6: f (i) = f itness(θ
i
); Calculate the fitness of
the individual θ
i
7: if f (i) > f max then:
8: fmax = f(i);
9: bestCrs = θ
i
;
10: end if
11: end for
12: for i = 1, 2, ..., β do:
13: for j = 1,2,...,α do:
14: P
j
= TournamentSelection(α);
Use tournament operator to obtain parent chro-
mosomes
15: end for
16: K
1
,K
2
,...,K
α
= Single −
pointCrossover(P
1
,P
2
,...,Pα); Generate
children using the single-point crossover operator
17: K
‘
1
,K
‘
2
,...,K
‘
α
= Mutationi(K
1
,K
2
,...,K
α
);
18: for j = 1,2,...,α do:
19: f ( j) = fitness(K
‘
j
) ;
20: if f ( j) > f max then:
21: fmax = f(j);
22: bestCrs = K
‘
j
;
23: end if
24: end for
25: end for
26: return bestCrs;
3.2 Chromosome Coding and
Population Initialization
First, the individual’s chromosomes (solution) of the
genetic algorithm are encoded with integers as shown
in Figure 1. For the ith individual, its chromosomes
G
i
=
g
1
,g
2
,g
3
,...,g
j
,...g
n
can be represented as a
vector with n positions where n is the number of the
instances of the dataset and g
j
denotes the cluster
number for the jth instance. The initialization proce-
dure for the first generation of the parent individual is
as follows: firstly, three different types of clustering
algorithms K-means, BIRCH, and Spectral Cluster-
ing, are used to generate three clustering results, and
then HBGF is used to fuse the three clustering results
into one cluster result. At this point, the fused cluster-
ing results can only be the chromosome of one indi-
ICAART 2023 - 15th International Conference on Agents and Artificial Intelligence
134

vidual. There are three common ways to ensure diver-
sity among the initialized individuals: 1) data pertur-
bation, such as autonomous sampling of bagging; 2)
attribute perturbation of the dataset, such as attribute
sampling of the random subspace; 3) algorithm pa-
rameter perturbation, such as setting different hyper-
parameters of the base learner. After trying the above
three methods in our experiments, we found that nei-
ther of them could obtain good results. Therefore, we
use K-means, BIRCH, and Spectral Clustering to do
the clustering and combine their clustering results by
HBGF. After obtaining the first solution θ, we gener-
ate more solutions by making some moderate changes
to θ: 30% of the chromosomes (instances) randomly
chosen and changed clustering groups. The process is
shown in Figure 2.
Figure 1: Results of clustering with five groups and n chro-
mosomes (instances).
Figure 2: 30% of the instances are randomly chosen and
changed clustering groups.
3.3 Objective Function
The choice of the objective function will affect the
speed of convergence of the genetic algorithm and the
ability to find an optimal solution. In ECA-CE, we
use supervised classifiers to get the fitness of an in-
dividual and Figure 3 shows how ECA-CE employs
multiple supervised classifiers to get the individual’s
fitness. Instead of calculating the similarity between
features as in traditional clustering algorithms, the
objective function is treated as a supervised learning
task. The objective function pseudo-code is shown in
Algorithm 3. The calculation of the individual’s fit-
ness of ECA-CE is based on a single objective, which
makes it easier to calculate the individual’s fitness and
speeds up the convergence of the algorithm.
When using supervised classifiers to calculate the
fitness of an individual, the bias of a single classifier
can be reduced by having multiple supervised clas-
sifiers involved in the calculation at the same time.
In this paper, we choose three supervised classifiers.
Algorithm 3: Objective function: fitness.
Require: dataset D,individual chromosomes θ
1: X
train
,X
test
,Y
train
,Y
test
= train test split(D,θ);
2: res = 0;
3: for i = 1,...,c do: c is the number of
supervised classifiers
4: model
i
= C
i
.train(X
train
,Y
train
);
5: Y
pred
= model
i
.predict(X
test
);
6: res = res + f 1 score(Y
test
,Y
pred
);
7: end for
8: return res/c;
A certain number of training sets are chosen to train
each supervised classifier, and a test set is evaluated
to calculate the F1 score of each supervised classifier
on the test set and summed to find the mean value.
3.4 Genetic Algorithm Operators
a) Tournament selection: In each round of the tour-
nament operator (Blickle and Thiele, 1995), two or
more individuals are randomly selected from the pop-
ulation, and the individual with the greatest fitness be-
comes the parent.
b) Single-point crossover: In the single-point
crossover operator (Deb et al., 1995), a position on the
parent chromosome is chosen at random. This posi-
tion becomes the crossover point. As shown in Figure
4, at the crossover point of the parents’ chromosomes,
the left and right chromosomes are swapped with each
other to obtain two offsprings, each carrying the ge-
netic information of the parent’s generation.
c) Mutation operator: The mutation operation is
generally applied to an offspring produced using se-
lection and crossover operators. Because the mutation
operator (Das et al., 2009) generally compromises the
genetic information of the offspring, mutations usu-
ally occur with very low probability. As shown in
Figure 5, using the swap mutation operator, two chro-
mosomes are randomly selected and their values are
swapped.
4 EXPERIMENTAL SETUP
In this section, the traditional algorithmic hyperpa-
rameters and datasets required for the ECA-CE algo-
rithm are described in detail. All experiments were
done on a PC with an Intel Core i7 2.9GHz, 8-core
processor, 16GB, and the python programming lan-
guage.
ECA-CE: An Evolutionary Clustering Algorithm with Initial Population by Clustering Ensemble
135
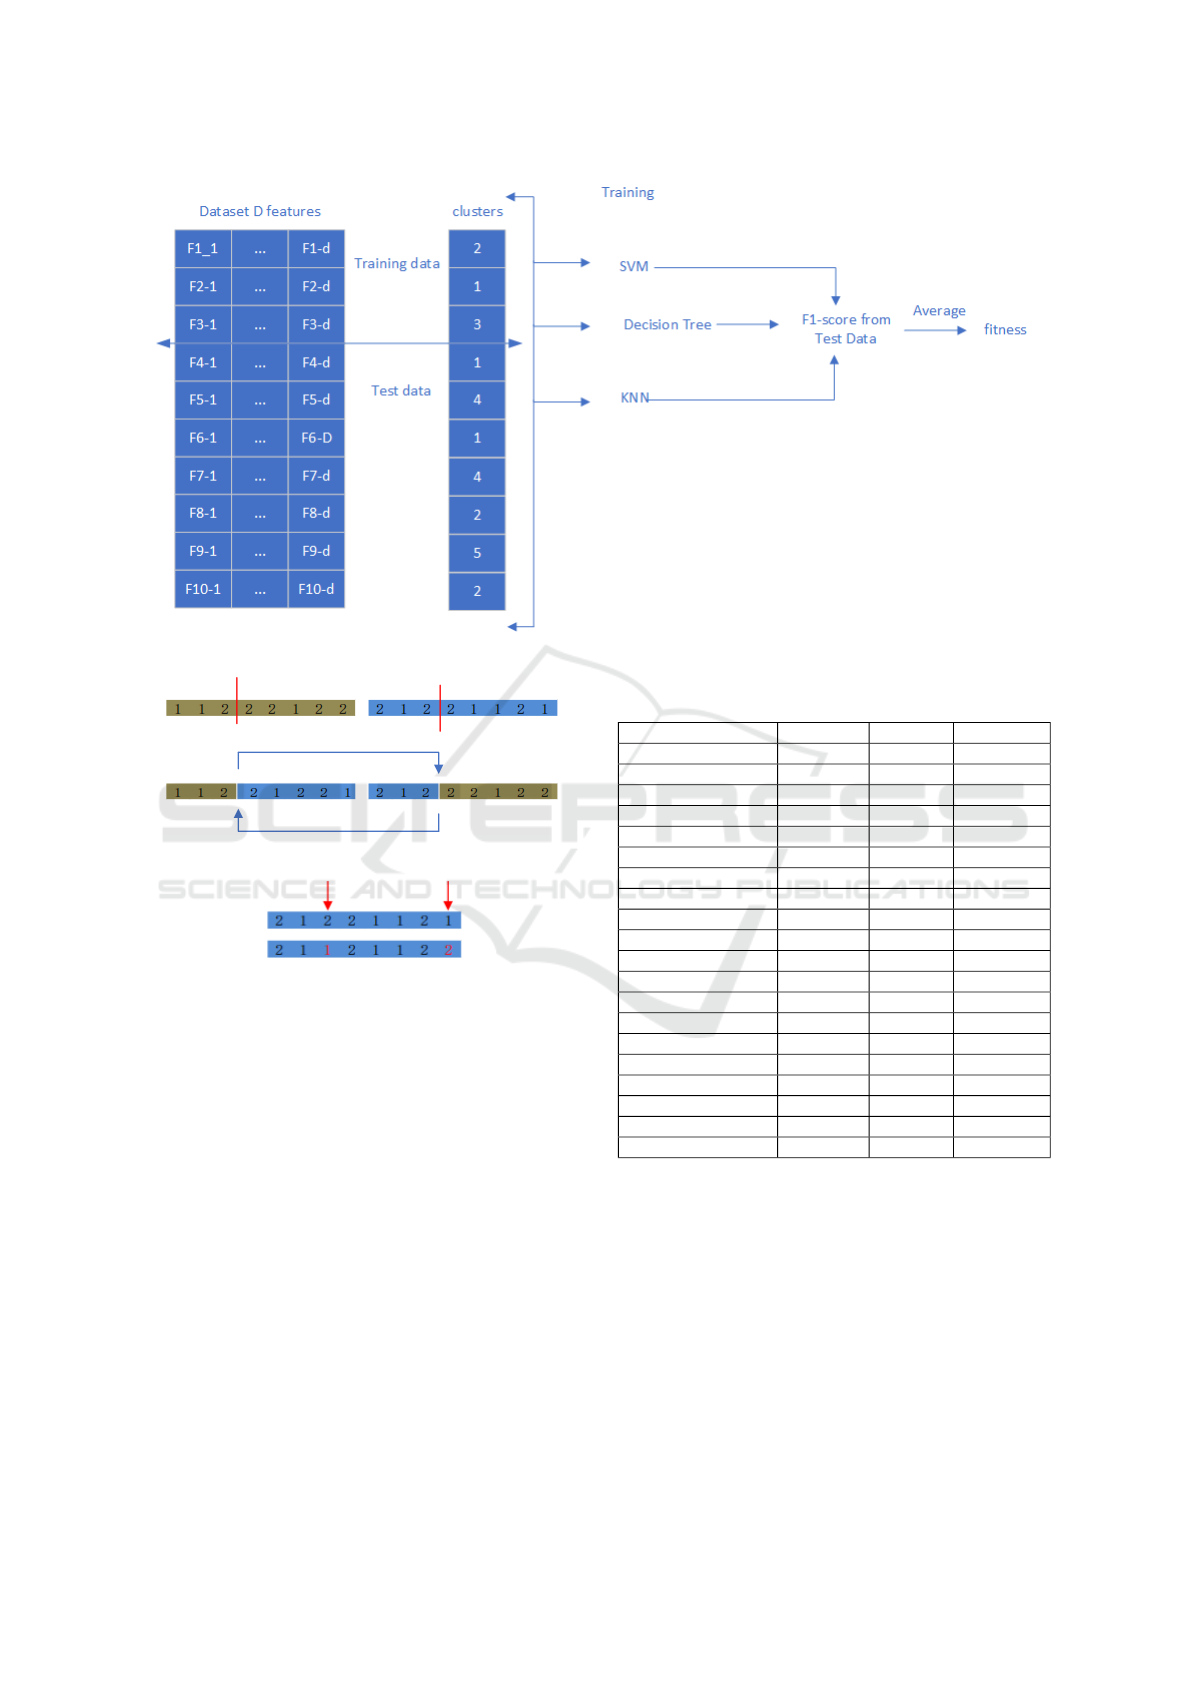
Figure 3: ECA-CE uses supervised classifiers to calculate the fitness of an individual.
Figure 4: Single point crossover operator.
Figure 5: Exchange mutation operator.
4.1 Datasets and Evaluation Metrics
For this experiment, we selected 20 datasets from the
UCI (Asuncion and Newman, 2007) and Fr
¨
anti and
Sieranoja’s Clustering Benchmark repository (Fr
¨
anti
and Sieranoja, 2018),(Gionis et al., 2007),(Chang and
Yeung, 2008),(Veenman et al., 2002),(Jain and Law,
2005). Table I shows the information of them.
All the datasets used are labelled, which are suit-
able for classification tasks. In this study, we use them
to test clustering algorithms. Therefore, we set the
number of clusters as the number of classes in each
dataset, then compare the similarity between a clus-
ter and its corresponding class. Adjusted RAND In-
dex(Steinley, 2004) is used for the comparison. The
larger the ARI value is, the better clustering result we
obtain.
Table 1: Information of the datasets used in experiment.
Dataset N. Features N. Classes N. Instances
aggregation 2 4 788
jain 2 2 373
pathbased 2 3 300
r15 2 15 600
spiral 2 3 312
breast-cancer-wisconsin 30 2 569
breast-tissue 9 6 106
dermatology 34 6 366
ecoli 7 8 336
forest 27 4 523
glass 9 6 214
iris 4 3 150
leaf 14 36 340
liver 5 16 345
parkinsons 22 2 195
seeds 7 3 210
segment 19 7 210
transfusion 4 2 748
wine 13 3 178
zoo 16 7 101
4.2 Hyperparameter Setting for all
Participating Algorithms
Apart from the proposed method, five other algo-
rithms F1-ECAC, ECAC, K-means, BIRCH, and
Spectral Clustering are also tested. Among them, F1-
ECAC and ECAC are recently proposed evolutionary
clustering algorithms and the rest are traditional clus-
tering algorithms. Each algorithm run 10 times and
its average performance is calculated for better reli-
able results. For each dataset, the number of clusters
ICAART 2023 - 15th International Conference on Agents and Artificial Intelligence
136

is set to be the number of categories.
a) Three evolutionary clustering methods ECA-
CE, F1-ECAC, and ECAC:
Both ECA-CE and F1-ECAC generate 200 indi-
viduals per iteration for 200 iterations, while ECAC
generates 20 individuals per iteration for a total of
2000 iterations. When initializing the ECA-CE popu-
lation, the hyperparameters of the traditional cluster-
ing algorithm are as follows:
K-means: the number of times the algorithm is run
for different values of the initialization of the center
points is 10.
BIRCH: the threshold for merging a new sub-
cluster with the closest sub-cluster is 0.5.
Spectral Clustering: Constructing similarity ma-
trices using RBF kernels.
For all three methods, the probability of crossover
is set to 95%, and the probability of chromosome mu-
tation is set to 5%. They use the same method for
evaluation.
b) Other traditional clustering algorithms
For K-means, the maximum number of iterations
is set to 300. The algorithm is run 10 times and
the average performance of them is calculated. For
BIRCH, the threshold for merging new sub-clusters
with the closest sub-clusters is set to 0.5 and the num-
ber of CF sub-clusters per node is set to 55. For Spec-
tral Clustering, similarity matrices are constructed by
RBF kernels.
4.3 Experimental Results
In this section we present the experimental results of
the experiment. Firstly, we look at the convergence
effect of the objective function of ECA-CE using two
different population initialization methods i.e., the
clustering ensemble algorithm initialized population
and the randomly initialized population. ECA-CE
searches the individual with the largest fitness in each
generation as the best clustering result in that genera-
tion. As shown in Figure 6, when using the aggrega-
tion dataset, the figure shows the maximum fitness of
the clustering ensemble initialization population and
random initialization population algorithms in each
iteration. When the initial population algorithm of
the clustering ensemble has about 100 iterations, the
fitness converges to 0.93. The evolutionary cluster-
ing algorithm using a random method to initialize the
population shows no sign of convergence in 200 iter-
ations, and the maximum fitness is 0.66 in the 200th
iteration. HBGF and Randomization: We compared
the quality of clustering results using different pop-
ulation initialization methods. As shown in Table 2,
HBGF initialization outperforms randomization ini-
Table 2: ARI values for random initialization and ensemble
clustering initialization of ECA-CE.
Dataset Randomization HBGF
aggregation 0.2597 0.6021
jain 0.2505 0.5525
pathbased 0.3100 0.4308
r15 0.5474 0.9899
spiral 0.0139 -0.0045
breast-cancer-wisconsin 0.0457 0.3441
breast-tissue 0.5058 0.5146
dermatology 0.0221 0.6230
ecoli 0.4569 0.4715
forest 0.0082 0.3088
glass 0.2703 0.3195
iris 0.8232 0.9242
leaf 0.4979 0.4875
liver 0.0804 0.0092
parkinsons 0.0549 0.1261
seeds 0.8277 0.8180
segment 0.6601 0.7550
transfusion 0.0522 0.0963
wine 0.8255 0.8485
zoo 0.1308 0.4442
Table 3: ARI for ECAC, F1-ECAC and ECA-CE.
Dataset ECAC F1-ECAC ECA-CE
aggregation 0.0403 0.2685 0.6021
jain 0.1022 0.3513 0.5525
pathbased 0.1070 0.2900 0.4308
r15 0.1406 0.5478 0.9899
spiral 0.0247 0.0134 -0.0045
breast-cancer-wisconsin 0.0134 0.0570 0.3441
breast-tissue 0.2778 0.5046 0.5146
dermatology 0.0235 0.0283 0.6230
ecoli 0.0899 0.4506 0.4715
forest 0.0049 0.0100 0.3088
glass 0.0863 0.2880 0.3195
iris 0.3776 0.9169 0.9242
leaf 0.3320 0.4993 0.4875
liver 0.0522 0.0880 0.0092
parkinsons 0.0275 0.0419 0.1261
seeds 0.2099 0.7763 0.8180
segment 0.2342 0.6777 0.7550
transfusion 0.0058 0.0542 0.0963
wine 0.1584 0.7577 0.8485
zoo 0.0599 0.1173 0.4442
tialization on 16 out of 20 datasets in terms of ARI,
which demonstrates the effectiveness of using a clus-
tering ensemble for population initialization.
Secondly, we compare the difference in cluster-
ing quality between ECA-CE and two other evolu-
tionary clustering algorithms, F1-ECAC, and ECAC.
The difference in clustering quality between ECA-CE
and other traditional clustering algorithms is also pre-
sented in Table 3. As shown in Table 3, ECA-CE is
doing better than ECAC on 18/20 datasets. Especially
on three datasets zoo, R15, and aggregation, the ARI
ECA-CE: An Evolutionary Clustering Algorithm with Initial Population by Clustering Ensemble
137
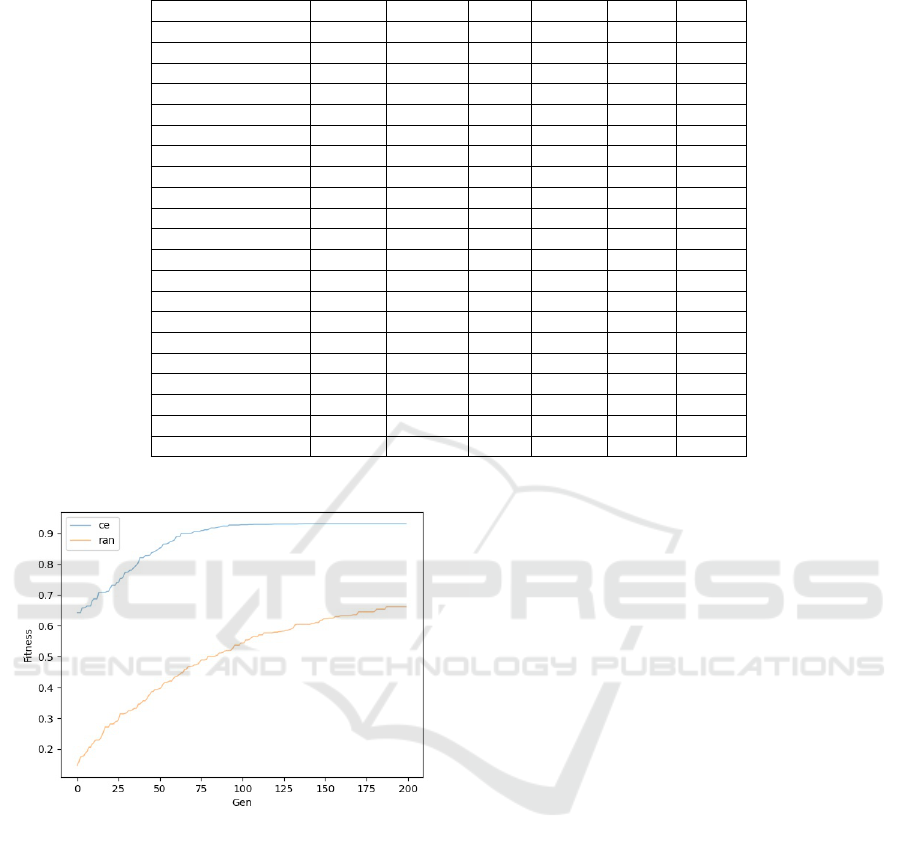
Table 4: ARI for ECA-CE and baseline algorithms.
Dataset ECA-CE F1-ECAC ECAC K-means BIRCH SC
aggregation 0.6021 0.2685 0.0403 0.7622 0.8133 0
jain 0.5525 0.3513 0.1022 0.3181 0.5146 -0.0436
pathbased 0.4308 0.2900 0.1070 0.4613 0.4847 0.0024
r15 0.9899 0.5478 0.1406 0.9928 0.9820 0.8942
spiral -0.0045 0.0134 0.0247 -0.0059 -0.0009 0.0125
breast-cancer-wisconsin 0.3441 0.0570 0.0134 0.4914 0.2872 0
breast-tissue 0.5146 0.5046 0.2778 0.0943 0.0943 0
dermatology 0.6230 0.0283 0.0235 0.0258 0.0342 0
ecoli 0.4715 0.4506 0.0899 0.4313 0.4858 0.0398
forest 0.3088 0.0100 0.0049 0.4987 0.4652 0
glass 0.3195 0.2880 0.0863 0.2702 0.2620 0.0125
iris 0.9242 0.9169 0.3776 0.7302 0.7312 0.2818
leaf 0.4875 0.4993 0.3320 0.2795 0.2885 0.0354
liver 0.0092 0.0880 0.0522 0.0176 0.0273 0
parkinsons 0.1261 0.0419 0.0275 0 0.0058 0
seeds 0.8180 0.7763 0.2099 0.7166 0.7132 0.0056
segment 0.7550 0.6777 0.2342 0.4061 0.4002 0
transfusion 0.0963 0.0542 0.0058 0.0795 0.0795 -0.0389
wine 0.8485 0.7577 0.1584 0.3711 0.3684 0
zoo 0.4442 0.1173 0.0599 0.7098 0.6451 0.00042
Average ranking 2.2 3.2 5.075 3.85 3.55 6.675
Figure 6: Random initialization and ensemble clustering
initialization fitness variation on the aggregation dataset.
of ECA-CE is twice as higher as that of ECAC. ECA-
CE is superior to F1-ECAC on 17 out of 20 datasets.
In Table 4, the ARI of ECA-CE, ECAC, F1-
ECAC, and the three traditional clustering algorithms
are shown for all tested datasets. ECA-CE is the best
in 10 of the 20 datasets, which is followed by K-
means with 4, BIRCH with 3, F1-ECAC with 2, and
ECAC with only 1.
4.4 Analysis of the Results
In Friedman’s test (Chatfield and Mander, 2009), the
lower the average ranking of the algorithm, the bet-
ter its average performance. The average ranking of
ECA-CE (2.2) over the 20 datasets is shown in Ta-
ble 4 to be lower than the other five algorithms, thus
demonstrating the superiority of ECA-CE over the
other algorithms on the experimental datasets.
5 SUMMARY
In this paper, we have proposed an evolutionary clus-
tering algorithm ECA-CE that uses a clustering en-
semble to initialize population and employs multiple
supervised classifiers to evaluate the fitness scores of
individuals. To ensure the diversity of the initial pop-
ulation, after using a clustering ensemble to obtain a
solution, 30% of chromosomes. Multiple supervised
classifiers are then used to jointly assess the fitness
of the generated individual when designing the objec-
tive function. Furthermore, it was experimentally ver-
ified that ECA-CE outperforms the two recently pro-
posed evolutionary clustering algorithms: F1-ECAC
and ECAC in terms of ARI.
In our future work, we would investigate the use
of other clustering ensemble methods to initialize the
population to ensure the generation of good genetic
parents. We also plan to apply ECA-CE to some more
practical clustering tasks.
REFERENCES
Asuncion, A. and Newman, D. (2007). UCI machine learn-
ing repository.
ICAART 2023 - 15th International Conference on Agents and Artificial Intelligence
138

Blickle, T. and Thiele, L. (1995). A mathematical analysis
of tournament selection. In International Conference
on Genetic Algorithms.
Caruana, R. and Niculescu-Mizil, A. (2006). An empiri-
cal comparison of supervised learning algorithms. In
Proceedings of the 23rd International Conference on
Machine Learning, pages 161–168.
Chang, H. and Yeung, D.-Y. (2008). Robust path-based
spectral clustering. Pattern Recognition, 41(1):191–
203.
Chatfield, M. and Mander, A. (2009). The skillings–mack
test (friedman test when there are missing data). The
Stata Journal, 9(2):299–305.
Das, S., Abraham, A., Chakraborty, U. K., and Konar, A.
(2009). Differential evolution using a neighborhood-
based mutation operator. IEEE Transactions on Evo-
lutionary Computation, 13(3):526–553.
Deb, K., Agrawal, R. B., et al. (1995). Simulated binary
crossover for continuous search space. Complex Sys-
tems, 9(2):115–148.
Ester, M., Kriegel, H.-P., Sander, J., and Xu, X. (1996).
A density-based algorithm for discovering clusters in
large spatial databases with noise. In Proceedings of
the Second International Conference on Knowledge
Discovery and Data Mining, KDD’96, page 226–231.
AAAI Press.
Fern, X. Z. and Brodley, C. E. (2004). Solving cluster en-
semble problems by bipartite graph partitioning. In
Proceedings of the Twenty-First International Confer-
ence on Machine Learning, page 36.
Fr
¨
anti, P. and Sieranoja, S. (2018). K-means properties
on six clustering benchmark datasets. Applied Intel-
ligence, 48(12):4743–4759.
Gionis, A., Mannila, H., and Tsaparas, P. (2007). Cluster-
ing aggregation. ACM Trans. Knowl. Discov. Data,
1(1):4–es.
Jain, A. K. and Law, M. H. (2005). Data clustering: A
user’s dilemma. In Pattern Recognition and Machine
Intelligence, pages 1–10. Springer.
Kang, Z., Guo, Z., Huang, S., Wang, S., Chen, W., Su, Y.,
and Xu, Z. (2019). Multiple partitions aligned clus-
tering. In Proceedings of the 28th International Joint
Conference on Artificial Intelligence, IJCAI’19, page
2701–2707. AAAI Press.
Karypis, G. and Kumar, V. (1998). A fast and high qual-
ity multilevel scheme for partitioning irregular graphs.
SIAM Journal on Scientific Computing, 20(1):359–
392.
Mardi, M. and Keyvanpour, M. R. (2021). Gbkm: A
new genetic based k-means clustering algorithm. In
2021 7th International Conference on Web Research
(ICWR), pages 222–226. IEEE.
Nielsen, F. (2016). Hierarchical clustering. In Introduction
to HPC with MPI for Data Science, pages 195–211.
Springer.
Sainz-Tinajero, B. M., Gutierrez-Rodriguez, A. E., Cebal-
los, H. G., and Cantu-Ortiz, F. J. (2021a). Evolution-
ary clustering algorithm using supervised classifiers.
In 2021 IEEE Congress on Evolutionary Computation
(CEC), pages 2039–2045. IEEE.
Sainz-Tinajero, B. M., Gutierrez-Rodriguez, A. E., Cebal-
los, H. G., and Cantu-Ortiz, F. J. (2021b). F1-ecac:
Enhanced evolutionary clustering using an ensemble
of supervised classifiers. IEEE Access, 9:134192–
134207.
Shi, J. and Malik, J. (2000). Normalized cuts and image
segmentation. IEEE Transactions on Pattern Analysis
and Machine Intelligence, 22(8):888–905.
Steinley, D. (2004). Properties of the hubert-arable adjusted
rand index. Psychological Methods, 9(3):386.
Veenman, C. J., Reinders, M. J. T., and Backer, E. (2002).
A maximum variance cluster algorithm. IEEE Trans-
actions on Pattern Analysis and Machine Intelligence,
24(9):1273–1280.
Von Luxburg, U. (2007). A tutorial on spectral clustering.
Statistics and Computing, 17(4):395–416.
Zhang, Y., Liu, H., and Deng, B. (2013). Evolutionary clus-
tering with DBSCAN. In 2013 Ninth International
Conference on Natural Computation (ICNC), pages
923–928.
ECA-CE: An Evolutionary Clustering Algorithm with Initial Population by Clustering Ensemble
139
