Identifying Visitor’s Paintings Appreciation for AI Audio Guide in
Museums
Mari Saito
1 a
, Takato Okudo
2,3 b
, Makoto Yamada
1 c
and Seiji Yamada
3,2 d
1
R&D Center, Sony Group Corporation, Tokyo, Japan
2
The Department of Informatics, The Graduate University for Advanced Studies (SOKENDAI), Tokyo, Japan
3
National Institute of Informatics, Tokyo, Japan
Keywords:
Appreciation of Paintings, AI Audio Guide, Machine Learning.
Abstract:
This paper describes an application of machine learning for predicting whether a user is engaged in art appre-
ciation to develop AI audio guide systems that can automatically control when guidance is provided. Although
many studies on intelligent audio guides in museums have been done, there are few that have tried to develop
AI audio guide systems that can begin to play audio guides automatically when visitors are engaged in art ap-
preciation. In this paper, we determine the timing at which to begin an audio guide by classifying two classes,
that is, whether the user is engaged in art appreciation or not, which is identified at the museum. We apply
supervised machine learning for time-series data to the classification. We conducted experiments with partic-
ipants in a real museum and collected labeled time-series data of participants heads’ postures and movements
as training data. Then, we applied a classification learning algorithm for time-series data to predict when
participants were involved in painting appreciation, executed model selection, and experimentally evaluated
the models with the collected data. Since the results showed a good accuracy of over 82%, we confirmed that
our machine learning-based approach to real-time identification of painting appreciation is promising for AI
audio guide systems.
1 INTRODUCTION
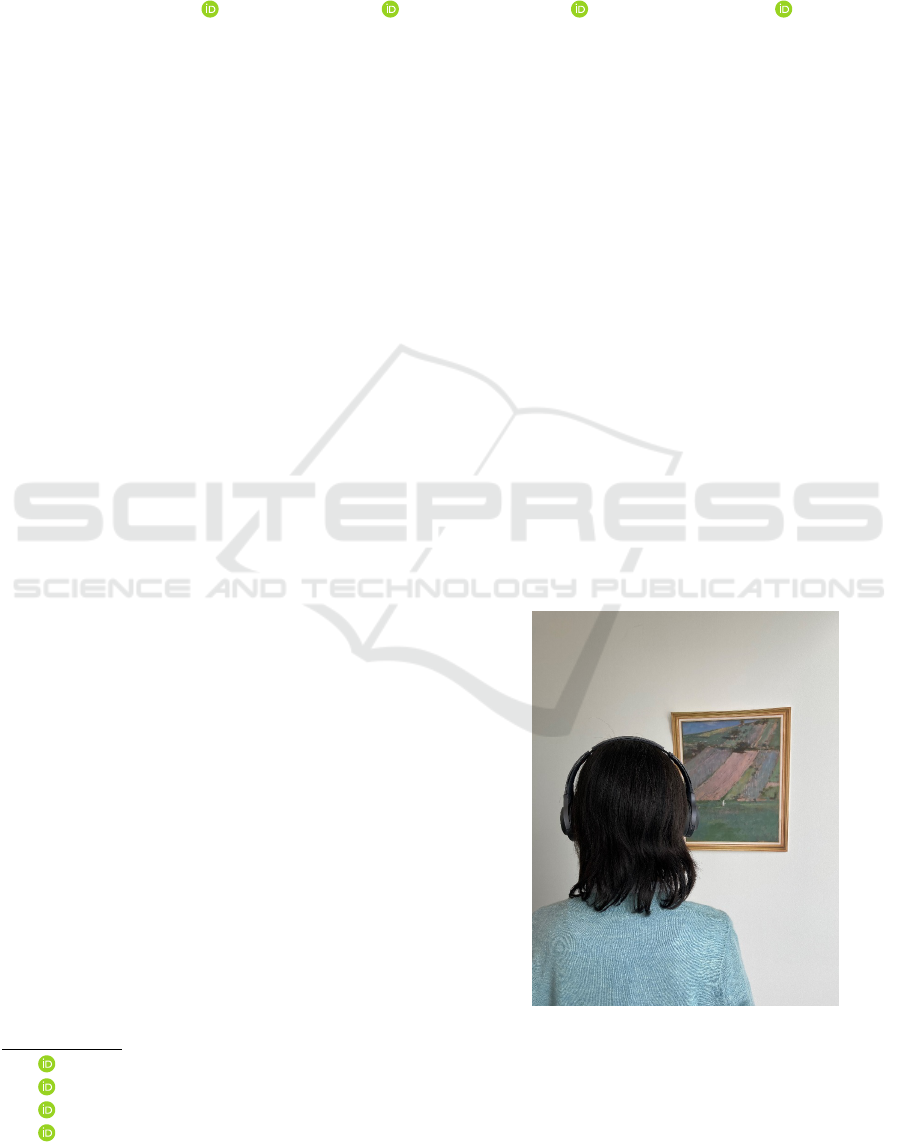
In recent years, many museums have introduced au-
dio guides (Figure 1). It is known that commen-
tary on artwork can enhance the quality of apprecia-
tion(Leder et al., 2006). However, there are individual
differences in the knowledge and tastes of art viewers.
There are guided tours in which art specialists guide
visitors through the museum, but in many cases, a sin-
gle expert gives uniform commentary to multiple vis-
itors. Ordering guides on an individual basis allows
them to be personalized as they can be done while in-
teracting with visitors, but it is difficult, both in terms
of personnel and cost, for everyone to hire a guide.
Therefore, it would be valuable if autonomous sys-
tems could provide personalized guides.
Larger museums rent audio guides to give infor-
mation on their works for a fee. Much of the guide
a
https://orcid.org/0000-0002-5366-9926
b
https://orcid.org/0000-0002-7218-7842
c
https://orcid.org/0000-0002-3204-4695
d
https://orcid.org/0000-0002-5907-7382
Figure 1: Appreciating painting with audio guide.
equipment is operated manually. Reading an instruc-
tion and understanding how to manually operate the
guide equipment, and an actual operation prevent vis-
itors from focusing on art appreciation. There are also
Saito, M., Okudo, T., Yamada, M. and Yamada, S.
Identifying Visitor’s Paintings Appreciation for AI Audio Guide in Museums.
DOI: 10.5220/0011621500003393
In Proceedings of the 15th International Conference on Agents and Artificial Intelligence (ICAART 2023) - Volume 2, pages 55-64
ISBN: 978-989-758-623-1; ISSN: 2184-433X
Copyright
c
2023 by SCITEPRESS – Science and Technology Publications, Lda. Under CC license (CC BY-NC-ND 4.0)
55

guides using QR codes, but the process is laborious in
the same way as manual operation. In recent years,
location-sensitive guides have also appeared. Out-
side, most of them use GPS for automatic playback,
but indoors, GPS is not accurate enough. Indoors,
many use BLE beacons. Some will give you infor-
mation based on the location of the visitor’s body.
However, we cannot determine if visitors are really
engaged in art appreciation on the basis of only loca-
tion data or body orientation. They may be conversing
with their companions, or they may not be able to see
the works.
In this paper, we propose a method for creating
a guide that is more tailored to the visitor’s status re-
garding art appreciation using common equipment in-
stead of special equipment. We propose an approach
to controlling the timing of guide presentation by es-
timating status of a visitor, that is, whether or not they
are engaged in art appreciation, based on the head-
movement values obtained with a sensor attached to
headphones. This allows for a guide that takes into ac-
count the cognitive status as well as the physical status
of location and orientation. Since headphone equip-
ment is required to listen to guide commentary, visi-
tors do not need to wear additional equipment. Thus,
this method places no additional cognitive load on the
user. Providing guidance in consideration of the visi-
tor’s status in addition to location can provide a more
personalized and value-added viewing experience.
We can summarize the original contributions of
this work below.
• We conducted experiments with participants in a
real art museum and collected time-series data of
head movements obtained from sensors equipped
to headphones. We used these data to evaluate the
algorithm for an AI audio guide.
• We developed an AI audio guide algorithm and
a method for identifying whether a human is en-
gaged in art appreciation with classification ma-
chine learning. Furthermore, we experimentally
evaluated the algorithm by using data collected
in a real environment and obtained promising re-
sults.
After this section, we discuss the position of this
paper among related research in Section 2. Section 3
describes the acquisition of data for determining the
status of visitors, that is, whether they are engaged
in art appreciation or not, and Section 4 proposes an
AI-driven guide system. In Section 5, we describe an
algorithm for predicting the status. In Section 6, we
discuss the results and future work, and we present
our conclusions in Section 7.
2 RELATED WORK
Art appreciation behavior has been studied mainly
in the areas of psychology and art (Leder et al.,
2004)(Yalowitz and Bronnenkant, 2009). In addition,
it can be said that individual differences in behavior
and taste affect appreciation because the movement
of the gaze varies according to one’s taste in paint-
ings (Castagnos et al., 2019), and there are several
patterns of movement in a museum (Zancanaro et al.,
2007). It is therefore necessary for guides to adapt
flexibly to individual differences in behavior and pref-
erences.
Appreciation behavior has been found to be influ-
enced by building or exhibition conditions and by oth-
ers (Castro et al., 2016)(Choi, 1999). Also, social be-
havior can only be found in real environments (Hor-
necker and Nicol, 2012)(Brieber et al., 2014). In other
words, it is important to measure appreciation behav-
ior in an actual environment, not in an experimental
one (Brown et al., 2011).
While some guide agents for paintings focus on
appearance and interaction, such as interacting with
users(Kopp et al., 2005), research is also progressing
on agents that provide guidance in accordance with
the state of the user as measurement devices continue
to evolve. Measurements of actual appreciation be-
havior include, for example, an approach that uses
Bluetooth devices to analyze position and behavior
patterns (Yoshimura et al., 2012) or that uses proxim-
ity sensors (Martella et al., 2017). Most approaches
use location information and do not estimate the ap-
preciation status. Even if the location is close to
the painting, you may be looking back or wandering
around to find the painting you want to view. In a dif-
ferent approach, automatic guidance is achieved by
detecting a painting in the image of a camera attached
to headphones, which indicates that the user’s face
is facing the direction of the painting (Vallez et al.,
2020). Again, it is impossible to determine whether
the viewer is currently engaged in appreciation.
The study of human behavior analysis has mainly
been on walking, and the major application is iden-
tifying people (Parietti and Asada, 2013)(Iwashita
et al., 2014). Since walking patterns differ depend-
ing on the individual, we can utilize them to identify
people. Most studies apply machine learning meth-
ods, especially classification learning, including neu-
ral networks and Gaussian kernel regression (Triloka
et al., 2016)(Li et al., 2018). As a result, although the
methods have disadvantages in that time and space
for walking are necessary for application in real en-
vironments, walking patterns are an effective human
property to identify a person. Currently, large datasets
ICAART 2023 - 15th International Conference on Agents and Artificial Intelligence
56
have also been prepared to foster competitive studies
based on common data sets (Ngo et al., 2014). How-
ever, none of these studies were concerned with iden-
tifying cognitive processes including appreciation of
paintings. Furthermore, there are few studies in which
human behaviors, especially head movements, have
been utilized to identify painting appreciation. Thus,
the unique contribution of this paper is cognitive state
estimation by machine learning.
Study on time series analysis has been widespread
in various domains including stock forecasting and
earthquake prediction (Xu et al., 2020)(Le et al.,
2018). Large numbers of methods including deep
learning, recurrent networks, text mining, and logi-
cal approaches with knowledge have been applied to
time series analysis. Also, excellent summaries and
reviews on time series analysis algorithms like (Bag-
nall et al., 2016) have recently been reported. In
this paper, identification of painting appreciation
is considered to involve time series analysis, so
we applied promising algorithms evaluated in (Bag-
nall et al., 2016) including Ridge regression with
ROCKET (Dempster et al., 2020) as a feature engi-
neering method, and time series random forest (Deng
et al., 2013). These algorithms have an advantage in
that learning is quite quicker than deep learning al-
gorithms like LSTM (Gers et al., 2000) and Trans-
former (Vaswani et al., 2017) even though their per-
formances are not significantly different from each
other.
3 DATA COLLECTION
3.1 Methods
Data collection was conducted in the National Mu-
seum of Western Art
1
on June 8 and June 30 in 2022
during the opening hours when other visitors were
also present. The museum exhibits Western paintings
from the end of the Middle Ages to the beginning of
the 20th century and French modern sculptures with
a focus on Rodin in the main building, new building,
and front yard throughout the year.
Sixteen adult participants. There were 12 men
and 4 women, ranging in age from their 20s to 60s.
In addition, nine participants had visited an art mu-
seum within a year, seven had visited one before, and
none had ever been to an art museum. There were 11
participants who had experience using museum audio
guides.
1
https://www.nmwa.go.jp/en/
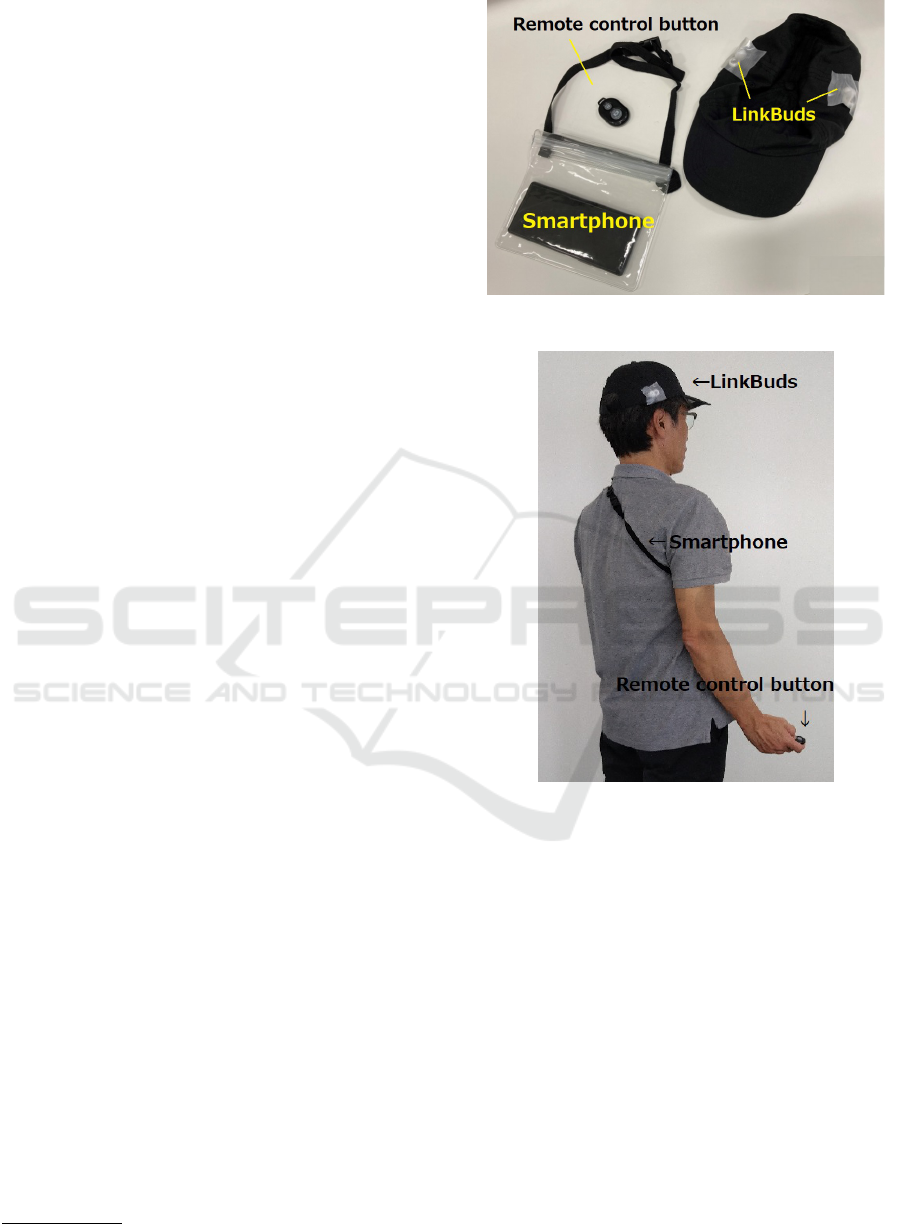
Figure 2: Equipment for data collection.
Figure 3: Participants wearing data collection equipment.
Figure 2 shows the equipment used for data col-
lection. The participants wore hats with headphones
and had a button for input (Figure 3). They were in-
structed to push the button to mark the beginning and
end of painting appreciation while viewing paintings
as usual. To avoid wrong inputs, they were instructed
to press the button twice at the beginning and four
times at the end of each painting. Since participants
used a single button for input, and the number of in-
puts was different between the start and finish, head
movement was not affected because they did not have
to look at their hands for input (Figure 4). After the
data collection, the participants were asked to com-
plete a questionnaire on how often they visited muse-
ums and their experience using audio guides.
We chose two rooms, exhibit room 9 and exhibit
room 11, from all the permanent exhibition rooms at
the museum as data collection sites. Room 9 was lo-
Identifying Visitor’s Paintings Appreciation for AI Audio Guide in Museums
57
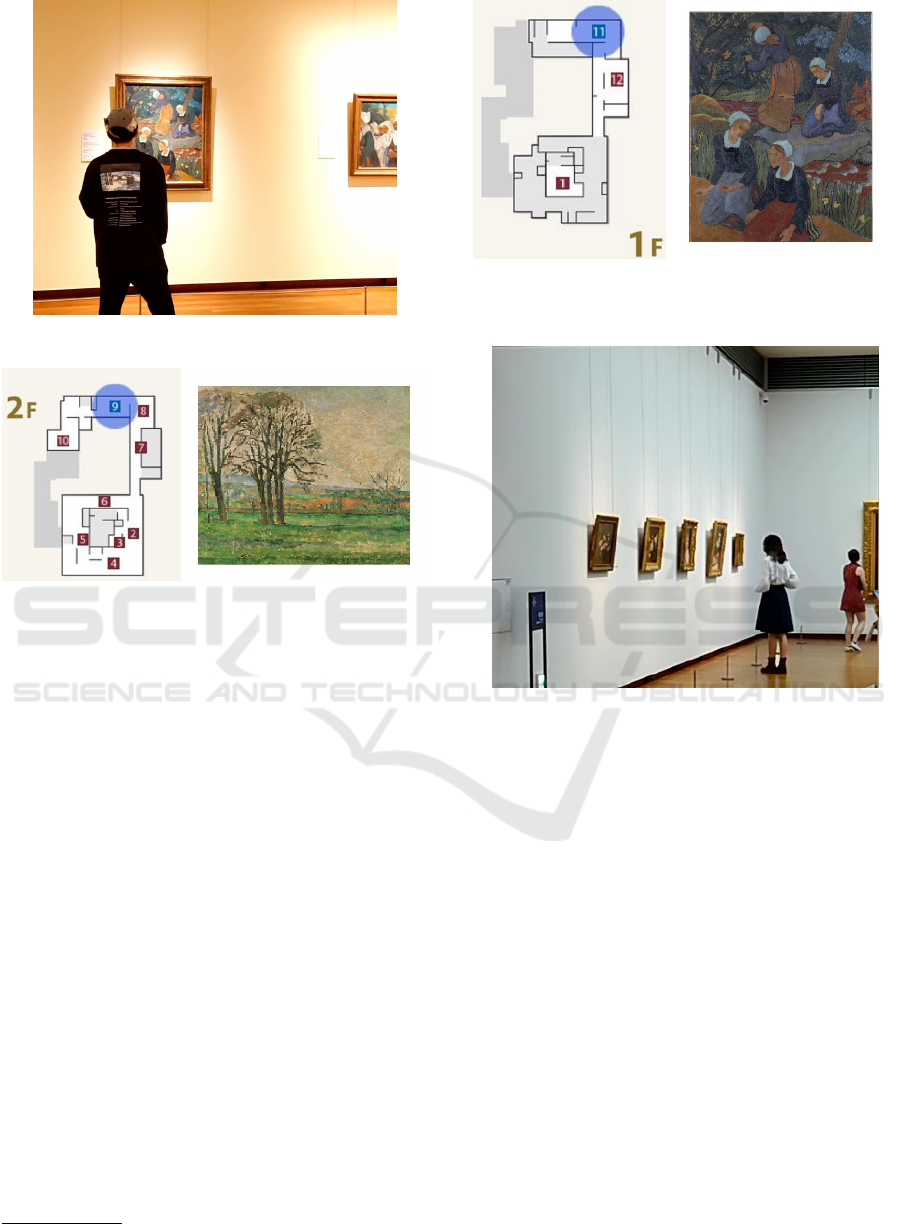
Figure 4: Participant during data collection in Room 11.
Figure 5: Map of Room 9 (left) and example painting in
Room 9 (right) : ”Four Breton Girls in the Forest(Quatre
jeunes bretonnes dans la for
ˆ
et)” by Paul S
´
erusier.
cated on the second floor (Figure 5 and Room 11 was
located on the first floor (Figure 6)
2
. Because both
rooms display paintings from relatively popular peri-
ods, it was predicted that there would be many paint-
ings that participants would like to view. Rooms 9 and
11 are almost the same size and shape, with 16 and
30 paintings, respectively, on display. Since it was
a weekday afternoon, the museum was not crowded,
but there were always about 10 to 15 visitors per room
(Figure 7).
3.2 Sensor Devices
The Sony LinkBuds headphones used to acquire the
data have a measured length of about 27 mm (the size
of the driver unit is 12 mm) and weigh 4.1 g on each
side. They take in external sounds and can be con-
nected to a smartphone via Bluetooth to listen to mu-
sic (Figure 8). They also feature a wide area that al-
lows you to tap the side of your face around your ears
(this tapping data is not used as a feature), as well as
the earphone itself, so you can operate it comfortably
even though it is small. The earphones have a three-
2
Photo: NMWA/DNPartcom
Figure 6: Map of Room 11 (left) and example painting in
Room 11(right) : The Bare Trees at Jas de Bouffan” by Paul
C
´
ezanne.
Figure 7: View of Exhibition Room 9.
axis accelerometer, a three-axis gyro sensor, and a
three-axis geomagnetic sensor, and they can take each
piece of data at a sampling rate of 25 Hz and send it
to a smartphone.
As result, these nine kinds of sensed data are input
to machine learning as nine-dimensional time-series
data.
Generally, museum audio guides provide dedi-
cated equipment for the guides, so the cost on the
provider side is an issue. In recent years, services for
playing guide content on a visitor’s smartphone have
emerged, and an additional guide agent function, as
proposed in this article, can be provided to visitors
who bring such sensor-equipped earphones.
For input on viewing states, we used a device that
remotely controls the shutter of the smartphone cam-
era via Bluetooth. Both the sensor values of the head-
phones and the participant’s input were recorded by
the smartphone.
ICAART 2023 - 15th International Conference on Agents and Artificial Intelligence
58

Figure 8: Headphone with sensor: Sony LinkBuds.
3.3 Data Properties
Participants spent an average of 9.08 minutes in Ex-
hibit Room 9 (SD 4.21) and 10.40 minutes in Room
11 (SD 3.40). The viewing time varied greatly among
individuals, with a minimum of 4.0 minutes and a
maximum of 18.0 minutes in Room 9, and a mini-
mum of 6.0 minutes and a maximum of 17.0 minutes
in Room 11.
The average time for each painting was 41.2 sec-
onds (SD 42.5), with a minimum value of 0.6 sec-
onds and a maximum value of 355.3 seconds. The ra-
tio of appreciating time to non-appreciating time was
1.23:1.
4 AI AUDIO GUIDE SYSTEMS
In this paper, we develop an AI audio guide system
that can automatically begin to play an audio guide
when a user begins appreciating paintings. For this
target, we needed to develop a system that can iden-
tify when a user begins to engage in painting ap-
preciation on the basis of time-series data sensed by
LinkBuds. We developed a method for identifying
this by using an algorithm that predicts when a user
begins with AI machine learning. In the next Sec-
tion 5, details will be given. The main procedure of
AI audio guide systems are to identify appreciation
based on the prediction of appreciation by classifica-
tion learning.
4.1 Algorithm of AI Audio Guide
An overview of the AI audio guide algorithm is de-
scribed in Figure 9, and the functions and variables
are explained below. Also, other methods and func-
tions are based on Python.
• λ: A threshold for the ratio of appreciation state
“1” in a data sequence. The appropriate value of
this input will be investigated in Section 5.2.
• η: A threshold for the ratio of non-appreciation
state “0” in a data sequence. The appropriate
value of this input is set to 0.8 in this paper.
• w: The width of a window that will be used in
Section 5.2.
ai audio guide(λ, η, w, l)
1 while term f lag = 0
2 s = []
3 while len(s) < w
1
4 s = s.append(predict app(l))
5 while (1− appr ratio(s)) ≤ η
6 s = s.append(predict app(l))
7 s = s.pop(0)
8 while appr ratio(s) < λ ∥manual f lag = 1
9 s = s.append(predict app(l))
10 s = s.pop(0)
11 play guide()
Figure 9: AI audio guide algorithm.
• l: The length of an input data sequence that will
be used as input data to predict app(l) described
in Section 5.2.
• play guide() begins to play the correct audio
guide if the last audio guide is still playing.
• predict app() obtains the next piece of data
sensed by LinkBuds, applies learning model to it,
and returns the predicted results {1: appreciation,
0: non-appreciation}. The learning model will be
learned in Section 5.
• appr r atio(s) returns the ratio of “1”s in data se-
quence s.
• term f lag becomes “1” when the entire experi-
ment finishes, otherwise it is “0.”
• manual f lag becomes “1” when a play button is
pushed, otherwise “0.”
Below is an intuitive explanation of the algorithm
in Figure 9. First, terminate f lag is checked, and the
whole loop begins (l. 1). Then, a data sequence with
a width w is built (l. 3-4), and a non-appreciation in a
data sequence is built (l. 5-7). After that, the system
checks whether the user is engaged in appreciation at
the beginning of a data sequence and plays an audio
guide if this is identified (l. 8-11).
Note that the interrupt of manual f lag is checked
in this loop (while’s second condition manual f lag =
1 at l. 8). A user can make this manual f lag “1” by
hitting the play button and can play the corresponding
audio guide anytime using this AI audio guide system.
This function is important to assist the AI audio guide
system when it fails to identify engagement in appre-
ciation correctly.
Identifying Visitor’s Paintings Appreciation for AI Audio Guide in Museums
59
5 PREDICTION OF
APPRECIATION FOR AI AUDIO
GUIDE
In this paper, the machine learning model classifies
whether a user is engaged in appreciation or not, and
the system then plays the audio guide if the model
outputs that the user is engaged in appreciation. We
had a time-series data set acquired from the sensors in
the headphones. Therefore, we solved the time series
classification for the AI audio guide system.
5.1 Time-Series Prediction as
Classification Learning
We developed a function, predict app(l), as seen in
Figure 9 that can predict whether a user is engaged in
appreciation at the next time step on the basis of the
last sequence of data sensed by LinkBuds. The func-
tion acquires sensed data with a length of l when it
is called. The typical approach to predicting the next
binary state (e.g., appreciation or non-appreciation) is
to apply 2-class classification learning algorithms to
the last data sequence. In this approach, the predicted
class stands for the predicted status at the next step.
We assume discrete time steps and time-series data.
We aim to play the audio guide at the moment that the
user starts viewing art. The system decides whether
to play the audio guide or not after the model per-
forms classification. The model must predict whether
the user will be engaged in art appreciation at the
next step, or the starting of the audio guide may be
delayed. Therefore, we use a model that classifies
whether the user will be engaged in appreciation at the
next step on the basis of the last sequence of sensed
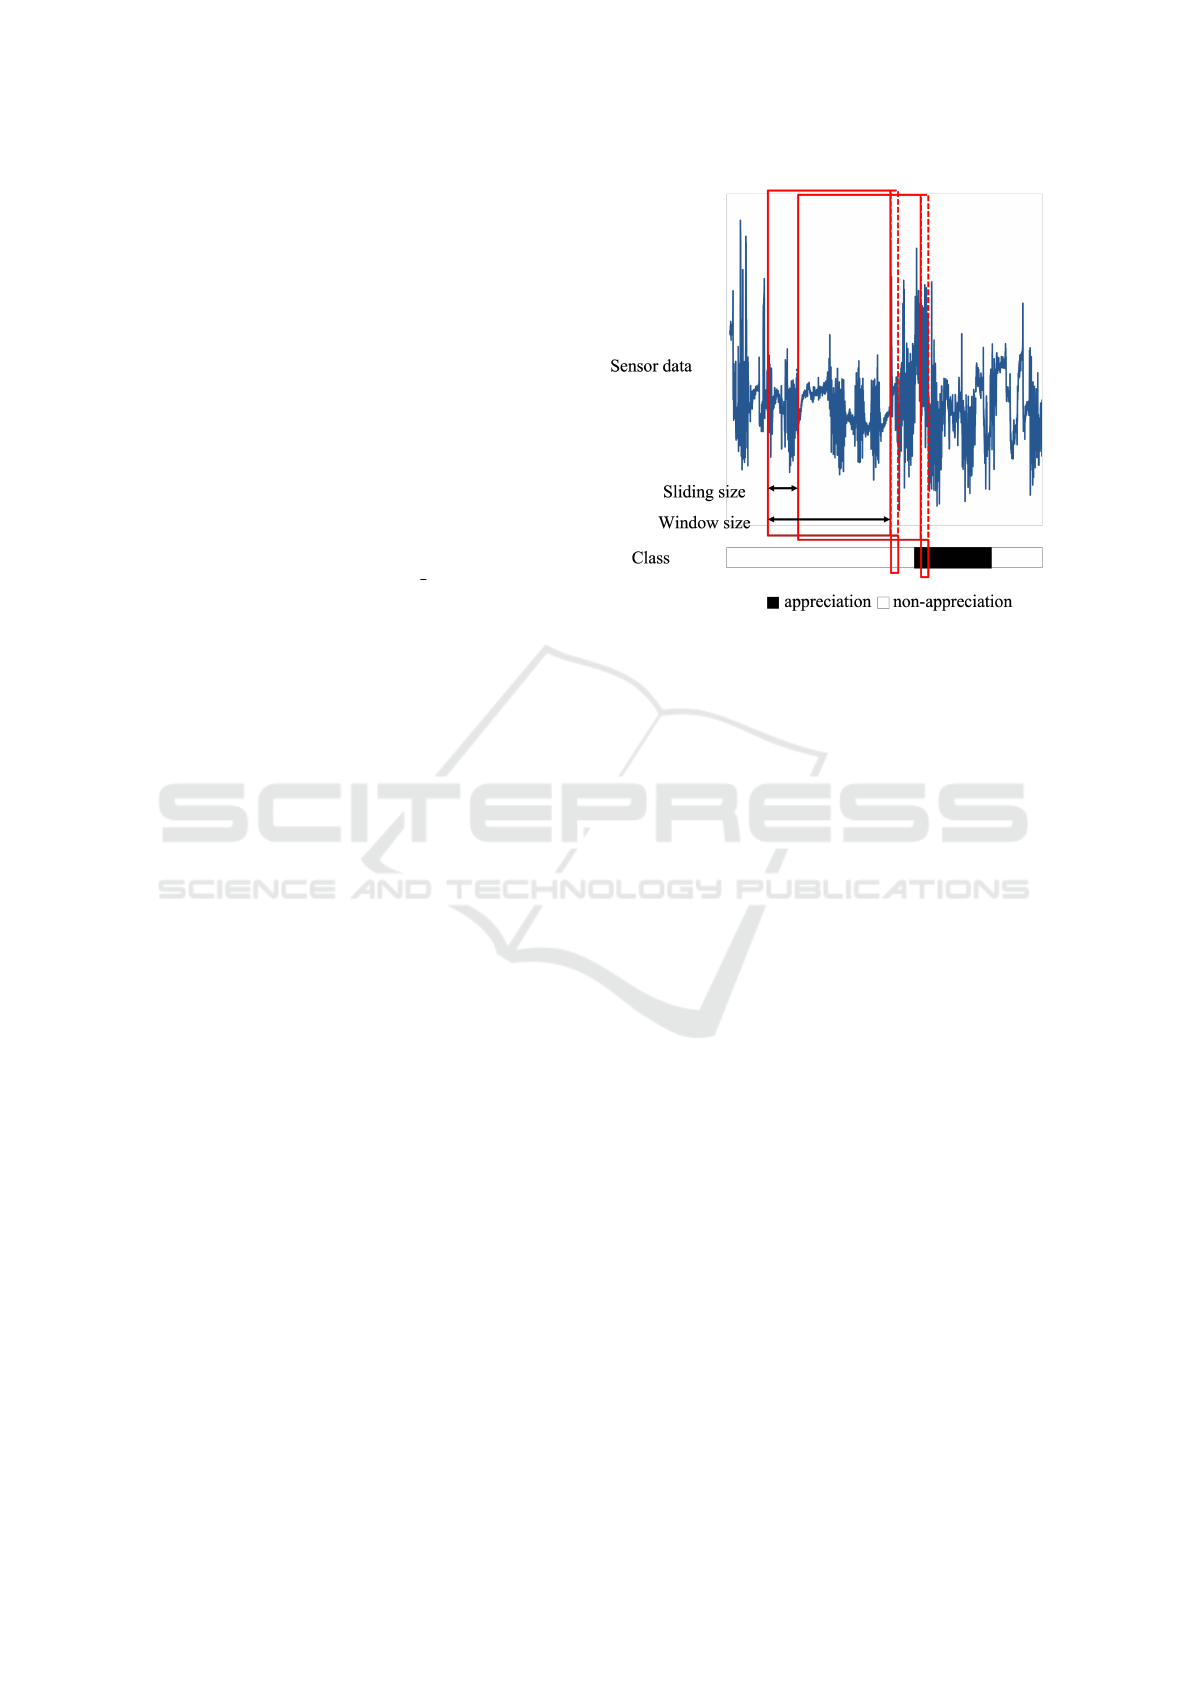
data as input. Figure 10 shows the time series classi-
fication for the AI audio guide system.
The sliding size controls the sliding window in
steps. The classification model uses the time series
sensor data in steps of the window size. The pa-
rameters are predefined by the model designer. Each
time series classification is formally written as equa-
tion (1).
y
t=sτ
= f (x
t−σ
, ..., x
t−1
) (1)
where t, τ, s, and σ are a step, a counting value for
classification, the sliding size, and the window size,
respectively. f is a single model or a pipeline of mul-
tiple components for time series classification. x
t
is a
vector of sensor data at a single step, and y
t=sτ
is posi-
tive or negative indicating whether the user is viewing
art or not. t is a multiple of s since τ increases from
zero by one.
Figure 10: Time series classification for AI audio guide sys-
tem. Data in red lines is used for training. User engaged in
art appreciation in steps shown by black area.
There are various 2-class classification learning
algorithms from convolutional neural networks (Le-
cun et al., 1998) to decision tree-based ensemble
learning (Chen and Guestrin, 2016). Also, they have
very wide ranges in terms of both of learning effi-
ciency and performance of classification. We care-
fully investigated classification algorithms based on
an excellent research survey in which they were ex-
perimentally compared from various aspects (Bagnall
et al., 2016). As a result, we adopted Ridge regression
with ROCKET (Dempster et al., 2020) as a feature en-
gineering method for its efficiency and classification
performance.
5.2 Implementation Details
We used Ridge regression implemented in scikit-
learn (Pedregosa et al., 2011) and ROCKET im-
plemented in sk-time, which is a unified framework
for machine learning with time series (L
¨
oning et al.,
2019). We transformed the raw time-series sensor
data of each user into several pieces of input data for
the model with a window size σ and sliding size s, and
we attached ground truth labels indicating whether a
user will engage in art appreciation to the input data.
All the experiments were conducted with a PC
[AMD Ryzen 9 5950X, 16 cores (3.4 GHz), 128 GB
of memory]. The window size σ and sliding size s
were set to 100 (5 seconds) and 5 (0.25 seconds), re-
spectively. These were almost the minimal values for
learning the classification model with our hardware.
When lower values were set, memory errors occurred
ICAART 2023 - 15th International Conference on Agents and Artificial Intelligence
60

Table 1: Classification results by cross-validation.
Accuracy Precision Recall
0.820 0.820 0.846
during learning. The regularization strength of the
ridge regression was 0.1 chosen by grid search. The
search space consisted of ten points sampled from the
range from -0.001 to 0.001.
5.3 Model Evaluation
We evaluate both the classification performance and
the identification performance in this section.
5.3.1 Classification Performance
Accuracy, precision, and recall were calculated as the
classification performance by cross-validation. They
are general metrics of classification performance.
Since the dataset acquired from sixteen users was not
much large, we only cross-validated the full dataset
without a train-test split. The strategy of cross-
validation was K-Fold with shuffled samples. Since
the dataset was balanced between two classes (61,039
for positive and 54,437 for negative in the entire
dataset), the accuracy was suitable. Table 1 shows
the classification results by cross-validation.
The learned model could classify whether the user
would be engaged in art appreciation or not with an
accuracy of 82.0%. The model provided correct pre-
dictions of positive labels by 82.0%, and they covered
84.6% of all positive labels.
5.3.2 Performance of Appreciation Identification
The system identifies when a user is engaged in appre-
ciation from the multiple outputs of the classification
model with size m. The classification performance
of 5.3 cannot be used to identify engagement in art
appreciation correctly. We must take into considera-
tion the margin for gathering the outputs of the clas-
sification model. We transformed the labels predicted
by the classification model into an identification label
as shown in equations (2).
z
k
=
(
1 (
∑
m
j=1
y
t+ j
#
{
y
t+1
,...,y
t+m
}
≥ λ )
0 (otherwise )
(2)
The identification label is “1” if the positive out-
put accounts for the threshold ratio λ in the set of la-
bels {y
t
, ...y
t+m
} predicted by the classification model
within the margin of the size m, and it is “0” other-
wise. We calculated the classification metrics with Z,
which is the set of z. The margin size was set to 60 (3
seconds), so it was much shorter than the average time
spent on art appreciation, 41.3 seconds. We did a grid
search in {0.2, 0.5, 0.8} to find the best threshold ra-
tio. Figure 11 shows the result of identification be-
tween threshold ratios.
The best threshold ratio was 0.2 in terms of f1
score. The f1 score was 0.865. A bigger threshold ra-
tio increased the precision, but it decreased the recall.
The accuracy of the best threshold ratio was 0.865.
6 DISCUSSION
6.1 Accuracy of Identifying Art
Appreciation
The accuracy of distinguishing between the statuses
of appreciating and non-appreciating was over 80%,
so the status could be estimated. However, from the
point of view of controlling the playback timing of
the guide, the accuracy of starting at a time when
the probability of being engaged in art appreciation
is higher (more than 50%) was just over 60%, which
is not good enough.
Therefore, preliminary actions such as alarm
sounds and background music should be performed,
and interactions such as canceling or posing should be
assumed when the status indicates that the user is not
engaged in art appreciation. In this case, it is impor-
tant to combine the identification of status with sim-
ple controls, but there are headphones that can handle
touch or head gestures, for example. The recall was
about 80% when starting with a roughly 20% chance
of being engaged in art appreciation, so the combi-
nation of guide presentation and simple controls may
enable optimal operation.
For this purpose, we introduced manual control
procession in the AI audio guide algorithm (Figure 9,
l. 11-12). However, the interrupt processing is not
smart. We will develop a practical method that com-
bines automatic playing of audio guides with such in-
teractive operations as well as location-sensitive in-
formation.
6.2 Variation in Types of Appreciation
In this paper, we dealt with art appreciation, that is,
looking at pictures in an art museum. However, there
are many types of art appreciation, including listen-
ing to music, seeing movies, and touching pottery. We
consider the art appreciation in this paper to be signif-
icantly dependent on looking at pictures in a museum,
so hardly apply the classifiers to other types of art ap-
preciation like seeing movies and touching pottery.
Identifying Visitor’s Paintings Appreciation for AI Audio Guide in Museums
61
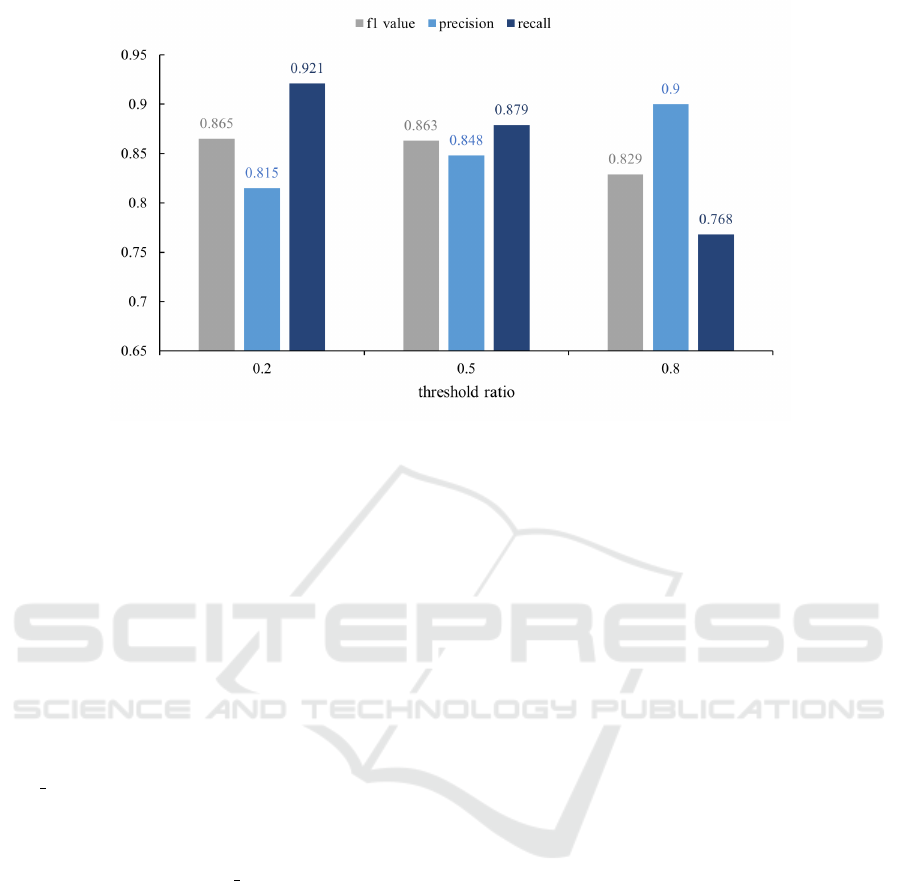
Figure 11: Results of identification between threshold ratios.
However, we think that we can apply the classi-
fiers in a museum like a natural history museum and
science museum because they mainly involve looking
at exhibits. Also, the AI audio guide system algo-
rithm (Figure 9) might be applicable to other different
appreciations.
6.3 Implementation of AI Audio Guide
Systems and Experimental
Evaluation
In this paper, we developed a core part of the algo-
rithm for an AI audio guide system in Section 4 except
play guide(), implemented learning models to predict
the status of art appreciation, and evaluated the mod-
els in Section 5. Unfortunately, the whole system has
not been implemented yet. We plan to implement the
whole system including play guide() on a mobile de-
vice like a smartphone and conduct experiments with
participants to evaluate it in a real environment. For
the evaluation, we need to prepare adequate question-
naires to evaluate both the quality of the appreciation
and the cognitive load from using the system (Mon-
fort et al., 2017).
We think there might be a few difficult technical
problems in implementing the AI audio guide system
because the main sub-systems for appreciation identi-
fication including the prediction of appreciation were
already developed and evaluated in Section 5. How-
ever, we need to make the system more compact, in-
crease the usability, and enrich the user experience.
To enrich the user experience, we plan to in-
troduce a speech-based virtual agent like a smart
speaker (Bentley et al., 2018) to the system. By in-
creasing the agent’s familiarity and enriching speech-
based emotional expressions, the user experience will
be richer.
6.4 Improving Identification by
Behavior Patterns
Since the prediction accuracy might not be sufficient
for AI audio guide systems, we should investigate
additional methods of improving the performance.
For example, a straightforward approach would be
to search for better hyperparameters including the
weight of a regularization term by grid search or
Bayesian search.
Also, we could use another method to utilize
clusters of visitors’ behavior patterns. In studies
on human behaviors in art museums, some rep-
resentative patterns such as ANT-like, FISH-like,
GRASSHOPPER-like, and BUTTERFLY-like pat-
terns have been extracted (Zancanaro et al., 2007). If
we can identify a visitor’s behavior patterns through
a simple interview for user-profiling with a few ques-
tions before using an AI audio guide system, we can
use more specific and better prediction models for be-
havior patterns to improve the performance. For ex-
ample, a previous work (Liu et al., 2021) took this
approach to improve classification.
6.5 Applications for Guiding in Events,
Sightseeing
We believe that this the framework for identifying
whether someone is engaged in art appreciation can
be applied not only to AI audio guide systems but
ICAART 2023 - 15th International Conference on Agents and Artificial Intelligence
62

also to various indoor and outdoor events, AI guide
systems for sightseeing, and so on because the basic
method of the algorithm in Figure 9 can be applied
to identifying cognitive processes including apprecia-
tion, attention and focusing with head movement data.
We believe that this AI audio system can be used
for sightseeing outdoors because it needs only head-
movement data, not visual data from a camera. Al-
though a camera can acquire very rich visual data, it
requires various strict conditions on lighting, camera
shaking, and so on. In fact, Microsoft launched the
Soundscape
3
service, which gives directions to sight-
seeing targets through LinkBuds.
Of course, only partial cognitive processes can be
detected from head-movement data; thus, we need to
change sensor devices and which parts of the human
body should be sensed depending on the cognitive
process. In future work, we will investigate which
kinds of sensors are suitable for identifying a target
cognitive process.
7 CONCLUSION
In this paper, we developed an algorithm for AI au-
dio guide systems that can automatically begin to
play an audio guide by identifying whether the user
is engaged in art appreciation from time-series data
of head movements. To predict whether a user is en-
gaged in appreciation in order to identify it in the fu-
ture, we applied machine learning to classify whether
the user status was appreciation or non-appreciation
from time-series data. First, we conducted experi-
ments with participants in a real museum and col-
lected labeled time-series data of their head pos-
tures and movements as training data. Then, we ap-
plied a classification learning algorithm for the time-
series data to predict whether they were engaged in
painting appreciation and experimentally evaluated
them. Since the results showed good accuracy of over
82%, we confirmed that our machine learning-based
approach to real-time identification of painting ap-
preciation is promising for AI audio guide systems.
By combining this proposal with location-sensitive
guides, which have been gaining attention in recent
years, we can create guides that incorporate not only
positional statuses but also cognitive statuses.
3
https://www.microsoft.com/en-us/research/product/
soundscape/linkbuds/
ACKNOWLEDGEMENTS
This work was partially supported by JST, CREST
(JPMJCR21D4), Japan.
REFERENCES
Bagnall, A., Lines, J., Bostrom, A., Large, J., and Keogh,
E. (2016). The great time series classification bake
off: a review and experimental evaluation of recent
algorithmic advances. Data Mining and Knowledge
Discovery, 31(3):606–660.
Bentley, F., Luvogt, C., Silverman, M., Wirasinghe, R.,
White, B., and Lottridge, D. (2018). Understanding
the long-term use of smart speaker assistants. Pro-
ceedings of the ACM on Interactive, Mobile, Wearable
and Ubiquitous Technologies, 2(3):1–24.
Brieber, D., Nadal, M., Leder, H., and Rosenberg, R.
(2014). Art in time and space: Context modulates
the relation between art experience and viewing time.
PLoS ONE, 9(6):e99019.
Brown, B., Reeves, S., and Sherwood, S. (2011). Into the
wild: challenges and opportunities for field trial meth-
ods. In Proceedings of the SIGCHI Conference on Hu-
man Factors in Computing Systems (CHI’11), pages
1657–1666.
Castagnos, S., Marchal, F., Bertrand, A., Colle, M., and
Mahmoudi, D. (2019). Inferring art preferences from
gaze exploration in a museum. In Proceedings of the
27th Conference on User Modeling, Adaptation and
Personalization (UMAP’19), pages 425–430.
Castro, Y., Botella, J., and Asensio, M. (2016). Re-
paying attention to visitor behavior: A re-analysis us-
ing meta-analytic techniques. The Spanish Journal of
Psychology, 19:E39.
Chen, T. and Guestrin, C. (2016). XGBoost: A scalable
tree boosting system. In Proceedings of the 22nd
ACM SIGKDD International Conference on Knowl-
edge Discovery and Data Mining (KDD’16), pages
785–794.
Choi, Y. K. (1999). The morphology of exploration and
encounter in museum layouts. Environment and Plan-
ning B: Planning and Design, 26(2):241–250.
Dempster, A., Petitjean, F., and Webb, G. I. (2020).
ROCKET: exceptionally fast and accurate time se-
ries classification using random convolutional kernels.
Data Mining and Knowledge Discovery, 34(5):1454–
1495.
Deng, H., Runger, G., Tuv, E., and Vladimir, M. (2013). A
time series forest for classification and feature extrac-
tion. Information Sciences, 239:142–153.
Gers, F. A., Schmidhuber, J., and Cummins, F. (2000).
Learning to forget: continual prediction with LSTM.
Neural Computation, 12:2451—-2471.
Hornecker, E. and Nicol, E. (2012). What do lab-based user
studies tell us about in-the-wild behavior? In Proceed-
ings of the Designing Interactive Systems Conference
on (DIS’12), pages 358—-367.
Identifying Visitor’s Paintings Appreciation for AI Audio Guide in Museums
63

Iwashita, Y., Ogawara, K., and Kurazume, R. (2014). Iden-
tification of people walking along curved trajectories.
Pattern Recognition Letters, 48:60–69.
Kopp, S., Gesellensetter, L., Kr
¨
amer, N. C., and
Wachsmuth, I. (2005). A conversational agent as mu-
seum guide – design and evaluation of a real-world
application. In Panayiotopoulos, T., Gratch, J., Aylett,
R., Ballin, D., Olivier, P., and Rist, T., editors, Intel-
ligent Virtual Agents, pages 329–343, Berlin, Heidel-
berg. Springer Berlin Heidelberg.
Le, H. V., Tsuyoshi, and Iguchi, M. (2018). Deep mod-
ular multimodal fusion on multiple sensors for vol-
cano activity recognition. In Machine Learning and
Knowledge Discovery in Databases, pages 602–617.
Springer International Publishing.
Lecun, Y., Bottou, L., Bengio, Y., and Haffner, P. (1998).
Gradient-based learning applied to document recogni-
tion. Proceedings of the IEEE, 86(11):2278–2324.
Leder, H., Belke, B., Oeberst, A., and Augustin, D. (2004).
A model of aesthetic appreciation and aesthetic judg-
ments. British Journal of Psychology, 95(4):489–508.
Leder, H., Carbon, C.-C., and Ripsas, A.-L. (2006). Enti-
tling art: Influence of title information on understand-
ing and appreciation of paintings. Acta Psychologica,
121(2):176–198.
Li, X., Makihara, Y., Xu, C., Yagi, Y., and Ren, M. (2018).
Gait-based human age estimation using age group-
dependent manifold learning and regression. Multi-
media Tools and Applications, 77(21):28333–28354.
Liu, J., Akash, K., Misu, T., and Wu, X. (2021). Clus-
tering human trust dynamics for customized real-time
prediction. In Proceedings of 2021 IEEE Interna-
tional Intelligent Transportation Systems Conference
(ITSC’21), pages 1705–1712.
L
¨
oning, M., Bagnall, A. J., Ganesh, S., Kazakov, V.,
Lines, J., and Kir
´
aly, F. J. (2019). sktime: A uni-
fied interface for machine learning with time series.
arXiv:1909.07872 [cs.LG].
Martella, C., Miraglia, A., Frost, J., Cattani, M., and van
Steen, M. (2017). Visualizing, clustering, and predict-
ing the behavior of museum visitors. Pervasive and
Mobile Computing, 38:430–443.
Monfort, S. S., Graybeal, J. J., Harwood, A. E., McKnight,
P. E., and Shaw, T. H. (2017). A single-item assess-
ment for remaining mental resources: development
and validation of the gas tank questionnaire (GTQ).
Theoretical Issues in Ergonomics Science, 19(5):530–
552.
Ngo, T. T., Makihara, Y., Nagahara, H., Mukaigawa, Y.,
and Yagi, Y. (2014). The largest inertial sensor-
based gait database and performance evaluation of
gait-based personal authentication. Pattern Recogni-
tion, 47(1):228–237.
Parietti, F. and Asada, H. H. (2013). Dynamic analysis and
state estimation for wearable robotic limbs subject to
human-induced disturbances. In Proceedings of 2013
IEEE International Conference on Robotics and Au-
tomation (ICRA’13), pages 3880–3887.
Pedregosa, F., Varoquaux, G., Gramfort, A., Michel, V.,
Thirion, B., Grisel, O., Blondel, M., Prettenhofer,
P., Weiss, R., Dubourg, V., Vanderplas, J., Passos,
A., Cournapeau, D., Brucher, M., Perrot, M., and
Duchesnay, E. (2011). Scikit-learn: Machine learning
in Python. Journal of Machine Learning Research,
12:2825–2830.
Triloka, J., Senanayake, S. M. N. A., and Lai, D. (2016).
Neural computing for walking gait pattern identifi-
cation based on multi-sensor data fusion of lower
limb muscles. Neural Computing and Applications,
28(S1):65–77.
Vallez, N., Krauss, S., Espinosa-Aranda, J. L., Pagani, A.,
Seirafi, K., and Deniz, O. (2020). Automatic museum
audio guide. Sensors, 20(3):779.
Vaswani, A., Shazeer, N., Parmar, N., Uszkoreit, J., Jones,
L., Gomez, A. N., Kaiser, Ł., and Polosukhin, I.
(2017). Attention is all you need. Advances in neural
information processing systems (NIPS’17), 30:1–11.
Xu, Y., Lin, W., and Hu, Y. (2020). Stock trend pre-
diction using historical data and financial online
news. In Proceedings of 2020 IEEE Interna-
tional Conference on Parallel & Distributed Pro-
cessing with Applications, Big Data & Cloud
Computing, Sustainable Computing & Com-
munications, Social Computing & Networking
(ISPA/BDCloud/SocialCom/SustainCom’20), pages
1507–1512.
Yalowitz, S. S. and Bronnenkant, K. (2009). Timing and
tracking: Unlocking visitor behavior. Visitor Studies,
12(1):47–64.
Yoshimura, Y., Girardin, F., Carrascal, J. P., Ratti, C.,
and Blat, J. (2012). New tools for studying visi-
tor behaviours in museums: A case study at the lou-
vre. Information and Communication Technologies in
Tourism 2012, pages 391–402.
Zancanaro, M., Kuflik, T., Boger, Z., Goren-Bar, D., and
Goldwasser, D. (2007). Analyzing museum visitors’
behavior patterns. In Conati, C., McCoy, K., and
Paliouras, G., editors, User Modeling 2007, pages
238–246, Berlin, Heidelberg. Springer Berlin Heidel-
berg.
ICAART 2023 - 15th International Conference on Agents and Artificial Intelligence
64
