
Nearest Neighbours and XAI Based Approach for Soft Labelling
Ramisetty Kavya, Jabez Christopher and Subhrakanta Panda
Department of Computer Science and Information Systems, BITS Pilani, Hyderabad Campus, Telangana, India
Keywords:
Supervised Learning, Probabilistic Label, K-nearest Neighbour, Dempster Shafer Theory, Uncertainty.
Abstract:
Hard label assignment is a challenging task in case of epistemic uncertainty. This work initially converts the
hard labels of evidential instances into probabilistic labels based on k-nearest neighbours. Neighbours are
identified in a way that at least half of them must belong to the hard label of the corresponding evidential
instance. The probabilistic label of a decision query is computed by combining the probabilistic labels of the
nearest neighbours using Dempster’s combination rule. Synthetic data is considered to verify the probabilistic
labels over hard labels by varying the number of samples, number of neighbours and the overlapping degree
between the classes. It is observed that the performance of the method mainly depends on the overlapping
degree between classes. Probabilistic labels are intuitive compared to hard labels in case of high overlapping
region. Moreover, few publicly available datasets are also considered to verify the performance of probabilistic
labels on boundary instances. The proposed method achieves an accuracy of 90.44% and 98.24% on breast
dataset trained with 10% and 90% of data respectively. Therefore the proposed method is sample efficient,
calibrated, and interpretable.
1 INTRODUCTION
Machine learning (ML) algorithms learn patterns
from training data for assigning labels to prediction
queries. However, availability of less number of ev-
idential instances (training samples), and uncertainty
in their decision alternatives (classes) may reduce the
performance of the ML algorithms. If the ML model
is not interpretable, then it may not be able to pro-
vide explanations for decision alternatives. These two
characteristics of Explainable Artificial Intelligence
(XAI) – performance and explainability – motivates
to find a learning methodology which is sample ef-
ficient and interpretable to provide explainable out-
comes.
A model is said to be accurate when it is able
to differentiate among disjoint classes. Most of the
learning paradigms in literature may not be able to
produce accurate models because of uncertainty in ev-
idential instances (Kavya and Christopher, 2022). If
the learning model is not accurate, then assigning a
hard label to unknown decision query is quite diffi-
cult and challenging task.
Hard label, also known as crisp label, can be en-
coded as one-hot vector; this indicates that the in-
stance strictly belongs to a particular class. But the
strict encoding is difficult when there is uncertainty
in the instances. The difficulty with this kind of
hard labelling can be handled in two ways: first is
to gather additional instances which supports learn-
ing algorithms in differentiating disjoint classes for
generating models, and second is to convert the hard
labels to probabilistic labels. In domains like health-
care, gathering additional information which is hav-
ing less uncertainty may not be possible all the time.
A probabilistic label or soft label can be encoded as
a belief structure in which each disjoint class is as-
signed with a membership degree. Hard label is a
special case of probabilistic label when the member-
ship degrees of all the classes other than one particular
class are equal to zero. Probabilistic labelling is use-
ful in cases where the overlapping region among dis-
joint classes is high. Most of the existing datasets for
developing an accurate classification model are hard
labelled irrespective of the uncertainty in evidential
data.
The existing learning algorithms like k-nearest
neighbours, support vector machine, decision trees,
neural networks, and ensemble approaches which are
trained on the evidential samples of hard labels are
assigning hard labels to decision queries though these
models are not 100% confident. In such less confident
scenarios, these learning algorithms would have fol-
lowed probabilistic labelling, but none of them does
108
Kavya, R., Christopher, J. and Panda, S.
Nearest Neighbours and XAI Based Approach for Soft Labelling.
DOI: 10.5220/0011619800003393
In Proceedings of the 15th International Conference on Agents and Artificial Intelligence (ICAART 2023) - Volume 3, pages 108-116
ISBN: 978-989-758-623-1; ISSN: 2184-433X
Copyright
c
2023 by SCITEPRESS – Science and Technology Publications, Lda. Under CC license (CC BY-NC-ND 4.0)

because they do not know the conversion of hard la-
bel to probabilistic label. Therefore, this work mainly
focuses on for generating accurate models when the
evidential data is limited and uncertain.
The proposed probabilistic labelling method ini-
tially converts the hard labelled evidential data into
probabilistic labelled evidential data by identifying
neighbours. The proposed method imposes a con-
dition while identifying neighbours of an evidential
instance; condition is that at least half of the neigh-
bours must belong to the hard label of the correspond-
ing evidential instance. This condition assures that
the membership degree corresponds to the hard la-
bel of an evidential instance will never be less that
0.5. When a new decision query arrives, the proposed
method identifies the nearest evidential instances, and
combines their probabilistic labels using Dempster’s
combination rule. This rule results in a belief struc-
ture and it is considered as the probabilistic label of
that decision query. The main contributions of this
work are as follows:
1. A relabelling method is proposed based on the k-
nearest neighbours algorithm for converting hard
labels of evidential instances to probabilistic la-
bels.
2. A decision-making model is proposed based on
the k-nearest neighbours algorithm and Demp-
ster’s combination rule for assigning probabilistic
labels to decision queries.
2 FOUNDATIONS AND RELATED
WORKS
The objective of learning algorithms for solving clas-
sification problems is to find a function, f : X → Y ,
where X ∈ R
n
and Y ∈ {c
1
,c
2
,...,c
m
}, which min-
imises the error between original label and predicted
label. Dataset (D) consists of samples where each
sample (x ∈ D) is a combination of n attribute-value
pairs and a original label (c
i
∈ Y ). P number of in-
stances in D are considered to train the classification
model, and the remaining instances in D are consid-
ered to test the performance of the developed classifi-
cation model.
2.1 Probabilistic Labels
In general, original label c
i
of an instance x ∈ D can be
encoded as a vector of length m where i
th
position is
equal to one and all the remaining positions are equal
to zero. For example, if the original label of x is en-
coded as f (x) = [0,0,1,0,0], then it can be interpreted
as x belongs to c
3
(Vega et al., 2021). Assigning en-
tire probability to one single class is undesirable es-
pecially in healthcare domain where the information
contains uncertainty.
In contrast, probabilistic labels share the probabil-
ity among disjoint classes. A probabilistic label can
be encoded as a vector of probabilities where each
probability is the membership degree of the corre-
sponding class. For example, if the probabilistic label
of x is encoded as f (x) = [0.2,0.3,0.1,0.2,0.2], then
it can be interpreted as the decision-making model is
30% confident that x belongs to c
2
. This vector serves
as a knowledge to decision-maker for choosing an op-
timal decision.
In literature, there are two different types of prob-
abilistic labels, namely, instance-wise and group-
wise. Former is having independent probabilistic la-
bel for each instance, whereas, latter is having one
common probabilistic label for group of instances.
This work considers instance-wise probabilistic labels
which means that that each instance is having a label
of probability values corresponding to decision alter-
natives.
2.2 K-nearest Neighbours
Let q be the decision query to which a label (l) needs
to be assigned by k-Nearest Neighbours (k-NN) clas-
sification model (M) (Christopher, 2019). M ap-
plies distance measures like Euclidean, Manhattan,
and others to identify the set of nearest evidential in-
stances, NN = x
1
,x
2
,..., x
k
∈ D for q. The labels of
the evidential instances in NN are considered for as-
signing l to q. The choice of the distance measure,
optimal number of neighbours, and the strategy for
finding nearest neighbours are the three main factors
which can impact the performance of k-NN.
2.3 Dempster Shafer Theory
Dempster Shafer theory considers the powerset of
decision alternatives to represent uncertainty, and a
combination operation which satisfies both associa-
tive and commutative properties to combine belief
structures (Dempster, 2008). Let Θ be the Frame of
Discernment (FoD) which consists of a finite non-
empty set of mutually exclusive or disjoint class la-
bels in a dataset, D. The powerset of Θ is represented
as
℘(Θ) = {{
/
0},{θ
1
},{θ
2
},..., {θ
1
,θ
2
},..., Θ}
Let y(x
i
) and y(x
j
) are the probabilistic labels associ-
ated with x
i
and x
j
instances. Dempster’s combination
Nearest Neighbours and XAI Based Approach for Soft Labelling
109

rule is applied to combine x
i
and x
j
as
r
x(2),θ
=
0 If θ =
/
0
1
1 − k
∑
A∩B=θ
y(x
i
,A)y(x
j
,B) If θ ∈ ℘(Θ)
(1)
Normalisation factor, k =
∑
A∩B=
/
0
y(x
i
,A)y(x
j
,B)
where, r
x(n),θ
is the membership degree for θ in the re-
sultant probabilistic label obtained by combining the
probabilistic labels of n instances.
2.4 Related Works
Membership degrees in a probabilistic label can be
either subjective or objective. Nguyen et al. fol-
lows subjective approach, and got membership de-
grees directly from domain experts (Nguyen et al.,
2011). Classification model trained on these subjec-
tive probabilistic labels are more accurate compared
to the models trained on hard labels. However, it may
not be possible for human experts to provide reliable
membership degrees all the time.
Szegedy et al. follows objective approach, and
used a smoothing parameter to compute membership
degrees in probabilistic labels (Szegedy et al., 2016).
For example, if the parameter value is 0.1 then the
hard label, [0,1] is converted as probabilistic label
([0.1,0.9]). Accuracy of the ImageNet dataset is in-
creased by 2% when hard labels are converted into
probabilistic labels using smoothing parameter. How-
ever, Norouzi et al. argued that all the disjoint classes
should not have equal membership degrees (Norouzi
et al., 2016). For example, if there were 10 disjoint
class, and the parameter value is equal to 0.1, then this
leads to have 0.1 as the membership degree to all the
classes. Arbitrary way of penalizing hard labels is not
a good approach in case of more number of classes.
Hinton et al. used model distillation to assign
probabilistic labels (Hinton et al., 2015). Initially, a
complex model is trained to output a real-valued vec-
tor in which k
th
value can be considered as the mem-
bership degree of k
th
class. Then a model that is more
simple is trained on the output of the complex model
for prediction. Though model distillation is an ef-
fective approach, it requires huge chunks of data for
training complex models.
Gayar et al. proposes a novel method for generat-
ing soft labels based on fuzzy-clustering (Gayar et al.,
2006). Five publicly available datasets are considered
to compare the performance of k-nearest neighbours
algorithm when it is trained on hard labels and soft
labels. Experimental results prove that learning soft
labels is more robust compared to learning hard la-
bels.
Vega et al. proposed an approach to use proba-
bilistic labels for training an accurate and calibrated
deep networks (Vega et al., 2021). Three classifica-
tion tasks, namely, diagnosis of hip dysplasia, glau-
coma, and fatty liver are considered; results prove that
training with probabilistic labels increases accuracy
up to 22%.
Based on the knowledge attained from aforemen-
tioned literature, it can be understood that training the
models using probabilistic labels instead of hard la-
bels, supports the development of accurate classifica-
tion models. However, there are two issues that need
to be be resolved: first, there is no appropriate rela-
belling method for converting hard labels to proba-
bilistic labels; second, ignoring original labels may
lead to unreliable probabilistic labels. This work pro-
poses a relabelling approach which converts hard la-
bels to probabilistic labels without ignoring the origi-
nal labels.
3 PROPOSED METHOD
Framework of the proposed probabilistic labelling
method based on k-nearest neighbours (k-NN) and
Dempster Shafer (DS) theory consists of two phases,
namely, relabelling and decision-making.
3.1 Relabelling Phase
Relabelling phase focuses on converting hard labels
of evidential data into probabilistic labels by iden-
tifying nearest neighbours. Evidential data consists
of instances where each instance is a combination of
attribute-value pairs and a hard label. Consider an in-
stance (x) from evidential data which needs to be re-
labelled. The distances from x to remaining eviden-
tial instances are computed based on Euclidean mea-
sure to identify k nearest neighbours of x. In clas-
sical k-NN algorithm, k neighbours are the instances
with minimal distance from x, and can belong to any
class in the evidential data. Whereas in the proposed
system, at least k/2 neighbours are the instances with
minimal distance from x, and must belong to the same
class of x. The remaining k/2 neighbours are the in-
stances with minimal distance from x, and can belong
to any class including the class of x.
The rationale behind dividing the k neighbours
into two disjoint sets is to not ignore the hard labels of
evidential instances. Once the k neighbouring eviden-
tial instances are identified, the membership degree
of each class in probabilistic label of x is computed
using interestingness measure like confidence. Since
at least 50% of the neighbours belong to the corre-
ICAART 2023 - 15th International Conference on Agents and Artificial Intelligence
110

Algorithm 1: Relabelling Phase.
Input: Evidential data (D
old
) with p
instances, n attributes and m class
labels.
User-defined parameter (k) which
represents number of neighbours
Output: Relabeled evidential data (D
new
)
foreach p
i
in D
old
do
NN = {} ; // NN consists of k
nearest neighbours for p
i
NN(p
ii
) = {} ; // NN(p
ii
) consists
of k/2 nearest neighbours for p
i
with c
i
NN(p
i
) = {} ; // NN(p
i
) consists of
k/2 nearest neighbours for p
i
with any class label
foreach p
j
in D
old
do
dist(p
i
, p
j
) =
p
∑
n
a=1
(p
ia
− p
ja
)
2
if (dist(p
i
, p
j
)) is minimal and
(p
j
∈ c
i
) and (|NN(p
ii
)| <
k
2
) then
NN(p
ii
) = p
j
end
else if (dist(p
i
, p
j
)) is minimal and
(|NN(p
i
)| <
k
2
) then
NN(p
i
) = p
j
end
end
NN = NN(p
ii
) + NN(p
i
)
foreach c
j
in D
old
do
PL(p
i
,c
j
) =
|NN(c
j
)|
|NN|
end
D
new
= PL(p
i
)
end
sponding hard label, membership degree of the origi-
nal class of x in its probabilistic label would never be
less than 0.5. The probabilistic labels of all the evi-
dential instances are computed, and a new relabelled
evidential dataset is formed. The pseudocode for re-
labelling the evidential instances from hard to proba-
bilistic is presented in Alg. 1.
3.2 Decision-Making Phase
Decision-making phase focuses on assigning proba-
bilistic labels for decision queries based on the rela-
belled evidential data. When a decision query arrives,
the proposed system identifies its k nearest evidential
instances based on the Euclidean distance. The condi-
tion which was imposed on identifying k neighbours
in relabelling phase is not considered in decision-
making phase, because the hard label of an instance
was known in relabelling phase, but the hard label of
a query is not known in decision-making phase. Thus,
the k neighbours of a decision query are the eviden-
tial instances with minimal distance, and can belong
to any class in data.
It depends on decision-maker whether to continue
with same k value or to use different k values for dif-
ferent phases. If there exist overlapping among dis-
joint classes, then increase in k value may increase the
neighbours from different classes. If the evidential
neighbours of a decision query belongs to different
classes, then there may be no considerable difference
among the membership values of different classes.
Thus, it can be observed that the choice of k value
has a significant impact on the membership values in
a probabilistic label of a decision query when there is
overlapping.
Once the nearest evidential instances for a deci-
sion query are identified based on the Euclidean dis-
tance and k value, its probabilistic label is assigned
by combining the probabilistic labels of all the near-
est evidential instances using Dempster’s combina-
tion rule. If the probabilistic labels of nearest neigh-
bours of a decision query are highly conflicting, then
the membership values are updated from 0 to 0.0001.
The pseudo code for assigning a probabilistic label
to a decision query is presented in Alg. 2. The pro-
Algorithm 2: Decision-making Phase.
Input: Relabelled evidential data (D
new
)
with p instances, n attributes and m
class labels.
User-defined parameter (k) which
represents number of neighbours
Decision Query (x) with n attributes
Output: Probabilistic label for x (PL(x))
foreach p
i
in D
new
do
NN(x) = {} ; // NN(x) consists of
nearest neighbours for x
dist(x, p
i
) =
p
∑
n
a=1
(x
a
− p
ia
)
2
if dist(x, p
i
) is minimal then
NN(x) = p
i
end
end
foreach c
j
in D
new
do
PL(x,c
j
) = r
NN(x),c
j
; // refer Eq.(1)
end
posed method focuses more on predicting the proba-
bility of a decision query belonging to each disjoint
class rather than predicting a class directly. Since
Nearest Neighbours and XAI Based Approach for Soft Labelling
111
the probabilities are important, calibration of the pro-
posed probabilistic labelling method needs to be mea-
sured and improved. Calibration of a model ensures
that the distribution of the predicted probabilities are
similar to the distribution of the observed probabil-
ities. A model is said to be calibrated if it returns
probabilities which are good estimates of the actual
likelihood of a class (Vega et al., 2021).
4 EXPERIMENTS AND RESULTS
This section presents the robustness of the proposed
probabilistic labelling method using both synthetic
data and real-world data.
4.1 Synthetic Data
Two distinct Gaussians are considered for generat-
ing synthetic data using sklearn package in python.
Total number of samples, separation region between
classes, and number of samples per each class are
considered as three parameters to generate different
datasets. The proposed method is trained and tested
on all different datasets to verify its robustness. In the
entire experiment on synthetic data, k value remains
as 5. In each dataset, 80% of the samples are consid-
ered for training, and the remaining 20% are consid-
ered for testing the proposed method.
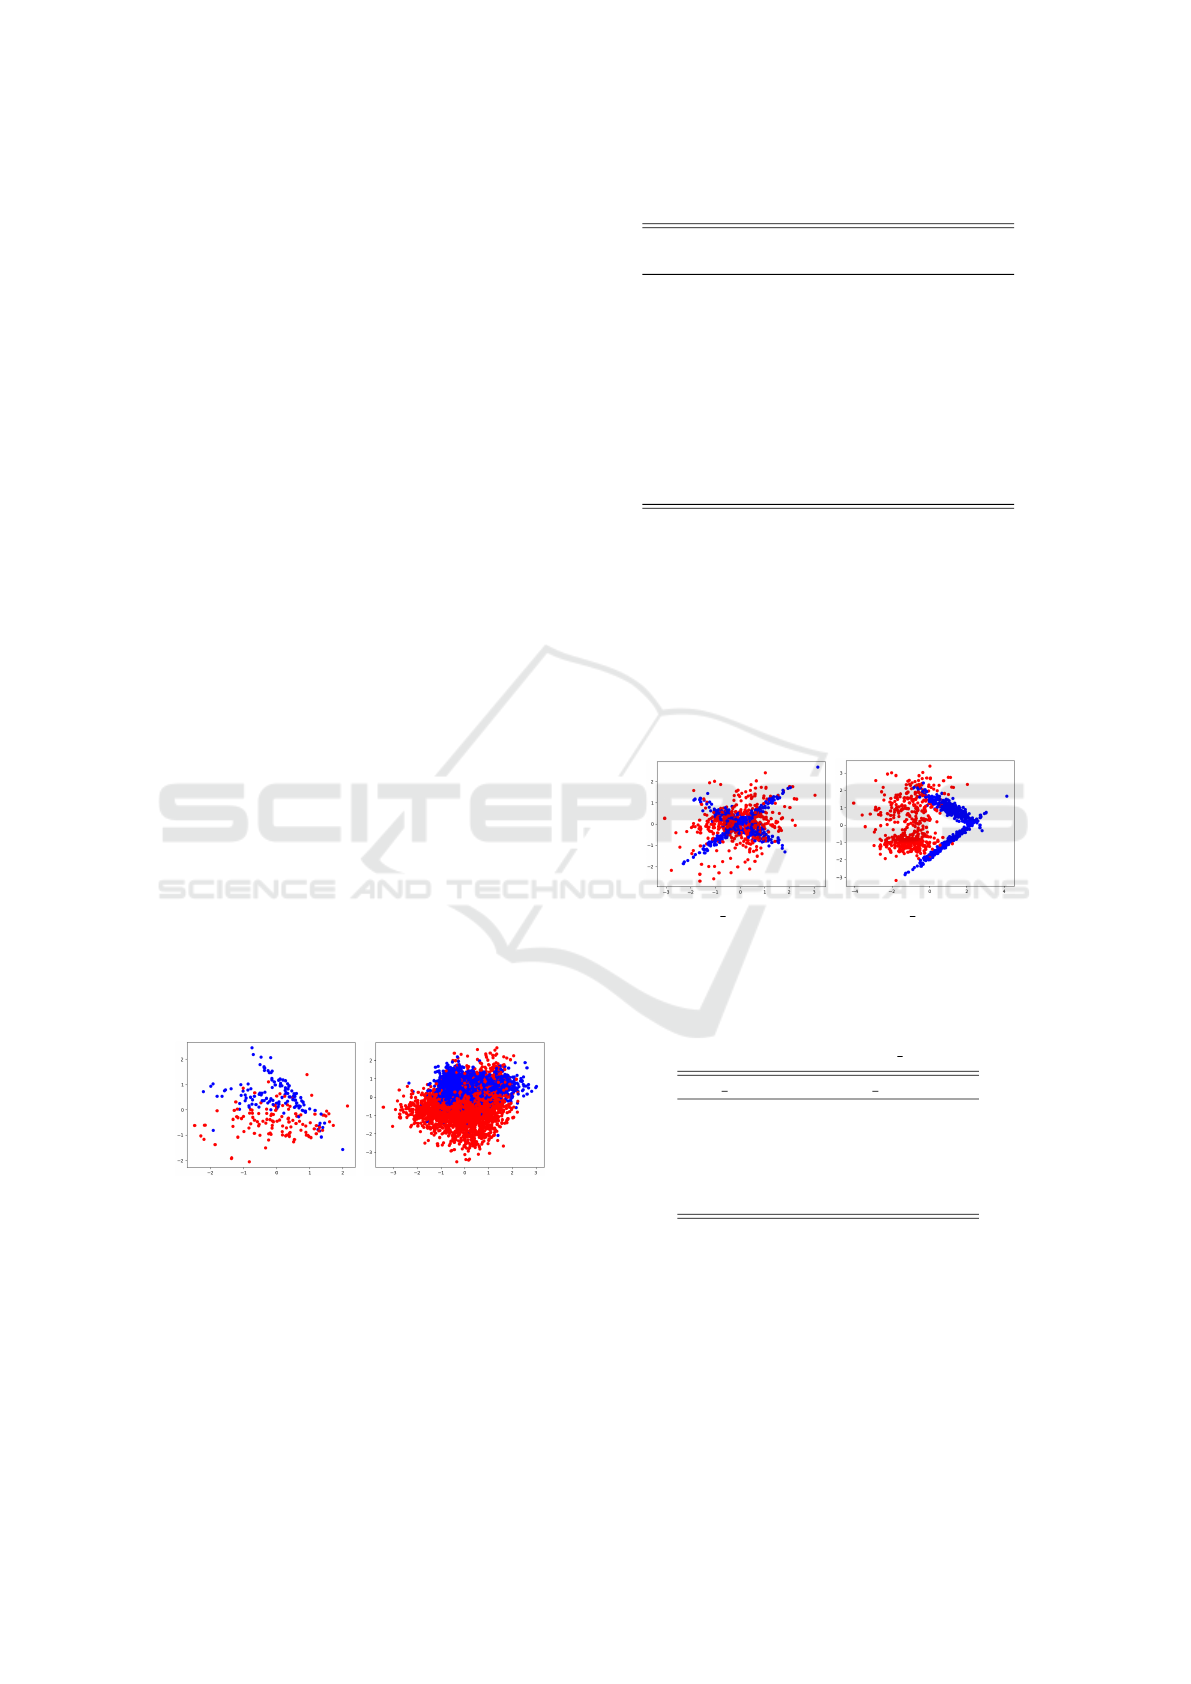
Case 1: Total number of samples is varied from
250 to 7000 by fixing the separation between the
class as 0.5, and by maintaining the equal number of
samples in each class. Figure 1 and 1 presents the
synthetic data where total number of samples is 250
and 7000 respectively. In a probabilistic label, the
(a) No. of samples = 250 (b) No. of samples = 7000
Figure 1: Varying number of samples.
class with highest membership degree is considered
as the predicted label to verify the accuracy. Table 1
presents the total number of instances along with ac-
curacy of the proposed method and the accuracy of
traditional k-NN. It can be observed from Table 1 that
increasing or decreasing the total number of instances
does not have significant impact on the performance
of the proposed method. Moreover, the accuracy of
Table 1: Accuracy with varying number of samples.
Samples
Probabilistic
labels accuracy
Hard labels
accuracy
250 82 82
500 94 94
750 90 89
1000 86 86.5
2000 75 73.75
3000 86 86
4000 85.75 85.87
5000 72.6 71.8
6000 87.16 86.91
7000 81.71 81.28
the proposed method is almost similar to the accuracy
of the traditional k-NN.
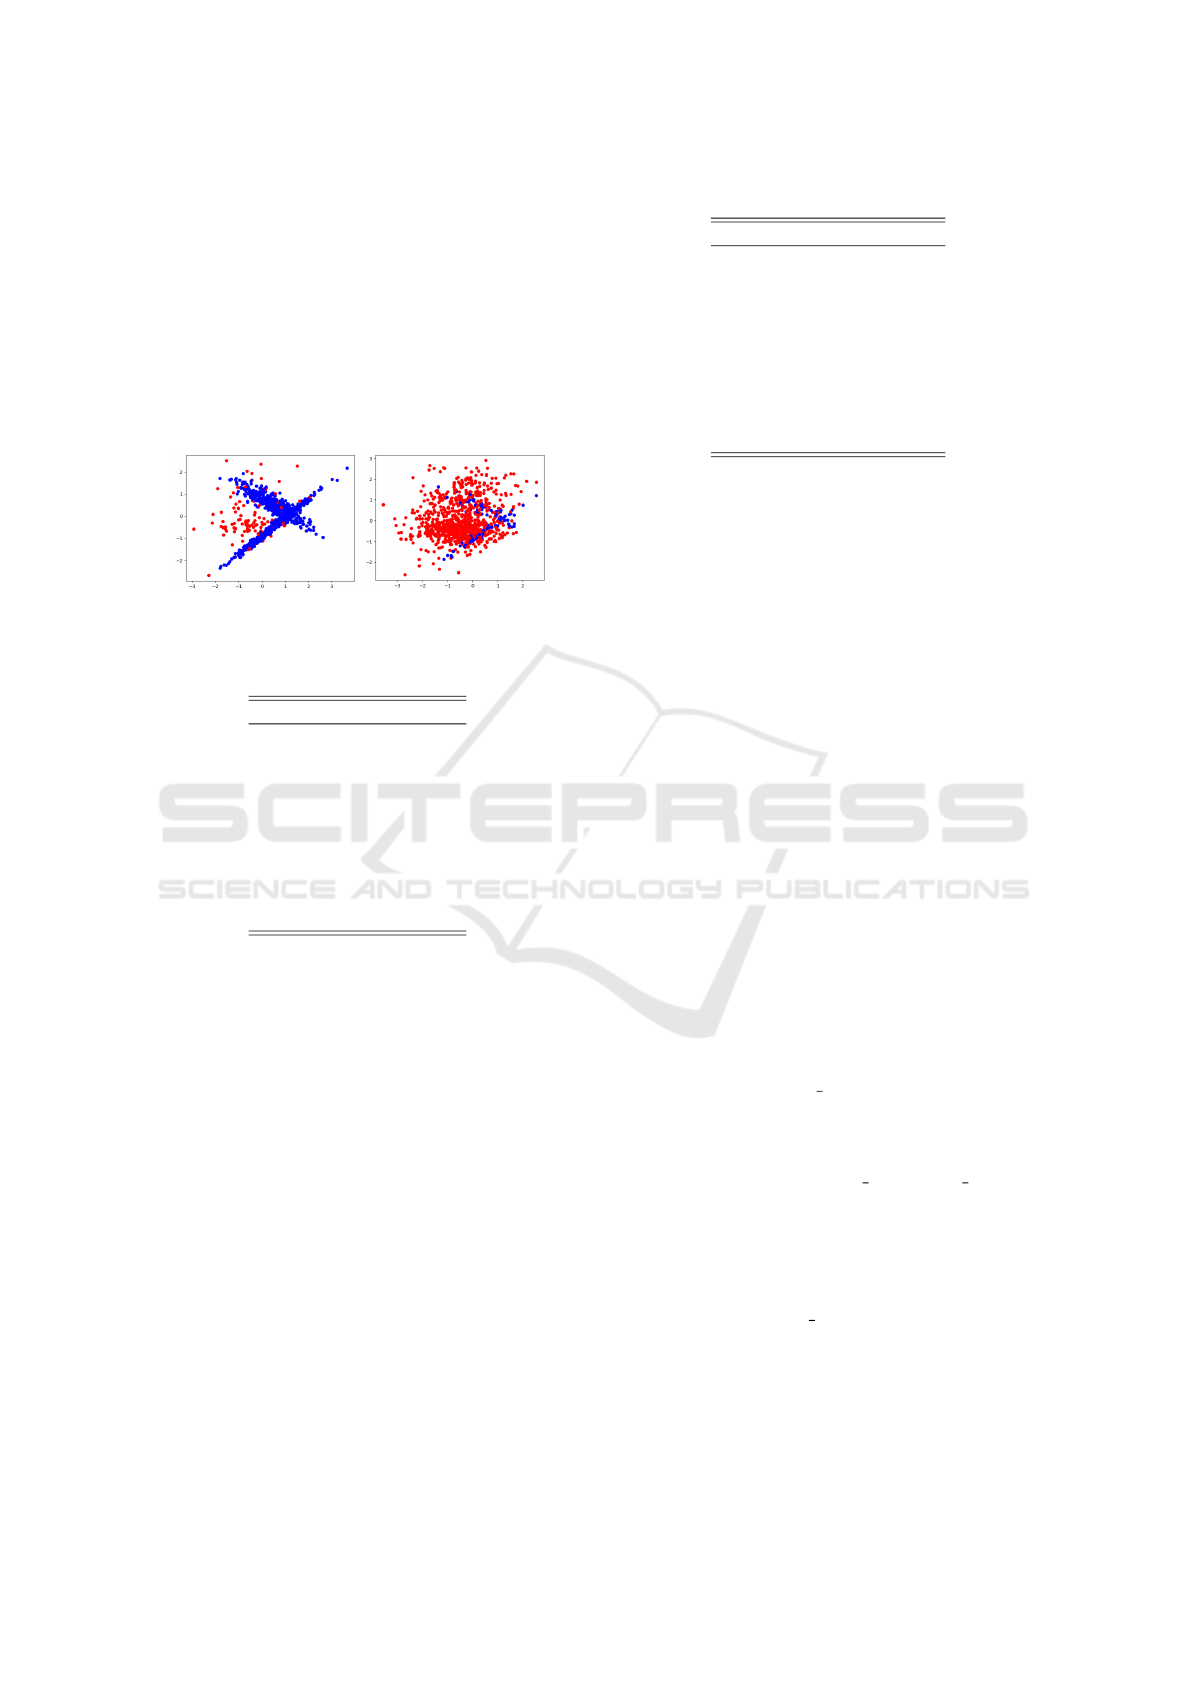
Case 2: The separation between the classes varies
between 0 and 1 by fixing the total number of sam-
ples as 1000, and by maintaining the equal number of
samples in each class. Figure 2 and 2 presents the syn-
thetic data with 0 and 1 as the separation degree be-
tween distinct classes respectively. Table 2 presents
(a) sep degree = 0 (b) sep degree = 1
Figure 2: Varying separation degree.
the separation degree between classes and accuracy.
It can be observed from Table 2 that the accuracy
Table 2: Accuracy with sep degrees.
Sep deg Acc Sep deg Acc
0.1 68.5 0.2 74.5
0.3 80 0.4 84
0.5 86 0.6 90
0.7 92 0.8 92.5
0.9 95.5 1 96
increases with increase in the separation degree be-
tween the classes. Since the proposed method uses k-
nearest neighbours as prototype to relabel training in-
stances, the decrease in the separation region leads to
have neighbours of different classes. If the neighbours
belongs to different classes, then there may not be
high difference between the membership degrees of
classes in the probabilistic label. It can be mentioned
ICAART 2023 - 15th International Conference on Agents and Artificial Intelligence
112
from Table 2 that the separation degree between the
classes has significant impact on the accuracy of the
proposed method.
Case 3: The number of samples in each class
varies 0.1 to 0.9 by fixing the total number of sam-
ples as 1000, and the separation degree between the
classes as 0.5. Figure 3 and 3 presents the synthetic
data with different distribution of samples between
distinct classes. Table 3 presents the class distribution
along with accuracy of each class.
(a) Class 1 as majority (b) Class 2 as majority
Figure 3: Varying distribution of samples.
Table 3: Accuracy with class distribution.
c
1
c
2
acc
0
acc
1
0.1 0.9 55.5 1
0.2 0.8 65.1 1
0.3 0.7 65.5 99.2
0.4 0.6 69 99.1
0.5 0.5 76.6 95.8
0.6 0.4 79.5 87.1
0.7 0.3 84.1 85.2
0.8 0.2 88.9 71.7
0.9 0.1 92.6 27.2
It can be observed from Table 3 that the accuracy
of a class increases with increase in the number of
samples of that class. Though it is idealistic to have
balanced number of samples, the performance of the
proposed method does not greatly rely on the distri-
bution of classes. Instead it depends on the closeness
among the samples of same class.
Case 4: In this case, the percentage of training
and testing samples varies by fixing the total number
of samples as 1000, separation between the classes
as 0.5, and the number of samples in each class are
equal. Table 4 presents the training and testing per-
centage and accuracy.
It can be observed from Table 4 that accuracy in-
creases with increase in the training data. However,
the proposed method is capable enough to achieve
reasonable accuracy even with less number of train-
ing instances.
Table 4: Accuracy with varying train-test-splits.
Train Test Accuracy
0.1 0.9 81.44
0.2 0.8 81.75
0.3 0.7 84.57
0.4 0.6 84.66
0.5 0.5 85
0.6 0.4 87.25
0.7 0.3 86.66
0.8 0.2 86
0.9 0.1 86
4.2 Real-World Data
This work considers the publicly available real-world
datasets from University of California Irvine (UCI)
repository.
Pima Indians Diabetes Dataset consists of 768
samples where each sample is a combination of eight
continuous-valued attributes and a binary class label.
Among 786 samples, 268 are predicted as diabetes
and the remaining 500 are predicted as non-diabetes.
This experiment starts with partitioning the
dataset two parts, namely, evidential data, and query
data. 80% of the samples belongs to evidential data
which are used to train the proposed method, and the
remaining 20% samples are considered as queries.
All the samples in the evidential data are hard la-
beled. The proposed method initially converts them
into probabilistic labels by identifying neighbours.
When a decision query arrives, proposed method
identifies its nearest evidential neighbours. If the
probabilistic labels of neighbours are not having con-
siderable difference between the membership degrees
of different classes, then it leads to misclassifica-
tion. There is a decision query with attribute-values
as {a
1
: 4, a
2
: 132, a
3
: 86, a
4
: 31, a
5
: 0, a
6
: 28, a
7
:
0.419,a
8
: 63} and class 0 is the original hard label.
After combining the probabilistic labels of its neigh-
bours using Dempster’s combination rule, the resul-
tant probabilistic label has 0.5614 and 0.4385 as the
membership degrees for class 1 and class 0 respec-
tively. Since the proposed method considers the class
with highest membership degree to compute accu-
racy, this particular decision query is considered as
misclassified. Change in the number of neighbours
may make this particular instance to assign high mem-
bership degree for class 0. However, change in num-
ber of neighbours changes the membership degrees of
remaining queries as well. Thus, classified and mis-
classified instances changes with change in k value.
Table 5 presents the k values with corresponding ac-
curacies. It can be observed from Table 5 that accu-
Nearest Neighbours and XAI Based Approach for Soft Labelling
113

Table 5: Accuracy of diabetes dataset.
k value Accuracy
1 61.68
3 75.32
5 75.97
7 76.62
9 81.81
racy increases with increase in the k value. If there
exist overlapping between classes, then increasing k
value increases the chance for neighbours from differ-
ent class. This leads to decrease in accuracy. If there
is no much overlapping between classes, then increas-
ing or decreasing the k value does not have much im-
pact on accuracy. Thus, accuracy of the proposed
method depends on the overlapping region between
the classes, not on k value. Overlapping depends
on the uncertainty in the data; probabilistic labelling
method based on Dempster’s theory is one such ap-
proach to represent uncertainty in efficient manner.
Indian Liver Patient Dataset (ILPD) consists of
416 liver disease patient records and 167 non-liver
disease records. Each record is a combination of
10 continuous-valued attributes and a binary label.
The proposed method initially converts the hard la-
bels of 80% of the samples into probabilistic labels
using k-nearest neighbours. The probabilistic labels
of remaining 20% of the samples are computed by
combining the probabilistic labels of corresponding
neighbours using Dempster’s combination rule. Ta-
ble 6 presents the k values along with accuracies. It
Table 6: Accuracy of liver disease dataset.
k value Accuracy
1 59.82
3 67.52
5 64.10
7 67.52
9 64.95
can be observed from Table 6 that increasing or de-
creasing the k value does not have significant impact
on accuracy. Only the overlapping region between the
class has an impact on the performance of the pro-
posed method.
Wisconsin breast cancer dataset consists of 569
samples where each sample is a combination of 30
continuous-valued attributes and a binary class label.
In this experiment, k value remains constant, and the
ratio of train-test split varies. Table 7 presents the
train-test-split values along with accuracies. It can be
observed from Table 7 that accuracy increases with
increase in the training data. However, the proposed
Table 7: Accuracy of breast cancer dataset.
Train Test Accuracy
0.1 0.9 90.44
0.2 0.8 92.54
0.3 0.7 93.98
0.4 0.6 94.15
0.5 0.5 95.78
0.6 0.4 96.49
0.7 0.3 96.49
0.8 0.2 96.49
0.9 0.1 98.24
method has recorded reasonable accuracy even with
10% of training samples. Thus, it can be concluded
that the proposed probabilistic labelling method is
sample efficient.
4.3 Comparative Analytics
This sub-section presents comparative analysis of the
proposed probabilistic labelling method with other re-
cent relevant works in literature. Most of these works
use either fuzzy functions or kernel functions for as-
signing probability values, and Dempster’s combina-
tion rule for assigning decision probabilities. Table
8 presents the performance of these models on UCI
datasets.
It can be observed from Table 8 that the proposed
decision-making model achieves the maximum accu-
racy for five out of seven datasets. Therefore, it can
be concluded that the decision-making model with
probabilistic labelling is superior compared to other
works.
5 CONCLUSION
The proposed method initially converts hard labels
of evidential instances to probabilistic labels using k-
nearest neighbours. The condition that ensures that at
least half of neighbours belongs to the hard label of
the corresponding evidence, supports in giving prior-
ity to the original class. After relabelling evidential
instances, the decision-making model assigns prob-
abilistic labels to decision queries by combining the
labels of neighbours using Dempster’s combination
rule. It is proven from the experimental results that
proposed method is sample efficient. Moreover, the
proposed method is said to be calibrated because it
is able to represent the actual likelihood of classes in
terms of posterior probabilities. The soft label gives
an understanding to a decision-maker about differ-
ent alternatives and their combinations. The degree
ICAART 2023 - 15th International Conference on Agents and Artificial Intelligence
114

Table 8: Comparative Analysis.
Recent Works Breast IRIS Heart Diabetes Liver Hepatitis Sonar
(Denoeux, 2008) 76.3 80.57 75.81
(Xu et al., 2013) 82.59 79.4 72.57
(Xu et al., 2014) 95.6 85 85.5
(Xu et al., 2016) 83.7 79.88 68.26
(Liu et al., 2017) 85.56 83.85 76.02
(Qin and Xiao, 2018) 97.07 96.7 86.7 89.03
(Jiang et al., 2019) 69.91 95.33 75.19 70.96 76.48 81.29
(Pe
˜
nafiel et al., 2020) 93.85 95.9 72.7
(Song et al., 2021) 97.07 86.7 76.82 78.04
(Zhu et al., 2021) 97.15 99.33 91.48 81.61
(Ranjbar and Effati, 2022) 95.22 79.48 70.96 81.62
Proposed Method 98.24 100 85.36 81.81 67.52 89.65 76.19
of overlapping among the classes is the only factor
that has significant impact on the membership degrees
in probabilistic labels. Since identifying neighbours
for each instance is computationally complex, density
models or fuzzy approaches may be considered as the
prototype to convert hard labels to probabilistic labels
in future.
REFERENCES
Christopher, J. (2019). The science of rule-based classifiers.
In 2019 9th International Conference on Cloud Com-
puting, Data Science & Engineering (Confluence),
pages 299–303. IEEE.
Dempster, A. P. (2008). Upper and lower probabilities in-
duced by a multivalued mapping. In Classic works of
the Dempster-Shafer theory of belief functions, pages
57–72. Springer.
Denoeux, T. (2008). A k-nearest neighbor classification rule
based on dempster-shafer theory. In Classic works of
the Dempster-Shafer theory of belief functions, pages
737–760. Springer.
Gayar, N. E., Schwenker, F., and Palm, G. (2006). A study
of the robustness of knn classifiers trained using soft
labels. In IAPR Workshop on Artificial Neural Net-
works in Pattern Recognition, pages 67–80. Springer.
Hinton, G., Vinyals, O., Dean, J., et al. (2015). Distilling
the knowledge in a neural network. arXiv preprint
arXiv:1503.02531, 2(7).
Jiang, W., Huang, C., and Deng, X. (2019). A new prob-
ability transformation method based on a correlation
coefficient of belief functions. International Journal
of Intelligent Systems, 34(6):1337–1347.
Kavya, R. and Christopher, J. (2022). Interpretable sys-
tems based on evidential prospect theory for decision-
making. Applied Intelligence, pages 1–26.
Liu, Y.-T., Pal, N. R., Marathe, A. R., and Lin, C.-T. (2017).
Weighted fuzzy dempster–shafer framework for mul-
timodal information integration. IEEE Transactions
on Fuzzy Systems, 26(1):338–352.
Nguyen, Q., Valizadegan, H., and Hauskrecht, M. (2011).
Learning classification with auxiliary probabilistic in-
formation. In 2011 IEEE 11th International Confer-
ence on Data Mining, pages 477–486. IEEE.
Norouzi, M., Bengio, S., Jaitly, N., Schuster, M., Wu, Y.,
Schuurmans, D., et al. (2016). Reward augmented
maximum likelihood for neural structured prediction.
Advances In Neural Information Processing Systems,
29.
Pe
˜
nafiel, S., Baloian, N., Sanson, H., and Pino, J. A. (2020).
Applying dempster–shafer theory for developing a
flexible, accurate and interpretable classifier. Expert
Systems with Applications, 148:113262.
Qin, B. and Xiao, F. (2018). A non-parametric method to
determine basic probability assignment based on ker-
nel density estimation. IEEE Access, 6:73509–73519.
Ranjbar, M. and Effati, S. (2022). A new approach for fuzzy
classification by a multiple-attribute decision-making
model. Soft Computing, 26(9):4249–4260.
Song, X., Qin, B., and Xiao, F. (2021). Fr–kde: a hybrid
fuzzy rule-based information fusion method with its
application in biomedical classification. International
Journal of Fuzzy Systems, 23(2):392–404.
Szegedy, C., Vanhoucke, V., Ioffe, S., Shlens, J., and Wo-
jna, Z. (2016). Rethinking the inception architecture
for computer vision. In Proceedings of the IEEE con-
ference on computer vision and pattern recognition,
pages 2818–2826.
Vega, R., Gorji, P., Zhang, Z., Qin, X., Rakkunedeth, A.,
Kapur, J., Jaremko, J., and Greiner, R. (2021). Sam-
ple efficient learning of image-based diagnostic clas-
sifiers via probabilistic labels. In International Con-
ference on Artificial Intelligence and Statistics, pages
739–747. PMLR.
Xu, P., Davoine, F., Zha, H., and Denoeux, T. (2016). Evi-
dential calibration of binary svm classifiers. Interna-
tional Journal of Approximate Reasoning, 72:55–70.
Xu, P., Deng, Y., Su, X., and Mahadevan, S. (2013). A
new method to determine basic probability assign-
Nearest Neighbours and XAI Based Approach for Soft Labelling
115

ment from training data. Knowledge-Based Systems,
46:69–80.
Xu, P., Su, X., Mahadevan, S., Li, C., and Deng, Y. (2014).
A non-parametric method to determine basic proba-
bility assignment for classification problems. Applied
intelligence, 41(3):681–693.
Zhu, C., Qin, B., Xiao, F., Cao, Z., and Pandey, H. M.
(2021). A fuzzy preference-based dempster-shafer ev-
idence theory for decision fusion. Information Sci-
ences, 570:306–322.
ICAART 2023 - 15th International Conference on Agents and Artificial Intelligence
116
