Multi-Scale Feature Aggregation Based Multiple Instance Learning for
Pathological Image Classification
Takeshi Yoshida
1 a
, Kazuki Uehara
2 b
, Hidenori Sakanashi
2, 1 c
, Hirokazu Nosato
2 d
and Masahiro Murakawa
2, 1 e
1
University of Tsukuba, 1-1-1, Tennoudai, Tsukuba, Ibaraki, Japan
2
National Institute of Advanced Industrial Science and Technology (AIST), 1-1-1, Umezono, Tsukuba, Ibaraki, Japan
Keywords:
Attention Mechanism, Multi-Scale Whole Slide Image, Multiple Instance Learning, Pathological Diagnosis
Support Technology.
Abstract:
This study proposes a multi-scale attention assembler network (MSAA-Net) for multi-scale pathological image
classification. The proposed method discovers crucial features by observing each scale and finding essential
scales used for classification. To realize this characteristic, we introduce a two-stage feature aggregation
mechanism, which first assigns the attention weights to useful local regions for each scale and then assigns
the attention weights to the scale. The mechanism observes a pathological image from each scale perspective
and adaptively determines the essential scale to classify from the observation results. To train the MSAA-
Net, we adopt multiple instance learning (MIL), a learning approach for predicting a label corresponding to
multiple images. The labeling effort reduces because the MIL trains the classification model using diagnoses
for whole slide-level images obtained by daily diagnoses of pathologists instead of detailed annotations of the
images. We conducted classification using two pathological image datasets to evaluate the proposed method.
The results indicate that the proposed method outperforms state-of-the-art multi-scale-based methods.
1 INTRODUCTION
A pathological diagnosis is crucial in cancer medical
treatment because it determines the course of treat-
ment. Pathologists observe a specimen by switching
magnification scales on a microscope and diagnose
based on histopathological features, for example, the
size and shape of cells, that of cell nuclei, and the
arrangement of the tissues, obtained from this pro-
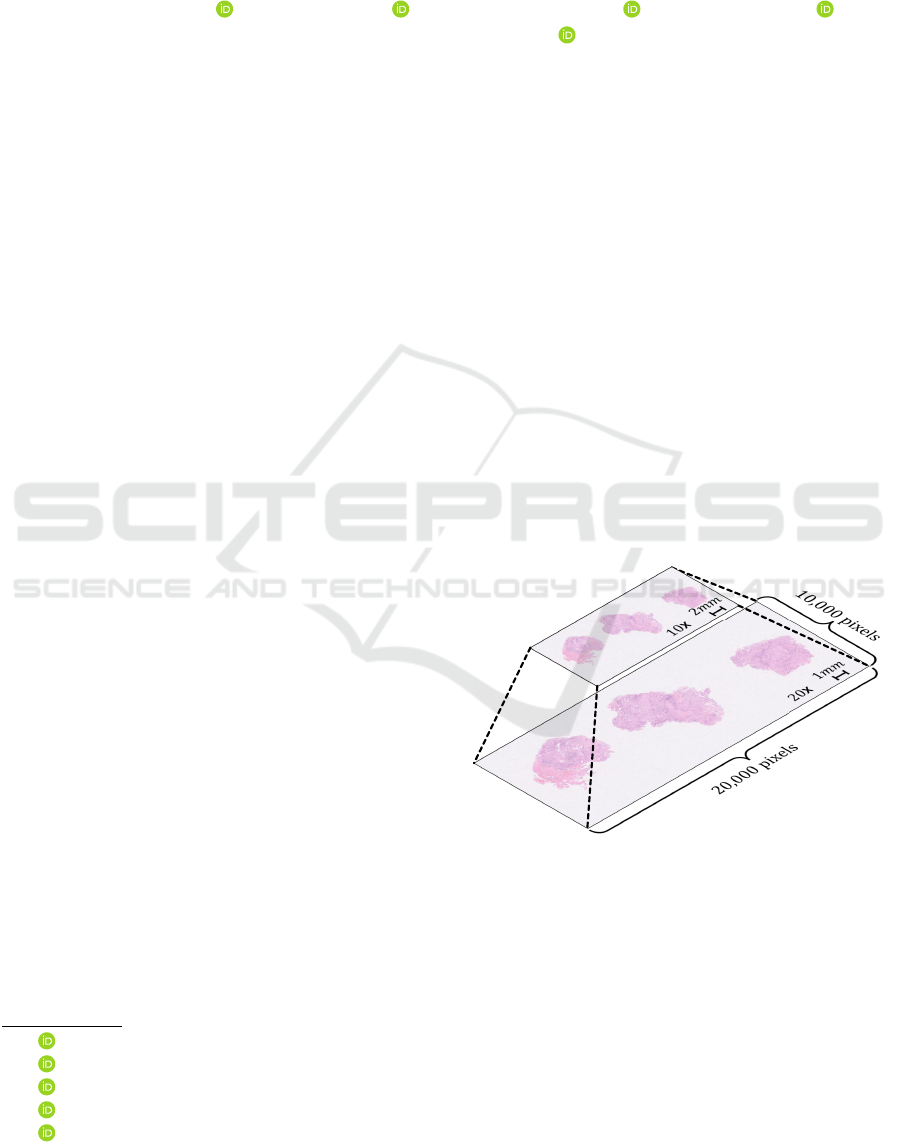
cedure. In recent years, the observation using whole
slide images (WSIs), shown in Figure 1, replaces con-
ventional observation. The WSIs are digital patho-
logical images obtained by scanning the entire slide
at high magnification. The diagnosis with the WSIs
is possible for multi-scale observation similar to the
approach followed in the conventional microscope by
down-sampling to the high magnification image. Al-
though the technology for supporting diagnosis has
been developed, the burden on pathologists is cur-
a
https://orcid.org/0000-0003-1434-2792
b
https://orcid.org/0000-0002-6628-6668
c
https://orcid.org/0000-0001-8987-908X
d
https://orcid.org/0000-0003-0332-7028
e
https://orcid.org/0000-0002-8406-7426
Figure 1: Whole slide images (WSIs).
rently intensive because the number of pathologists
is still insufficient (Wilson et al., 2018).
In this context, developing an automated patho-
logical diagnosis supporting technology based on ma-
chine learning methods is studied (Campanella et al.,
2019; Shao et al., 2021; Chen et al., 2022). In these
studies, classification methods are implemented to di-
agnose whether each WSI contains potential cancer
cells. Classification methods based on multiple in-
stance learning (MIL) (Dietterich et al., 1997; Maron
Yoshida, T., Uehara, K., Sakanashi, H., Nosato, H. and Murakawa, M.
Multi-Scale Feature Aggregation Based Multiple Instance Learning for Pathological Image Classification.
DOI: 10.5220/0011615200003411
In Proceedings of the 12th International Conference on Pattern Recognition Applications and Methods (ICPRAM 2023), pages 619-628
ISBN: 978-989-758-626-2; ISSN: 2184-4313
Copyright
c
2023 by SCITEPRESS – Science and Technology Publications, Lda. Under CC license (CC BY-NC-ND 4.0)
619

and Lozano-P
´
erez, 1997) are proposed. The MIL is
a learning approach using labels attached to multi-
ple images. The MIL-based methods can treat high-
resolution WSIs at high magnification with limited
computational resources by inputting image patches
divided from the WSIs. Furthermore, a labeling effort
is less because the methods require only WSI-level
labels obtained from daily diagnoses of pathologists
rather than image patch-level labels.
We consider that a multi-scale approach can im-
prove the diagnostic accuracy in the WSIs classifica-
tion because the suitable scale for diagnoses can vary
depending on the type of histopathological features.
For example, the observation of a cell level, such as
the condition of cell nuclei, and that of a tissue level,
such as the tissue structure consisting of the cell’s ar-
rangement, suit at high and low magnification, respec-
tively.
Thus, we propose a multi-scale attention assem-
bler network (MSAA-Net) that can focus on impor-
tant regions from each scale and highlight the scale
that should be used for the classification. To consider
the feature aggregation role aggregating image patch-
level features to a WSI-level feature and obtain the
advantage of the multi-scale approach, we introduce
a two-stage feature aggregation with region aggrega-
tors for each scale and a scale aggregator. First, the
region aggregator calculates region-level features for
each scale by attention weights. High values are as-
signed to the attention weights if the regions corre-
sponding to the weights are crucial for the classifica-
tion of each scale. Second, the scale aggregator aggre-
gates the scale-level features to the WSI-level feature
using a weighted sum with a high contribution factor
of an important scale for the classification.
The proposed method was experimentally evalu-
ated using two datasets created from a public database
and clinical cases. The results showed that the pro-
posed method performed higher classification accu-
racy in both datasets than that of the conventional
methods using the single-scale WSIs and the multi-
scale WSIs. In particular, the performance of a cancer
detection rate using the MSAA-Net was improved by
approximately 20% compared to that of the conven-
tional methods.
2 RELATED WORK
2.1 Multiple Instance Learning
The MIL is a learning approach for classification
models using the labels attached to multiple inputs in-
stead of each input. The MIL uses the notations: an
instance, a bag, and a bag label. In particular, the in-
stance indicates each inputted data. The bag indicates
a set of instances attached to a single label. Finally,
the bag label indicates the label for each bag.
Various MIL-based methods have been proposed,
such as those based on a support vector machine (An-
drews et al., 2002) or applying a linear logistic re-
gression (Herrera et al., 2016). The MIL-based meth-
ods that apply a deep neural network (DNN) have
also been proposed (Feng and Zhou, 2017; Pinheiro
and Collobert, 2015). The methods extract instance
features and aggregate the instance features to a bag-
level feature by the feature aggregation mechanism,
such as an average pooling and a max pooling, for a
bag label prediction. However, the aggregation mech-
anism ignores a few useful instance features.
This problem has been tackled by attention-based
deep MIL (ADMIL) (Ilse et al., 2018) that uses the at-
tention mechanism for the feature aggregation mech-
anism. In particular, the attention mechanism de-
termines the attention weights for each instance fea-
ture to calculate a bag-level feature by the weighted
sum. Consequently, the high attention weights indi-
cate the high contribution factor for the bag-level fea-
tures. Specifically, we can obtain functional features
by analyzing the attention weights.
The WSIs classification task can be regarded as a
MIL problem by considering the instances as the im-
age patches divided from the WSIs, the bags as the
WSIs, and the bag labels as diagnostic labels for each
WSI. Therefore, the task can be solved using the MIL-
based methods. The costs of preparing training data
are lower than that of supervised methods that require
labels for each image patch. This is because the meth-
ods implement the WSI-level labels attached to daily
diagnoses performed by pathologists. The regions of
suspected cancers can be obtained by analyzing the
attention weights without the detailed labels in the
training process.
2.2 MIL for Classification of
Multi-Scale WSIs
The MIL-based methods implementing a multi-scale
structure of WSIs have been proposed to improve the
classification performance. However, those methods
have limitations. For example, the observation pro-
cess of the multi-scale WSIs or the calculation of the
attention weights does not fully consider the multi-
scale structure.
A dual-stream MIL network (DSMIL) (Li et al.,
2021a) is a multi-scale WSIs classification method
that determines the critical regions by focusing on a
histopathological appearance. The DSMIL learns fea-
ICPRAM 2023 - 12th International Conference on Pattern Recognition Applications and Methods
620

ture extractors for each scale with a self-supervised
contrastive learning approach without the diagnosis
labels as pre-training. Therefore, the feature extrac-
tors output the features focusing on the appearance
differences.
The DSMIL calculates the attention weights as in
the following procedures. First, the method obtains
concatenated features for a region by considering the
features of all scales from one region. Then, the
method calculates an attention weight for each con-
catenated feature based on a feature space distance.
The method has the risk of underestimating
histopathological characteristics observed only on a
specific scale. The reason is that the DSMIL does not
observe the multi-scale WSIs from each scale view-
point. That is caused by assigning the weights uni-
formly to the features of all scales from one region.
A multi-resolution MIL-based (MRMIL)
model (Li et al., 2021b) is a method for predict-
ing cancer progression with a small computational
load by imitating a diagnosis process of pathologists.
First, the MRMIL model detects the regions of
suspected cancer on a low scale. Subsequently,
the MRMIL model analyzes the detected suspi-
cious regions at a high scale to predict the cancer
progression.
The MRMIL model has the risk of missing small
cancers because of the model structure observed from
the low scale followed by the high scale. Some types
of cancers should be detected by observing the shape
and color of cells using the high scale.
A multi-scale domain-adversarial MIL (MS-DA-
MIL) network (Hashimoto et al., 2020) is the multi-
scale WSIs classification method robust to the color
differences in each WSI. The color of the WSIs dif-
fers from each tissue specimen obtained, decreasing
the classification performance. Thus, the MS-DA-
MIL network learns the feature extractors not reflect-
ing color fluctuations of each WSI as pre-training. In
the multi-scale WSIs classification part, the MS-DA-
MIL network obtains the features for each scale using
the feature extractors.
The feature aggregation mechanism attaches the
attention weights to all features extracted from all re-
gions of all scales at once. If the specific regions are
attached to the high-weight values, the weight values
of other regions have low values. The reason is that
the sum of the attention weights is constrained to one
using a softmax function in the calculations. The MS-
DA-MIL network has the risk of focusing only on a
specific region of a specific scale and ignoring others
in the classification.
3 PROPOSED METHOD
We designed the proposed method following three
multi-scale analysis strategies to take full advantage
of the multi-scale structure. First, the method should
observe the multi-scale WSIs from each scale view-
point. Therefore, the method can detect even small
cancers observed only on a high scale. Then, the
method should highlight the observation scale adap-
tively depending on the classification target. Conse-
quently, the method can determine the crucial scale
from the inputted images, even if the method does
not know what classification target is contained in the
WSIs in advance. Finally, the method adopts a two-
stage attention procedure which first assigns the atten-
tion weights to useful local regions for each scale and
then assigns them to the scales.
3.1 Problem Formulation
A target WSI X
i
(i = 1, . . . , N) that has a s
j
( j =
1, . . . , S) scale is divided for N
(s
j
)
image patches
x
(s
j
)
ik
(k = 1, . . . , N
(s
j
)
) ∈ X
i
with resolution W × H.
We crop the image patches of the all scale based on
the center point of the highest magnification patch im-
ages used for this study. Therefore, we use the same
number of image patches for all scales. Furthermore,
the label for each image patch at each scale is denoted
a one-hot representation as follows:
y
(s
j
)
ikl
=
1 if l = c
0 otherwise
(l = 1, . . . , C),
(1)
where c and C are the cancer class index and the num-
ber of labels, respectively. The cancer class is as-
signed the image patch containing the cancer regions.
Then, the WSI-level label Y
il
that is the one-hot rep-
resentation is defined as follows:
Y
il
=
0 if
S
∑
j=1
N
(s
j
)
∑
k=1
y
(s
j
)
ikl
= 0
1 otherwise
(l = 1, . . . , C).
(2)
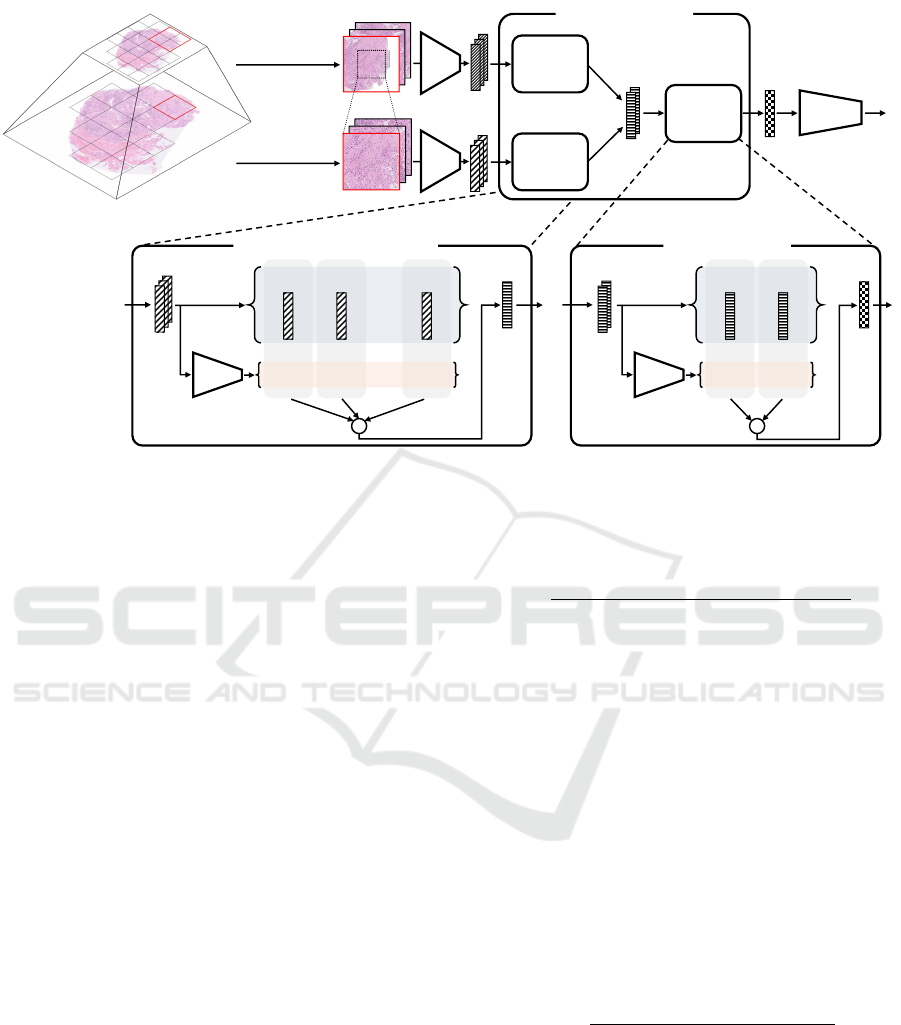
3.2 Multi-Scale Attention Assembler
Network
Figure 2 shows the structure of the MSAA-Net. The
proposed method predicts the labels by processing the
target WSIs in the order of feature extraction, feature
aggregation, and classification. In the feature aggre-
gation, we introduce the two-stage feature aggrega-
tion mechanism with the region aggregators for each
Multi-Scale Feature Aggregation Based Multiple Instance Learning for Pathological Image Classification
621
MLP
(
)
(
)
×
(
)
(
)
×
+
(
)
,
(
)
(
)
(
)
MLP
(
)
(
)
(
)
(
)
×
(
)
(
)
×
(
)
(
)
×
+
(
)
patch
images
at scale
(
)
patch
images
at scale
classifier
(
)
feature aggregator
(
)
,
(
)
(
)
(
)
(
)
region
aggregator
at scale
region
aggregator
at scale
scale
aggregator
WSIs
region aggregator at scale
scale aggregator
Figure 2: Illustration of the structure of the proposed MSAA-Net.
scale and the scale aggregator serially for achieving
the multi-scale analysis strategies. In the first stage,
the region aggregators, which are independent in each
scale, calculate the attention weights corresponding to
the extracted features from each scale viewpoint. By
the weighted sum, the region aggregators calculate
region-level features for each scale focusing on the
crucial features. In the second stage, the scale aggre-
gator calculates the attention weights of the region-
level features for each scale adaptively depending on
the classification target. The scale aggregator calcu-
lates the WSI-level feature highlighting the scale used
for the classification.
The MSAA-Net extracts the image patch-level
features with dimension M given as follows:
h
(s
j
)
ik
= F
(s
j
)
x
(s
j
)
ik
, (3)
where F
(s
j
)
(·) is the feature extractor that is a neural
network, with scale s
j
.
The region aggregators calculate the M dimen-
sional scale-level feature z
(s
j
)
i
by each scale-weighted
sum as follows:
z
(s
j
)
i
=
N
(s
j
)
∑
k=1
a
(s
j
)
ik
h
(s
j
)
ik
, (4)
where a
(s
j
)
ik
is the attention weight; the higher its
value, the higher is the importance of the correspond-
ing feature h
(s
j
)
ik
for classification. The attention
weight a
(s
j
)
ik
is calculated from the features by the
multi-layer perceptron (MLP) for each scale as fol-
lows:
a
(s
j
)
ik
=
exp{w
(s
j
)
T
tanh
V
(s
j
)
h
(s
j
)
T
ik
}
∑
N
(s
j
)
l=1
exp{w
(s
j
)
T
tanh
V
(s
j
)
h
(s
j
)
T
il
}
, (5)
where w
(s
j
)
and V
(s
j
)
are L × 1 and L × M dimen-
sional trainable parameters of the MLP for each scale,
respectively.
The scale aggregator calculates the WSI-level fea-
ture z
i
using the weighted sum in the same way as the
region aggregator as follows:
z
i
=
S
∑
k=1
a
(s
k
)
i
z
(s
k
)
i
. (6)
The attention weight a
(s
k
)
i
indicates the contribution
factor to the WSI-level feature for each scale. In par-
ticular, the attention weight a
(s
k
)
i
calculated by the
MLP as follows:
a
(s
k
)
i
=
exp{w
T
tanh
V z
(s
k
)
T
i
}
∑
S
j=1
exp{w
T
tanh
V z
(s
j
)
T
i
}
, (7)
where w and V are L × 1 and L × M dimensional
trainable parameters of the MLP, respectively, whose
values are different from those given by Equation 5.
The probabilities of the labels
ˆ
Y
i
=
ˆ
Y
i1
, . . . ,
ˆ
Y
iC
predicted by a linear classifier P(·) is given by
ˆ
Y
i
= P (z
i
)
= wz
i
+ b,
(8)
ICPRAM 2023 - 12th International Conference on Pattern Recognition Applications and Methods
622
(a)
5x 10x 20x
5x 10x 20x
TCGA-LUAD
1
224 pixels
224 pixels
(b)
benign: 5x benign: 10x benign: 20x
malignant: 5x malignant: 10x malignant: 20x
private-LUAD
1
224 pixels
224 pixels
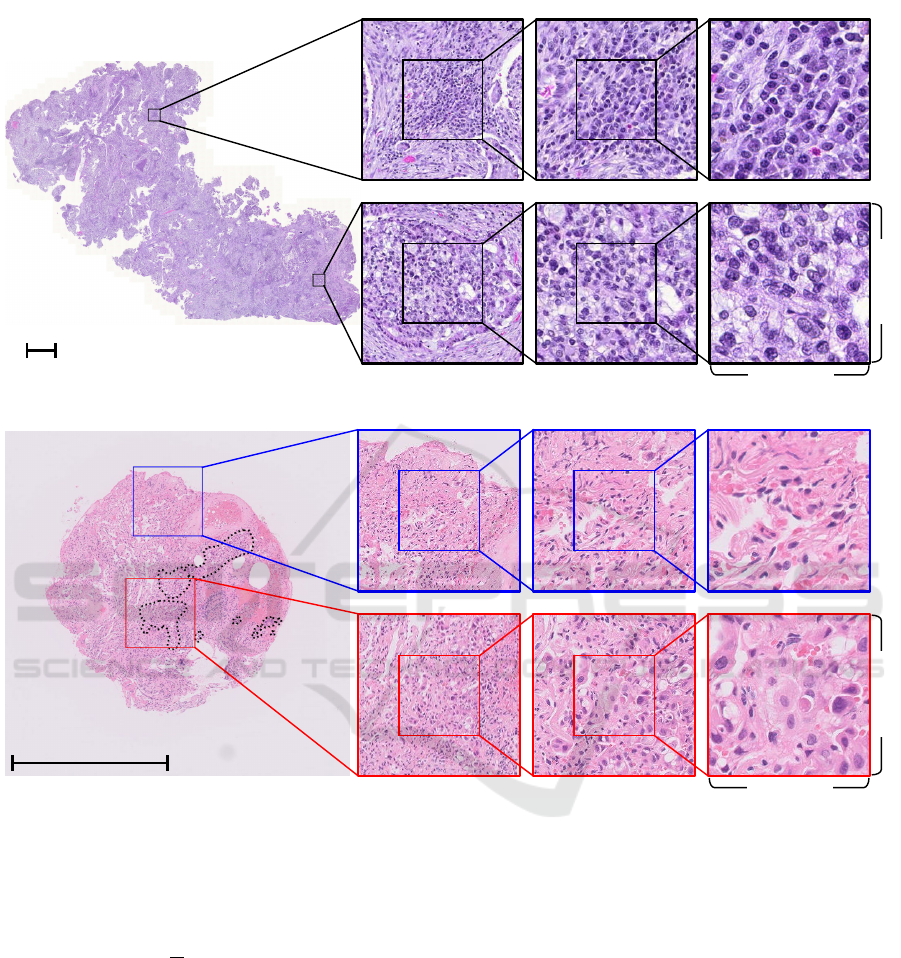
Figure 3: (a) WSI contained in TCGA-LUAD dataset. (b) WSI contained in private-LUAD dataset.
where w and b are weight and bias, respectively.
During training, the MSAA-Net is optimized by
minimizing the cross-entropy loss as follows:
L = −
1
N
N
∑
i=1
C
∑
l=1
Y
il
log
ˆ
Y
il
. (9)
4 EXPERIMENT
4.1 Dataset
We evaluated the performance of the proposed
method through experiments based on the two
datasets: the cancer genome atlas lung adenocarci-
noma (TCGA-LUAD) (Albertina et al., 2016) dataset
and the private lung adenocarcinoma (private-LUAD)
dataset.
Both datasets comprised 20x and 10x magnifi-
cations, 0.5 and 1.0 micrometers per pixel, respec-
tively. We selected those scales because they made
the best performance in the preliminary experiment.
We divided the WSIs at the 20x magnification into
224 × 224 pixel image patches. In addition, we only
considered image patches whose background region
ratio was more than 40%. Furthermore, we divided
the WSIs at the 10x magnification into 224 × 224
pixel image patches. The image patches at the 10x
magnification were cropped from the center of the im-
age patches at the 20x magnification. Thus, the num-
ber of image patches was the same for both magnifi-
cations for each WSI.
Multi-Scale Feature Aggregation Based Multiple Instance Learning for Pathological Image Classification
623
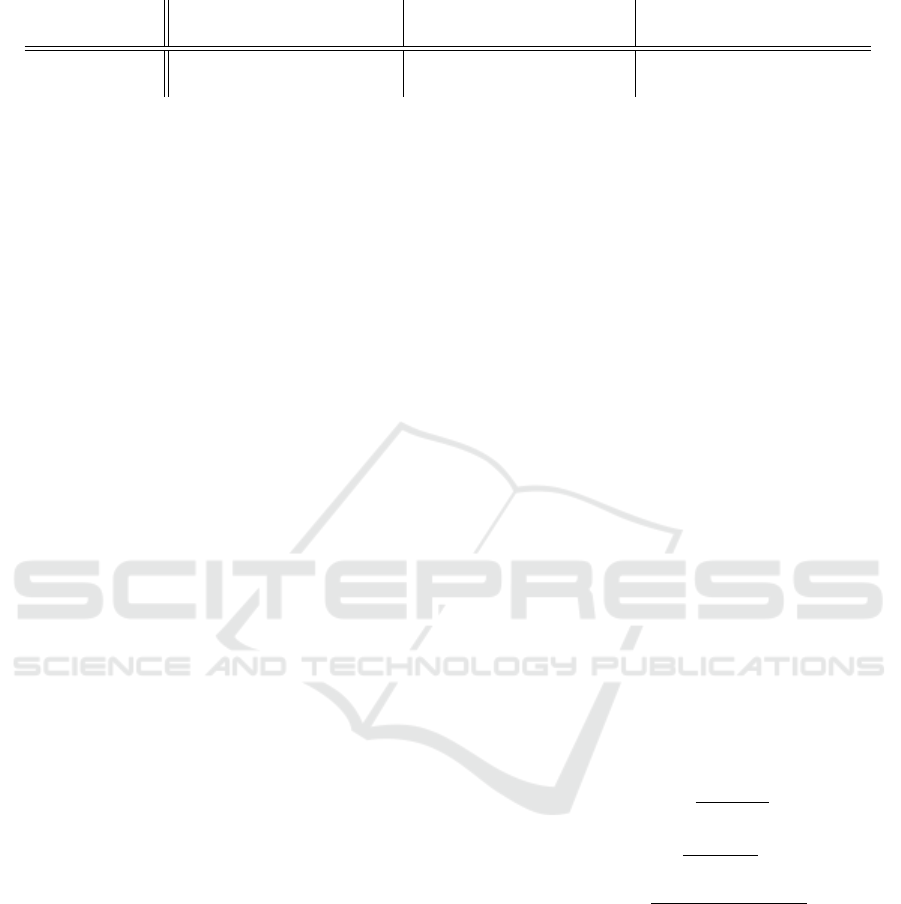
Table 1: Assignment of the WSIs in both datasets for the experiments.
Training set Validation set Test set
Dataset All Negative Positive All Negative Positive All Negative Positive
TCGA-LUAD 208 122 86 27 16 11 124 37 87
private-LUAD 717 359 358 80 39 41 93 45 48
4.1.1 TCGA-LUAD Dataset
We obtained the TCGA-LUAD dataset from the WSIs
published in the TCGA project. Moreover, we al-
located the WSIs containing adenocarcinoma of the
lung as positive data and those not containing it as
negative data. Figure 3(a) shows the WSI contained in
the TCGA-LUAD dataset. The figure to the left is the
overall of the WSI. In contrast, the figures to the right
are the patch images with 5x, 10x, and 20x magnifica-
tions of the two distant regions. The WSI contained in
the TCGA-LUAD dataset is relatively large, and the
pathologist confirmed for the WSI that the regions of
the suspected cancers are observed overall. In con-
trast, the figures to the right are the patch images with
5x, 10x, and 20x magnifications of the two different
diagnosis regions. The WSI contained in the TCGA-
LUAD dataset is relatively large, and the cancerous
regions are observed overall. We randomly divided
the 359 WSIs into the training set and test set with
65:35 ratios. Then, we used 10% of the WSIs from
the training set as the validation set.
4.1.2 private-LUAD Dataset
In contrast, we created the private-LUAD dataset
from the WSIs provided by cooperating medical in-
stitutions. The private-LUAD dataset was developed
from biopsy materials. Therefore, the cancer regions
are small in the WSIs, and the classification of the
WSIs in the private-LUAD dataset is more challeng-
ing than that of the TCGA-LUAD dataset. We allo-
cated the WSIs containing adenocarcinomas of the
lung as positive data and those not containing it as
negative data in a similar way to the TCGA-LUAD
dataset. Figure 3(b) shows the WSI contained in the
private-LUAD dataset. The figure to the left is the
overall WSI. The private-LUAD dataset is attached
pixel-level annotations by the pathologists for analy-
sis (not used for training), unlike the TCGA-LUAD
dataset. The regions enclosed by dotted lines were di-
agnosed with adenocarcinoma. In contrast, the figures
to the right are the patch images with 5x, 10x, 20x
magnifications of the two different diagnosis regions.
The WSI contained in the private-LUAD dataset are
relatively small, and the cancerous regions are small.
We randomly divided the 863 WSIs into the training
set and test set with 90:10 ratios. Then, we used 10%
of the WSIs from the training set as the validation set.
Additionally, we increased the positive class WSIs by
27 at the training set by the augmentation because the
number of WSIs for each class is in-balanced. As the
augmentation, we randomly rotate the tissue region
separated from the background with a 1 to 360-degree
range and paste the rotated tissue regions to the white
background.
Table 1 shows the number of WSIs for each set
used for the experiments of both datasets.
4.2 Comparative Methods and
Evaluation Metrics
We conducted two types of experiments. First, we
compared the performance of the proposed MSAA-
Net with that of single-scale methods to ascer-
tain the effectiveness of the multi-scale approach.
In this regard, we implemented a DA-MIL net-
work (Hashimoto et al., 2020).
Second, we validated the ability of the feature ag-
gregation mechanism of the MSAA-Net. Therefore,
we compared the performance of the DSMIL, the MS-
DA-MIL network, and the MSAA-Net. We used the
DA-MIL network trained by the first experiments as
the feature extractor of these models.
We used precision, recall, and F1 score as evalua-
tion metrics. These metrics are calculated as follows:
Precision =
T P
T P + FP
, (10)
Recall =
T P
T P + FN
, (11)
F1 score =
2Precision × Recall
Precision + Recall
, (12)
where TP, FP, and FN are the number of true posi-
tives, false positives, and false negatives, respectively.
The true positive indicates the positive WSIs that cor-
rectly predicted positive WSIs by the classification
method. Then, the false positive indicates the nega-
tive WSIs that incorrectly predicted the positive WSIs
by the classification method. Finally, the false nega-
tive indicates the positive WSIs that incorrectly pre-
dicted the negative WSIs by the classification method.
A high value of F1 score implies both a low cancer-
overlooked and over-detection rate. In the second ex-
periment, we evaluate the performance by the aver-
age and standard deviation of each evaluation metric
ICPRAM 2023 - 12th International Conference on Pattern Recognition Applications and Methods
624

by the five-trials. Those trials were conducted by the
five-set of the training set and validation set, each con-
taining the no duplicated WSIs for each trials.
4.3 Implementation Details
In a comparison experiment with the single-scale
methods, we used the same training data style as
that of the DA-MIL network paper(Hashimoto et al.,
2020). Additionally, we applied the model structure
of the DA-MIL network in the same setting as that of
the DA-MIL network paper too. Therefore, we hired
the feature extractor composed of VGG16(Simonyan
and Zisserman, 2015) and two linear layers. Then,
we applied VGG16 obtained from trained DA-MIL
network as the feature extractors of the MSAA-Net,
DSMIL, and MS-DA-MIL network.
In a comparison experiment with the multi-scale
methods, we applied the model structure of the MS-
DA-MIL network in the same setting as that of the
MS-DA-MIL network paper(Hashimoto et al., 2020).
Then, except for the feature extractor of the DSMIL,
we used the original model structure to the DSMIL(Li
et al., 2021a).
In MSAA-Net, we used the same feature extrac-
tor F
(s
j
)
(·) structure as the DA-MIL. In addition, the
structure of the region aggregator for each scale and
the scale aggregator are the same. Those aggregators
are composed of the linear layer, Tanh activation, lin-
ear layer, and softmax function serially and calculate
the attention weights. Finally, we used the single lin-
ear layer as the classifier P(·).
We trained all model with the automatic mixed
precision, gradient accumulation, and Adam opti-
mizer. We set 16 to the mini-batch size substantially.
The number of training epochs is set to 50 and 100 for
the comparison experiment in the single-scale meth-
ods and multi-scale methods, respectively.
4.4 Results
Table 2 lists the classification results of the single-
scale method and the proposed method. The proposed
method performed equal or better in each metric than
that of the conventional method in both datasets. In
particular, the proposed method exhibited an 18.5%
higher F1 score than that of the DA-MIL network with
20x in the private-LUAD dataset. Thus, we confirmed
that the multi-scale WSIs could provide high cancer
detection ability.
Table 3 lists the averages and standard deviations
of metrics by the five-trials as the evaluation results
obtained by the proposed method and the conven-
tional methods with the multi-scale approach. The
results of the TCGA-LUAD dataset, the average num-
ber of misclassified WSIs, are 4.8, 5.6, and 5.2
at DSMIL, MS-DA-MIL, and MSAA, respectively.
That difference between the method is under one.
Therefore, although slight differences were observed,
all methods accurately classified the TCGA-LUAD
dataset.
In contrast, in the private-LUAD dataset, the F1
score of the proposed method was higher than that of
the conventional methods. In particular, the F1 score
of the proposed method was 10.7% higher than that
of the DSMIL. Furthermore, the MSAA-Net consid-
erably improved the recall performance, which was
20% higher than that of the DSMIL and 6.3% higher
than that of the MS-DA-MIL. The classification of
the WSIs in the private-LUAD dataset is more diffi-
cult than that of the TCGA-LUAD dataset because the
cancerous regions in the WSIs in the private-LUAD
dataset are small as shown in Figure 3. However, the
proposed method performed higher than the conven-
tional method.
According to these results, the proposed method
diagnosed with fewer overlooks than that of the
conventional methods. Consequently, the proposed
method achieves a high cancer diagnosis performance
because of the feature aggregation mechanism consid-
ering the multi-scale structures.
5 DISCUSSION
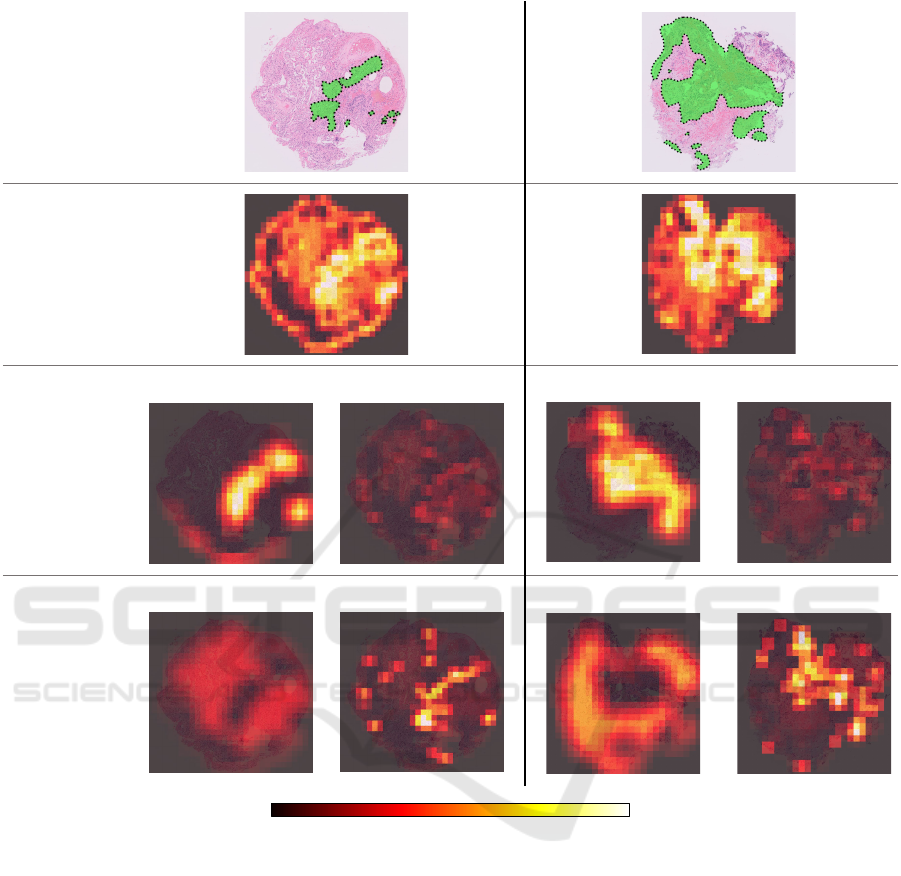
Figure 4 shows the WSIs contained in the test set of
the private-LUAD dataset and attention maps of the
attention weights for the corresponding regions. The
ground truth images show the WSIs corresponding
to the test data that all methods predicted as cancer.
In the images, the green regions enclosed by dotted
lines indicate the cancer regions diagnosed by pathol-
ogists. Moreover, the remaining images are the at-
tention maps produced by the DSMIL, MS-DA-MIL
network, and MSAA-Net. The attention maps imply
that the brighter the regions, the higher is the cancer
probability. Note that, because of the difference in
the feature aggregation mechanism of each method,
the DSMIL shows the attention map per region, and
the MS-DA-MIL network and the MSAA-Net show
the attention maps per region for each scale.
The attention maps are significantly different al-
though all methods predict correctly. The attention
maps of the DSMIL and MS-DA-MIL network at the
10x magnification show the cancer regions as the high
attention weights. The attention weights of the pro-
posed network were assigned to different regions de-
pending on the scales. In particular, the high values on
Multi-Scale Feature Aggregation Based Multiple Instance Learning for Pathological Image Classification
625
Table 2: Results of the conventional single-scale method DA-MIL network and the proposed method MSAA-Net applied to
two datasets.
Dataset Method magnifications F1 Precision Recall
DA-MIL
20x 0.966 0.955 0.977
TCGA-LUAD 10x 0.971 0.977 0.966
MSAA-Net(ours) 20x-10x 0.971 0.988 0.954
DA-MIL
20x 0.750 0.625 0.938
private-LUAD 10x 0.847 0.973 0.750
MSAA-Net(ours) 20x-10x 0.935 0.977 0.896
Table 3: Results of the conventional multi-scale methods and the proposed method MSAA-Net applied to two datasets.
Dataset Method F1 Precision Recall
DSMIL 0.973 ± 0.004 0.973 ± 0.011 0.973 ± 0.012
TCGA-LUAD MS-DA-MIL 0.968 ± 0.008 0.970 ± 0.011 0.966 ± 0.014
MSAA-Net(ours) 0.970 ± 0.007 0.975 ± 0.016 0.966 ± 0.014
DSMIL 0.774 ± 0.084 0.994 ± 0.011 0.642 ± 0.114
private-LUAD MS-DA-MIL 0.857 ± 0.043 0.963 ± 0.034 0.779 ± 0.082
MSAA-Net(ours) 0.881 ± 0.031 0.928 ± 0.062 0.842 ± 0.039
the 20x magnification were assigned to the cancer re-
gions. This is because the region aggregators with the
different trainable parameters for each scale learned a
different unique role. In addition, the scale aggrega-
tor determined the scale with the appropriate role for
classification from the region-level features for each
scale. The region aggregators performed the appro-
priate task for each scale, and the scale aggregator
adaptively assigned the contributions. The MSAA-
Net achieved a high classification ability.
In the DSMIL, the attention weights are compar-
atively high over all the specimens. Therefore, the
weights do not adequately work because they indi-
cate various non-cancerous regions. Additionally, in
the MS-DA-MIL network, the attention weights at
the 20x magnification are substantially low. Thus,
the MS-DA-MIL network could classify using a 10x
magnification only, although it used the multi-scale
WSIs.
From the attention map, we confirmed that the
appropriate scale for observation depended on the
histopathological features. Thus, we also confirmed
that the scale that should be used for classification dif-
fers from the classification target.
6 CONCLUSION
This study has proposed the MSAA-Net that can con-
sider the multi-scale structure of the WSIs for classifi-
cation. The MSAA-Net adopted the two-stage feature
aggregation mechanisms with different roles to obtain
the features suitable for the classification according to
each scale. In the first stage, the region aggregator
focuses on the crucial regions for the classification.
In the second stage, the scale aggregator decides the
scale that should be used for the classification.
The experiments indicated that the multi-scale ap-
proach was more effective than the single-scale ap-
proach. Additionally, the MSAA-Net outperformed
the conventional multi-scale methods in the challeng-
ing classification of the WSIs in the private-LUAD
dataset. We confirmed that the feature aggregation
mechanism of the MSAA-Net considers the multi-
scale WSIs appropriately.
In the feature, we plan to analyze the attention
maps based on the point of pathological view. Par-
ticularly, we will check if the attention maps obtained
by the experiment, whose attention regions are differ-
ent for each scale, can be explained based on the point
of pathological view. In addition, we should consider
the mechanism for the explainability of the attention
maps.
ACKNOWLEDGEMENTS
The authors thank Prof. Junya Fukuoka and Dr.
Wataru Uegami from Nagasaki University Gradu-
ate School of Biomedical Sciences for providing the
dataset and medical comments. Computational re-
source of AI Bridging Cloud Infrastructure (ABCI)
provided by the National Institute of Advanced In-
dustrial Science and Technology (AIST) was used.
This study is based on results obtained from the
project JPNP20006, commissioned by the New En-
ergy and Industrial Technology Development Orga-
nization (NEDO). This study has been approved by
ICPRAM 2023 - 12th International Conference on Pattern Recognition Applications and Methods
626
attention weight0 1
DSMIL 10x:20x
Ground truth
20x
10x
MSAA-Net (ours)
20x10x
MS-DA-MIL
20x10x
20x
10x
Figure 4: WSIs contained in the test set of the private-LUAD dataset and the attention maps obtained from each method.
the National Institute of Advanced Industrial Science
and Technology research ethics committee (I2021-
0212-A). The results here are in whole or part based
upon data generated by the TCGA Research Network:
https://www.cancer.gov/tcga.
REFERENCES
Albertina, B., Watson, M., Holback, C., Jarosz, R.,
Kirk, S., Lee, Y., Rieger-Christ, K., and Lem-
merman, J. (2016). The cancer genome atlas
lung adenocarcinoma collection (tcga-luad) (ver-
sion 4) [data set]. The Cancer Imaging Archive.
https://doi.org/10.7937/K9/TCIA.2016.JGNIHEP5.
Andrews, S., Tsochantaridis, I., and Hofmann, T. (2002).
Support vector machines for multiple-instance learn-
ing. In Advances in Neural Information Processing
Systems, volume 15, pages 577–584. MIT Press.
Campanella, G., Hanna, M. G., Geneslaw, L., Miraflor, A.,
Werneck Krauss Silva, V., Busam, K. J., Brogi, E.,
Reuter, V. E., Klimstra, D. S., and Fuchs, T. J. (2019).
Clinical-grade computational pathology using weakly
supervised deep learning on whole slide images. Na-
ture medicine, 25(8):1301–1309.
Chen, R. J., Chen, C., Li, Y., Chen, T. Y., Trister, A. D.,
Krishnan, R. G., and Mahmood, F. (2022). Scaling vi-
sion transformers to gigapixel images via hierarchical
self-supervised learning. In Proceedings of the IEEE
Conference on Computer Vision and Pattern Recogni-
tion, pages 16144–16155. IEEE.
Multi-Scale Feature Aggregation Based Multiple Instance Learning for Pathological Image Classification
627

Dietterich, T. G., Lathrop, R. H., and Lozano-P
´
erez,
T. (1997). Solving the multiple instance problem
with axis-parallel rectangles. Artificial intelligence,
89(1):31–71.
Feng, J. and Zhou, Z.-H. (2017). Deep miml network. In
Proceedings of the Thirty-First AAAI conference on
artificial intelligence, pages 1884–1890. MIT Press.
Hashimoto, N., Fukushima, D., Koga, R., Takagi, Y., Ko,
K., Kohno, K., Nakaguro, M., Nakamura, S., Hon-
tani, H., and Takeuchi, I. (2020). Multi-scale domain-
adversarial multiple-instance cnn for cancer subtype
classification with unannotated histopathological im-
ages. In Proceedings of the IEEE Conference on Com-
puter Vision and Pattern Recognition, pages 3852–
3861. IEEE.
Herrera, F., Ventura, S., Bello, R., Cornelis, C., Zafra, A.,
S
´
anchez-Tarrag
´
o, D., and Vluymans, S. (2016). Multi-
instance Regression, pages 127–140. Springer.
Ilse, M., Tomczak, J., and Welling, M. (2018). Attention-
based deep multiple instance learning. In Proceed-
ings of the 35th International Conference on Machine
Learning, volume 80, pages 2127–2136. PMLR.
Li, B., Li, Y., and Eliceiri, K. W. (2021a). Dual-stream mul-
tiple instance learning network for whole slide image
classification with self-supervised contrastive learn-
ing. In Proceedings of the IEEE Conference on Com-
puter Vision and Pattern Recognition, pages 14318–
14328. IEEE.
Li, J., Li, W., Sisk, A., Ye, H., Wallace, W. D., Speier, W.,
and Arnold, C. W. (2021b). A multi-resolution model
for histopathology image classification and localiza-
tion with multiple instance learning. Computers in bi-
ology and medicine, 131:104253.
Maron, O. and Lozano-P
´
erez, T. (1997). A framework for
multiple-instance learning. In Advances in Neural In-
formation Processing Systems, volume 10, pages 570–
576. MIT Press.
Pinheiro, P. O. and Collobert, R. (2015). From image-level
to pixel-level labeling with convolutional networks.
In Proceedings of the IEEE Conference on Computer
Vision and Pattern Recognition, pages 1713–1721.
IEEE.
Shao, Z., Bian, H., Chen, Y., Wang, Y., Zhang, J., Ji, X., and
zhang, y. (2021). Transmil: Transformer based corre-
lated multiple instance learning for whole slide image
classification. In Advances in Neural Information Pro-
cessing Systems, volume 34, pages 2136–2147. MIT
Press.
Simonyan, K. and Zisserman, A. (2015). Very deep con-
volutional networks for large-scale image recognition.
In Proceedings of the International Conference on
Learning Representations.
Wilson, M. L., Fleming, K. A., Kuti, M. A., Looi, L. M.,
Lago, N., and Ru, K. (2018). Access to pathology
and laboratory medicine services: a crucial gap. The
Lancet, 391(10133):1927–1938.
ICPRAM 2023 - 12th International Conference on Pattern Recognition Applications and Methods
628
