Machine Learning Based Prediction of Vulnerability Information Subject
to a Security Alert
Ryu Watanabe
1
, Takashi Matsunaka
1
, Ayumu Kubota
1
and Jumpei Urakawa
2
1
KDDI Research, Inc., Saitama, Japan
2
KDDI Digital Security Inc., Tokyo, Japan
Keywords:
Security Measure, Vulnerability Management, Security Alert, Machine Learning.
Abstract:
The security alerts announced by various organizations can be used as an indicator of the severity and danger of
vulnerabilities. The alerts are public notifications issued by security-related organizations or product/software
vendors. The experts from such organizations determine whether it is a necessity of a security alert based on
the published vulnerability information, threats, and publicized damages caused by the attacks to warn the
public of high-risk vulnerabilities or cyberattacks. However, it may take some time between the disclosure of
the vulnerability and the release of a security alert. If this delay can be shortened, it will be possible to guess
the severity of the vulnerability earlier. For this purpose, the authors have proposed a machine learning method
to predict whether a disclosed vulnerability is severe enough to publicize a security alert. In this paper, our
proposed scheme and the evaluation we conduct to verify its accuracy are denoted.
1 INTRODUCTION
In recent years, the use of ICT has been advanc-
ing in various fields, and many business operations,
services, seminars, and classes are being conducted
and provided online. However, at the same time,
the damage caused by computer viruses, malware,
and ransomware is increasing. There are many re-
ports about cyberattacks by using exploited vulnera-
bilities in server systems, networks devices, and ap-
plications, such as the use of illegally hijacked servers
as jump hosts or information theft. Since end of the
2019, new coronavirus infections (COVID-19) have
been rampant worldwide, and the online world has be-
come even more advanced. As a result, previously un-
seen attacks and problems have become apparent, and
the importance of security measures in system opera-
tions is increasing. Information about vulnerabilities
and their threats are reported daily such as National
Vulnerability Database (NVD)
1
, Japan Vulnerability
Note (JVN)
2
, VulDB
3
, and measures against vulnera-
bilities are also disclosed on the websites. However, it
is very difficult to collect all of these pieces of infor-
mation promptly, determine the danger and severity,
1
https://nvd.nist.gov/
2
https://jvn.jp/
3
https://vuldb.com/
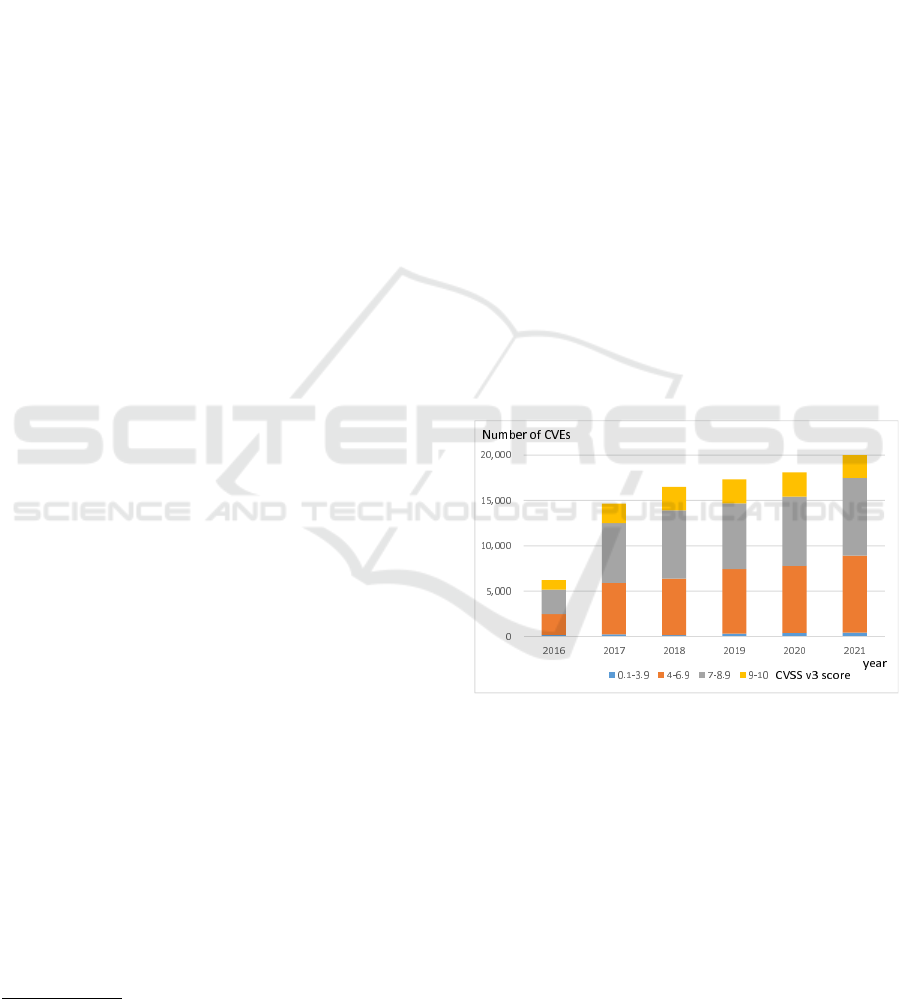
Figure 1: Number of reported vulnerabilities (CVE).
and then take actual measures. The number of vulner-
abilities reported is very large.
Figure 1 shows the number of vulnerability in-
formation registered in the NVD. The number of re-
ported vulnerabilities increased rapidly in 2017 and
had reached over 20,000 in 2021. The colored bands
in the bar chart in the figure show the distribution
of common vulnerability scoring system (CVSS) v3
(FIRST, 2019) scores, an indicator of the severity of
vulnerabilities. For the year 2021, there are about
2,700 vulnerabilities scored from 9 to 10 that are clas-
sified as critical. In addition, it is reported that half
of the exploited codes appear within two weeks af-
ter the vulnerability is disclosed(KENNA Security,
Watanabe, R., Matsunaka, T., Kubota, A. and Urakawa, J.
Machine Learning Based Prediction of Vulnerability Information Subject to a Security Alert.
DOI: 10.5220/0011613700003405
In Proceedings of the 9th International Conference on Information Systems Security and Privacy (ICISSP 2023), pages 313-320
ISBN: 978-989-758-624-8; ISSN: 2184-4356
Copyright
c
2023 by SCITEPRESS – Science and Technology Publications, Lda. Under CC license (CC BY-NC-ND 4.0)
313

2018). Therefore, for security measures, it is im-
portant to collect information on vulnerabilities and
threats appropriately and take immediate action.
The Technical Report on Vulnerability Re-
sponse(Kurotani and Kameyama, 2019, Sect. 2.2.2)
lists vulnerability information, the latest news, ven-
dor sites, and security alerts from public organiza-
tions as information to be obtained. If many pieces of
the information can be quickly collected and properly
utilized, early measures can be taken before security
risks become apparent. A security alert is a public no-
tification issued by security-related organizations or
vendors. Typically, experts from such organizations
take the time to manually determine whether it is a ne-
cessity of a security alert based on the published vul-
nerability information, threats, and damages caused
by the attacks to warn the public of high-risk vulnera-
bilities or cyberattacks. In some cases, system admin-
istrators review their security measures after receiv-
ing a security alert. Therefore, security alerts are one
of the necessary pieces of information for prioritizing
vulnerabilities to be addressed. However, concerning
the publication of security alerts, it takes some time
(few hours or few days long) after a certain vulnera-
bility is disclosed before a security alert based on that
vulnerability is published due to the careful consid-
erations by security experts. If this time gap can be
eliminated, it will be an advantage for security mea-
sures. In addition, when a vulnerability is disclosed,
if it can be determined whether the vulnerability is se-
rious enough to warrant a security alert of public au-
thorities, we can recognize it as a critical vulnerability
that causes harmful damage.
For this reason, the authors have proposed a
method to estimate the severity of vulnerability infor-
mation using machine learning as a method to sup-
port security measures. Our proposal applies the past
alerts and the vulnerability information as labels and
training data and uses machine learning to determine
whether a new vulnerability is a necessity of a se-
curity alert. In this paper, we describe the proposed
method and also report on the evaluation test con-
ducted to assess its accuracy. In the actual application
of machine learning estimation, the present and fu-
ture are predicted from past facts. Therefore, we also
conduct evaluations using training and test data at dif-
ferent periods to know the more accurate performance
of the proposed method.
2 RELATED WORK
The Common Vulnerability Exposure (CVE)(Mann
and Christey, 1999) has been established to facilitate
the sharing of vulnerability information. With this
CVE, each vulnerability is currently managed by as-
signing a unique CVE-ID (ex. NVD, JVN). In addi-
tion to CVE, the Common Vulnerability Scoring Sys-
tem (CVSS) is widely used to evaluate the severity of
vulnerabilities. In CVSS, quantitative scoring meth-
ods are defined, but the calculation of the CVSS ba-
sic values uses such information that the ease of at-
tacks and the value of the information assets to be
protected and does not take into account whether the
related attacks are actually in the wild or not. There-
fore, the policy of prioritizing the vulnerabilities with
high CVSS scores is ineffective in dealing with actual
malicious attacks. To deal with this problem, methods
that take into account the possibility of the generation
of exploit codes that may cause damage to the IT sys-
tem have been studied (Bozorgi et al., 2010; Sabottke
et al., 2015; Xiao et al., 2018; Jacobs et al., 2021;
Yosifova et al., 2021). For example, Exploit Predic-
tion Scoring System (EPSS) (Jacobs et al., 2021) re-
alizes a method to determine the severity of a new
vulnerability by machine learning, using the past vul-
nerability information and whether the correspond-
ing exploit code has been generated as training data.
The EPSS has achieved a Receiver Operating Char-
acteristic Area Under Curve (ROC–AUC) of 0.838
and Precision Recall Area Under Curve (PR–AUC)
of 0.266 in the evaluation. In addition to the studies,
machine learning methods have been used for various
vulnerability responses(Yosifova et al., 2021; Liakos
et al., 2020). For example, they have been used to
classify CVE assigned classes(Yosifova et al., 2021),
and the evaluations have shown that they are suitable
methods for automated vulnerability type classifica-
tion. Although such studies and research have been
conducted, there has been no study on determining
the severity of vulnerabilities using machine learning,
with an index based on whether the vulnerability is
subject to a security alert issued by a public organiza-
tion.
3 SETUP FOR PREDICTING THE
SEVERITY OF
VULNERABILITY
INFORMATION
In this section, our proposed method for predicting
whether or not a vulnerability has a severity that war-
rants a security alert determined by security experts is
described. Specifically, the acquisition and process-
ing of various data as preparation, the machine learn-
ing algorithm used are denoted.
ICISSP 2023 - 9th International Conference on Information Systems Security and Privacy
314

3.1 Security Alert and Vulnerability
Information for Machine Learning
In Japan, three representative public organizations
publish security alerts. They are Information-
technology Promotion Agency, Japan (IPA)
4
,
National Police Agency
5
, and Japan Computer
Emergency Response Team Coordination Center
(JPCERT/CC)
6
. One of them, JPCERT/CC, has
been publishing alerts since 1997, and we use it as
a label for our prediction using machine learning.
The VulDB contains not only vulnerabilities but
also threats such as the release of exploit codes,
addition to vulnerabilities, so we decided to use it as
training data in this study because it provides more
information than the CVE descriptions alone.
3.2 Model Construction
In this section, the creation of label data and feature
vectors, which was conducted in preparation for an
evaluation of the machine learning model, and the
evaluation result are described.
3.2.1 Creation of Label
The acquired information on the security alerts was
formatted into JSON format and then used as label
data for machine learning. The text below shows a
sample of the created label. The title is written in
Japanese in the original. The details are also written
in Japanese and omitted here.
{
" da te ": "20 19 -01 -09" ,
" ti t l e " : " Januar y 2 0 19 Microsoft S e c u r i t y
Up d a t e A lert ( P u blished )" ,
" detai l s ": " < om iss i on >" ,
" li nk ": "/ at / 2 0 17/ at 1 70001 . tx t " ,
" cve_i d s ": [
" CVE -2 019 -0 565 " ,
" CVE -2 019 -0 568 " ,
" CVE -2 019 -0 547 " ,
" CVE -2 019 -0 567 " ,
" CVE -2 019 -0 550 " ,
" CVE -2 019 -0 551 " ,
" CVE -2 0 1 9 -0 5 39"
]
}
4
https://www.ipa.go.jp/security/announce/alert.html
5
https://www.npa.go.jp/cyberpolice/
6
https://www.jpcert.or.jp/
3.2.2 Creation of Feature Vector
The following process was applied to the obtained
vulnerability information records to create a feature
vector.
(1) Documentation
• Creating JSON documents by combining en-
try.title, entry.summary, and entry.details items
for records retrieved from VulDB
• Removing records that do not contain a CVE
number and duplicates
(2) Labeling
• Assigning “1” if the CVE number in the vul-
nerability information document is included in
the alert label data, or “0” if it is not (For the
training data, labels of alerts were given for the
same period as the training data. For the test
data, labels were given using all the data pe-
riod.)
(3) Normalization
• Removing symbols
7
• Removing stop words
• Removing short lives words such as “year”,
“Microsoft Windows update number”, and
“version number”
• Converting a word to its original form
• Lowercasing words
(4) Vectoriazation
• Vectorization the above documents using BoW
(Bag of Words)
• To reduce the dimensionality of the vectors, re-
moving words that appear in more than 99% of
the documents and words that appear in less
than 0.01% of the documents
The following is an example of the document cre-
ated in step (1). This document, with steps (2) and (3)
applied, is the input document for step (4).
{
" en t r y ":{
" id ": "1 4 7898 " ,
" ti t l e " : " GitL a b E nt e rprise E dition up
to 11 . 2 . x / 1 1.4. 1 2 / 1 1 . 5.5/
11 . 6 . 0 A c cess Contro l
privilege e s c a l a t i o n " ,
" timestamp ":{
" cre a t e ": "2 0 19 - 12 - 31 09: 3 0 : 01"} ,
" summa r y ": " A v u l n e r a b i lity c l a s s i f i e d
as critical < o mit >." ,
" detai l s ":{
" v u l n e r a b i lity " : " The ma n i p u l a t i o n
7
The symbols in Python string.puctuation are removed.
Machine Learning Based Prediction of Vulnerability Information Subject to a Security Alert
315
wi th an u n k n o w n < omit > . "}
},
" v u l n e r a b i lity ":{
" ri sk " :{
" va l u e " : "2" ,
" na me ": " m e d i u m "} ,
" timeline ": [{" date ": < omit >} ]} ,
" advisory " :{
" da te ": " 1 5 7 7 6 64000"} ,
" sou r c e ":{
" c ve ":{
" id ": " CVE - 2 018 -2 0 507"}}
}
Note that “summary”, “vulnerability”, which is an
element under “details” that describes the vulnerabil-
ity type, and “timeline”, which denotes the dates of
various events, are omitted in the table because of
their large amount of information.
The following is an example of feature vectors
generated by steps (1)-(4), where “id” is the id of the
VulDB, “label” means the positive or negative in the
case, and “features” shows each name and value of
the features.
id la b e l f e a t u r es
14 7 8 9 8 0 {’ ac cess ’: 0 . 2 1 1 9 99 576001272 ,
’ aff ec t ’:0.105 9 9 9 7 8 8 0 0 0 6 3 6 ,
’bug ’ : 0 . 1 0 5 99 9788000636 ,
’ c las s ify ’ : 0 . 1 0 5 9 9 9 7 8 8 0 0 06 36 ,
’ c ompo n ent ’ :0 . 105999788000636 ,
<omit >}
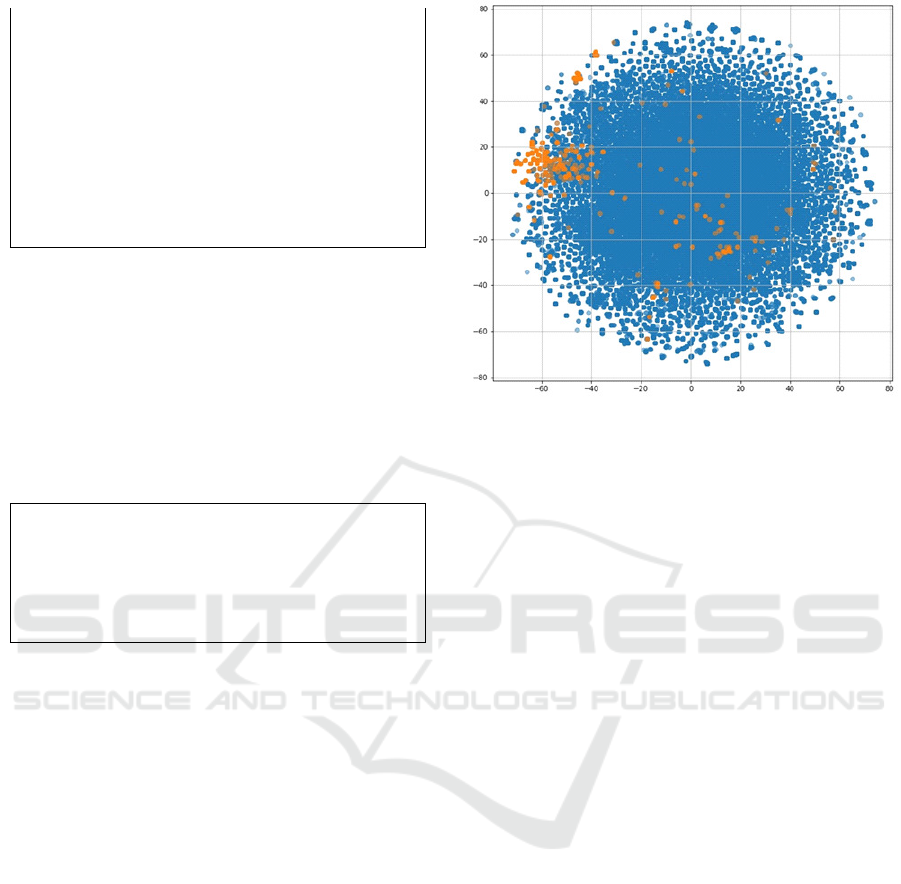
3.2.3 Visualization of Feature Vectors
The obtained feature vectors are compressed to two
dimensions using the dimensionality reduction algo-
rithm t-distributed Stochastic Neighbor Embedding
(t-SNE) (van der Maaten and Hinton, 2008) and plot-
ted in Figure 2. The fact that the “positive” points are
unevenly distributed to the left of the center in the fig-
ure confirms that there is a bias in the feature vector.
3.3 Machine Learning Algorithms
To build a model with high accuracy, cross-validation
was conducted for several learning algorithms. In this
evaluation, we used three frequently used learning
algorithms in machine learning: logistic regression
(Tolles and Meurer, 2016), random forest (Ho, 1995;
Breiman, 2001), and xgboost (Chen and Guestrin,
2016). The subject of this study is a binary classi-
fication of whether or not a security alert is applica-
ble. We selected logistic regression and random trees,
which are suited for the purpose and based on dif-
ferent algorithms. The logistic regression is a model
based on a statistical regression algorithm, while the
random forest is based on the decision tree algorithm.
˖SRVLWLYH
˖QHJDWLYH
Figure 2: 2-dimensionally compressed feature vector by t-
SNE.
Xgboost, an advanced form of random trees, was then
adopted for comparison.
4 EVALUATION
In this section, we denote evaluations and the results.
Using the created label data and feature vectors, we
evaluated the prediction of vulnerability information
subject to a security alert by machine learning. Table
1 shows the parameters used in the model evaluation.
ROC–AUC, PR–AUC, and F–score are used as eval-
uation metrics.
4.1 Model Comparison
As a first evaluation, we compare the performance of
the three models.
Evaluation Result
The ROC–AUC and PR–AUC of the evaluation re-
sults for each model are shown in Table 2. The max-
imum F–score of each model is shown in the same
table and the recall and precision at the point are also
denoted. In this evaluation, the following points are
confirmed. On the ROC–AUC, it is 0.939 for the lo-
gistic regression, and those are 0.963 and 0.960 for
the random forest and xgboost, respectively. On the
PR–AUC, there is variability. As the mean value
of five trials, it is 0.415 for logistic regression and
those are 0.624 and 0.633 for random forest and xg-
boost, respectively. On the F–score, the maximum
value is 0.591 for the logistic regression, and those
ICISSP 2023 - 9th International Conference on Information Systems Security and Privacy
316
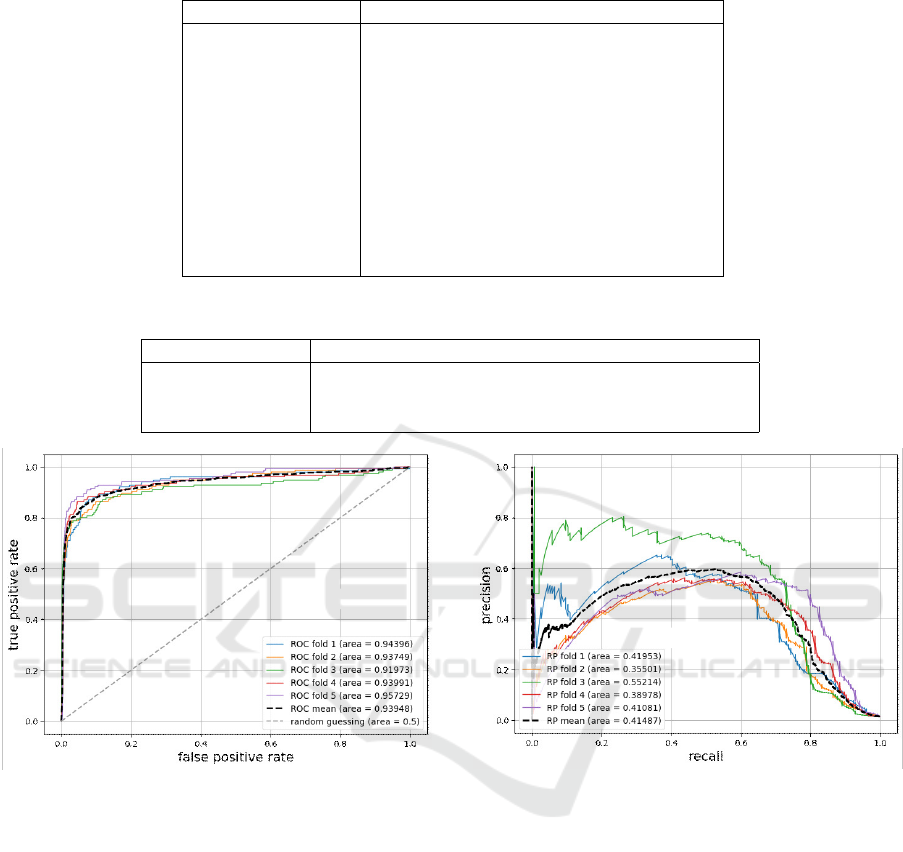
Table 1: Specification of machine learning model evaluation.
parameter description
Data period Jan. 2017 – Dec. 2019
Number of data 52,113 (positive: 778, negative: 51,335)
Learning algorithm logistic regression, random forest, xgboost
Hyperparameter logistic regression: C, penalty
random forest: max depth, n estimatiors
xgboost: max depth, learning rate,
n estimatiors
Tuning auto tuning with hyperopt
Evaluation method 5-fold cross validation
Evaluation metrics ROC (Receiver Operator Characteristic),
PR (Precision - Recall), F–score
Table 2: Evaluation results.
algorithm ROC–AUC PR–AUC F recall precision
logistic regression 0.939 0.415 0.591 0.650 0.542
random forest 0.963 0.624 0.619 0.512 0.783
xgboost 0.960 0.633 0.642 0.578 0.723
/RJLVWLFUHJUHVVLRQ
Figure 3: ROC curve for logistic regression.
are 0.619 and 0.642 for random forest and xgboost,
respectively.
The ROC and PR curves for each model are shown
in Figures 3 to 8. As for the trend of the PR curve, the
logistic regression shows that the precision reaches
the maximal when the recall is around 0.5. In the ran-
dom forest and xgboost, there is a decreasing trend.
Especially in the case of xgboost, the curve decays
more gently down to about 0.7 of recall than in the
case of random forest. This indicates that xgboost has
the most stable performance among the three algo-
rithms.
/RJLVWLFUHJUHVVLRQ
Figure 4: PR curve for logistic regression.
4.2 Evaluation of Training Data and
Test Data at Different Periods
To validate the more realistic performance of the
model, we evaluated by differencing the period of
training and test data. In this evaluation, we used the
xgboost algorithm, which showed the most stable per-
formance in the fold cross-validation among the three
algorithms. Table 3 shows how the training data and
test data are divided. In this evaluation, the periods of
the training data and the test data are separated so that
the training data does not contain information for the
period corresponding to the future to be evaluated.
Machine Learning Based Prediction of Vulnerability Information Subject to a Security Alert
317
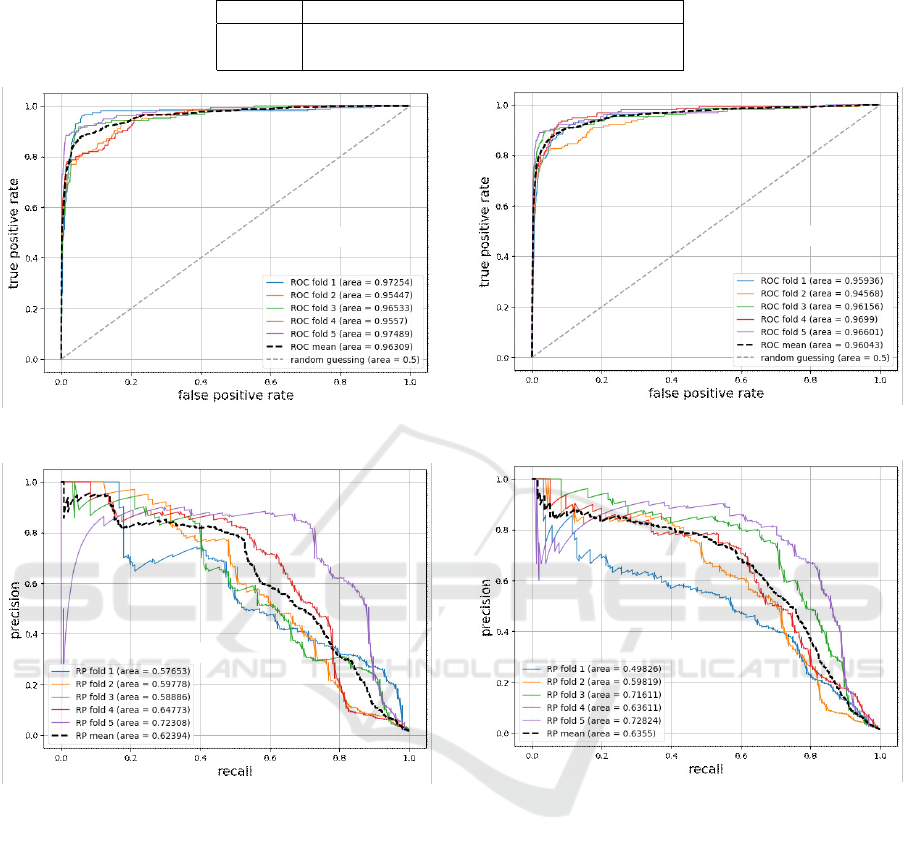
Table 3: Data period.
data period positive negative
training Jan. 2017 – Dec. 2018 519 32,646
test Jan. 2019 – Dec. 2019 259 18,689
5DQGRPIRUHVW
Figure 5: ROC curve for random forest.
5DQGRPIRUHVW
Figure 6: PR curve for random forest.
Evaluation Result (Data Period Split)
The results of the evaluation are shown in table 4. It
is confirmed that the ROC–AUC, PR–AUC, and the
maximum F–score are comparable to those of the pre-
vious evaluation. The ROC and PR curves in this
evaluation are shown in Figure 9 and Figure 10.
4.3 Discussion
From the evaluation results shown in Table 2, there
is no significant difference between the three ma-
chine learning algorithms in the ROC–AUC evalua-
tion. However, in the PR–AUC evaluation, random
forest and xgboost perform better than logistic regres-
sion does. This result indicates that the tendency of
the feature vectors in this evaluation fits better with
;JERRVW
Figure 7: ROC curve for xgboost.
;JERRVW
Figure 8: PR curve for xgboost.
the decision tree-based algorithm than with the statis-
tical regression-based algorithm. In addition, overall,
the xgboost shows more stable performance than the
other two algorithms.
From the evaluation results shown in Table 4, it is
confirmed that the performance is maintained in the
evaluation when the training and test data periods are
separated, compared to the previous evaluation. From
the PR–AUC curve shown in Figure 10, it is con-
firmed that when the recall is 80%, the precision is
a little over 30% for the correct response rate. The tri-
angle in the figure indicates the point. In the case of
actual operation, it is necessary to judge whether the
vulnerability information reported in the present is se-
vere enough to warrant an alert. Therefore, this value
is more substantive when it is used realistically. For
the sake of comparison, the recall and precision of the
ICISSP 2023 - 9th International Conference on Information Systems Security and Privacy
318
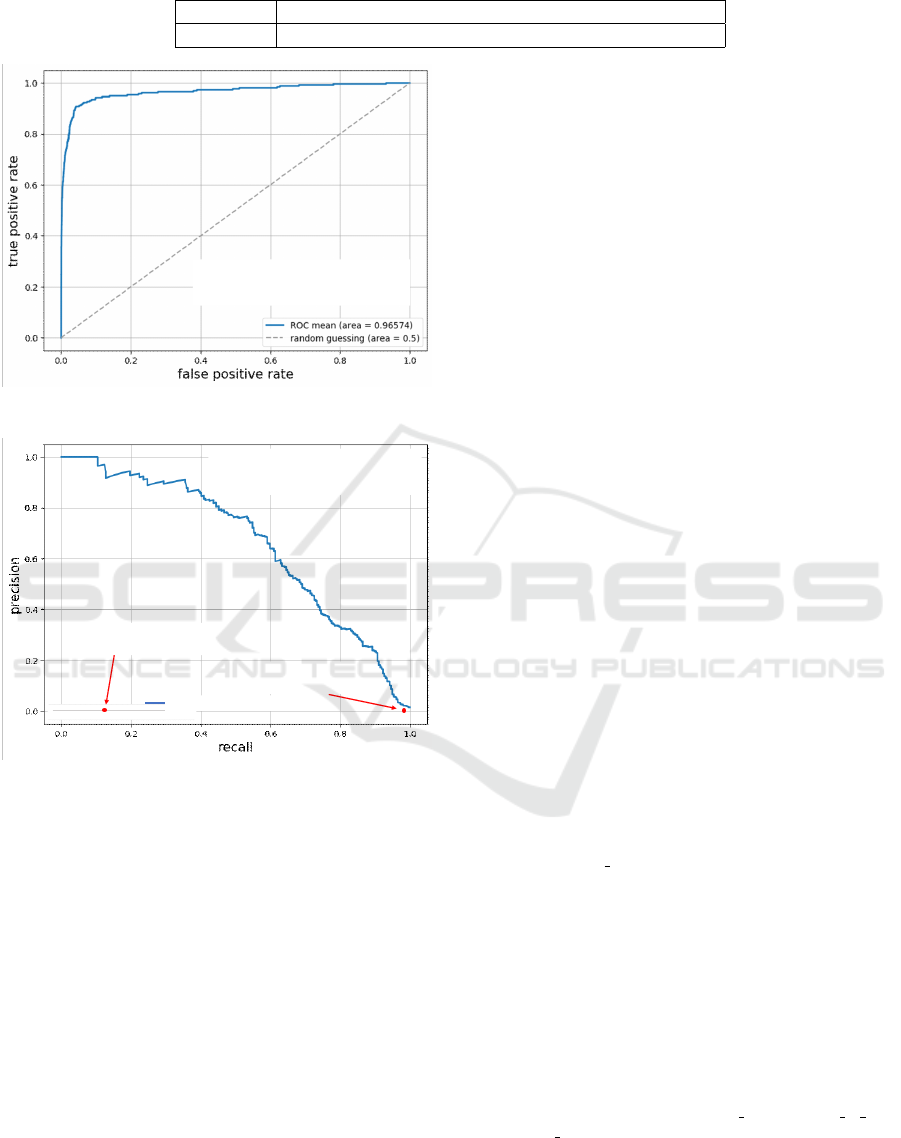
Table 4: Evaluation results (data period split).
algorithm ROC–AUC PR–AUC F recall precision
xgboost 0.966 0.660 0.625 0.541 0.741
;JERRVW
7UDLQLQJGDWDSHULRG
7HVWGDWDSHULRG
Figure 9: ROC curve for xgboost (data period split).
;JERRVW
7UDLQLQJGDWDSHULRG
7HVWGDWDSHULRG
&966Y+LJK
UHFDOOSUHFLVLRQ
&966Y&ULWLFDO
UHFDOOSUHFLVLRQ
%ODQN
53PHDQDUHD
˝
Figure 10: PR curve for xgboost (data period split).
cases using CVSSv3 in the same period are also plot-
ted with closed circles in the figure. If we use “High”
or higher (CVSSv3 score of 7 or higher), the recall is
as high as 97%, but the precision is about 2%, which
is inefficient. In the case of “Critical” (CVSSv3 score
of 9 or higher), the recall is just over 10% and the
precision is about 1%, which is unworthy. Therefore,
our proposed method can be used as an indicator for
prioritizing vulnerability measures.
5 CONCLUSION
In this paper, we propose a method using machine
learning to identify vulnerability information with a
severity equivalent to a security alert on the site of
a security organization, to support security measures.
In the evaluation test using the xgboost as the algo-
rithm, we confirm the performance of more than 0.96
in ROC–AUC and more than 0.63 in PR–AUC, in-
cluding the case where the period of training data and
test data are different. The authors expect that our
proposed method will contribute to rapid vulnerabil-
ity response and reduction of operational burden.
ACKNOWLEDGMENT
Part of this research includes the results of a contract
with the Ministry of Internal Affairs and Communi-
cations (MIC) for “A demonstration experiment on
highly accurate severity and reliability assessment of
vulnerability information”. We would like to express
our gratitude for the support.
REFERENCES
Bozorgi, M., Saul, L. K., Savage, S., and Voelker, G. M.
(2010). Beyond heuristics: learning to classify vul-
nerabilities and predict exploits. In Proc. 16th ACM
SIGKDD international conference on Knowledge dis-
covery and data mining, pages 105–114. ACM.
Breiman, L. (2001). Random forests. Machine Learning,
45:5–32.
Chen, T. and Guestrin, E. C. (2016). Xgboost: A scalable
tree boosting system. In KDD ’16: Proceedings of
the 22nd ACM SIGKDD International Conference on
Knowledge Discovery and Data Mining, pages 785–
794. ACM.
FIRST (2019). Common vulnerability scor-
ing system version 3.1specification docu-
ment. https://www.first.org/cvss/v3-1/cvss-v31-
specification r1.pdf.
Ho, T. K. (1995). Random decision forests. In Proceedings
of 3rd International Conference on Document Analy-
sis and Recognition, volume 1, pages 278–282 vol.1.
IEEE.
Jacobs, J., Romanosky, S., Edwards, B., Adjerid, I., and
Roytman, M. (2021). Exploit prediction scoring sys-
tem (epss). Digital Threats: Research and Practice,
2:1–17.
KENNA Security (2018). PRIORITIZATION to PRE-
DICTION Analyzing Vulnerability Remediation
Strategies (https://website.kennasecurity.com/wp-
content/uploads/2020/09/kenna Prioritization to Pred
iction vol1.pdf).
Kurotani, Y. and Kameyama, T. (2019). How to effectively
implement vulnerability countermeasures (practical)
2nd edition. IPA Technical Watch, Information-
technology Promotion Agency, Japan.
Machine Learning Based Prediction of Vulnerability Information Subject to a Security Alert
319

Liakos, K. G., Georgakilas, G. K., Moustakidis, S., Sklavos,
N., and Plessas, F. C. (2020). Conventional and ma-
chine learning approaches as countermeasures against
hardware trojan attacks. Microprocessors and Mi-
crosystems, 79:103295.
Mann, E. D. and Christey, M. S. (1999). Towards a com-
mon enumeration of vulnerabilities. In 2nd Workshop
on Research with Security Vulnerability Databases.
IEEE.
Sabottke, C., Suciu, O., and Dumitras, T. (2015). Vulner-
ability disclosure in the age of social media: Exploit-
ing twitter for predicting real-world exploits. In Proc.
24th USENIX Security Symposium (USENIX Security
’15), pages 1041–1056. USENIX.
Tolles, J. and Meurer, W. J. (2016). Logistic Regression:
Relating Patient Characteristics to Outcomes. JAMA,
316(5):533–534.
van der Maaten, L. and Hinton, G. E. (2008). Visualizing
data using t-sne. Journal of Machine Learning Re-
search, 9:2579–2605.
Xiao, C., , Sarabi, A., Liu, Y., Li, B., Liu, M., and Du-
mitras, T. (2018). From patching delays to infection
symptoms: using risk profiles for an early discovery
of vulnerabilities exploited. In Proc. 27th USENIX Se-
curity Symposium (USENIX Security ’18), pages 903–
918. USENIX.
Yosifova, V., Tasheva, A., and Trifonov, R. (2021). Predict-
ing vulnerability type in common vulnerabilities and
exposures (cve) database with machine learning clas-
sifiers. In 2021 12th National Conference with Inter-
national Participation (ELECTRONICA), pages 1–6.
ICISSP 2023 - 9th International Conference on Information Systems Security and Privacy
320
