
On the Application of Short-Term Heart Rate Variability Indices to
Track Changes in Cognitive Arousal
Mahtab Mohammadpoor Faskhodi
a
and Miquel Angel García-González
b
Group of Biomedical and Electronic Instrumentation, Department of Electronic Engineering,
Universitat Politècnica de Catalunya, BARCELONATECH (UPC), C/Jordi Girona, 1-3, Barcelona, Spain
Keywords: Arousal, Short-Term HRV Analysis, Stroop Test.
Abstract: Studies have demonstrated that Heart Rate Variability (HRV) can be utilized as an effective tool for
monitoring the level of arousal. The autonomic nervous system (ANS) is frequently measured by heart rate
and principally controlled by the coordinated parasympathetic and sympathetic systems, which also regulate
fluctuations in arousal. In HRV studies short-term analysis is more affordable and easier to measure rather
than long-term analysis. Here, to track arousal changes, 31 participants (18 male and 13 female) with a mean
age of 32 years were examined in both relaxed and aroused stages. Relax and arousal states are measured in
two stages, each lasting five minutes. Relaxed status was carried out with closed eyes and listening to nature
sounds. The arousal status was performed by playing a Stroop test while listening to traffic noise or death
metal music. After data acquisition, 28 HRV features are calculated for each five-minute epoch. The
observations have demonstrated that novel indices such as FnQ and ACI produced better results in arousal
detection by using short-term (5 min) HRV analysis among all of the obtained indices. Moreover, the
performance of ACI was significantly superior to the rest since it is a robust and easy-to-compute index.
Consequently, ACI can be used as a powerful tool for monitoring cognitive arousal.
1 INTRODUCTION
In general terms, arousal is defined as a brain
activation caused by the interaction of a person with
the surrounding environment (Egeth & Kahneman,
1975). Arousal is crucial in controlling
consciousness, attention, alertness, and information
processing since it is essential for driving specific
activities, including mobility, pursuing nutrition,
activating fight-or-flight responses, and engaging in
sexual activities (Georgiadis & Kringelbach, 2012).
The arousal systems include activation of the
ascending reticular activating system (ARAS) in the
brain, which stimulates cortical activation
represented as rapid EEG activity, and descending
networks, which stimulate sensory-motor activation
reflected as high electromyographic activity which is
projected to the spinal cord. The arousal components
are located within the brainstem, thalamus,
hypothalamus, and basal forebrain. They use a variety
of substances as modulators or neurotransmitters. As
a
https://orcid.org/0000-0001-7918-345X
b
https://orcid.org/0000-0002-8043-4794
a result, they are complex but massively redundant
because it may not be necessary for one particular
brain system to maintain alertness (Jones, 2003). The
autonomic nervous system (ANS), which is primarily
regulated by the balanced activity of the
parasympathetic and sympathetic systems, is often
quantified by heart rate (HR), and galvanic skin
response (GSR), respectively, which regulates
fluctuations in arousal (Wang et al., 2018) as well.
There are three various types of arousal: Cognitive
arousal, affective or emotional arousal, and physical
arousal. Since emotions profoundly affect cognitive
processes, emotional arousal is often considered
cognitive arousal. This study considers changes in
cognitive arousal.
The instantaneous heart rate (HR), which is the
frequency of repetition of each cardiac cycle is
typically represented in heartbeats per minute and is
generated by the recurrent depolarization of the SA
node. On the other hand, the variability of the
intervals between subsequent heartbeats is the basis
Mohammadpoor Faskhodi, M. and García-González, M.
On the Application of Short-Term Heart Rate Variability Indices to Track Changes in Cognitive Arousal.
DOI: 10.5220/0011611400003414
In Proceedings of the 16th International Joint Conference on Biomedical Engineering Systems and Technologies (BIOSTEC 2023) - Volume 1: BIODEVICES, pages 99-107
ISBN: 978-989-758-631-6; ISSN: 2184-4305
Copyright
c
2023 by SCITEPRESS – Science and Technology Publications, Lda. Under CC license (CC BY-NC-ND 4.0)
99
for the analysis of heart rate variability (HRV). These
intervals are known as RR intervals because the most
prominent wave from the ECG, the R wave, is used
as the marker of consecutive heartbeats. HRV is
considered an established method of assessment of
neurocardiac function that reflects the interactions
between the heart and brain as well as dynamic, non-
linear ANS processes. The balance between the two
main branches of ANS, sympathetic and
parasympathetic systems affects the stability of the
time interval between heartbeats. Therefore, HRV has
been widely utilized as a non-invasive method to
evaluate the function of the ANS (Pumprla et al.,
2002), (Shaffer & Ginsberg, 2017). During a relaxed
state, the parasympathetic is predominant and this
increases HRV while during an arousal state the
sympathetic activity rises and causes a decrease in
HRV (Acharya et al., 2006). The reason for using
short-term HRV here is that, although long-term
HRV (24 h) assessment has more predictive value, it
has not been widely incorporated into mainstream
medical treatment or personal health monitoring due
to the increasing costs of monitoring patients during
a long period (Chen et al., 2020). In HRV analysis,
indices are defined for time domain, frequency
domain, and non-linear dynamics measurements.
Time domain indices statistically characterize the
amount of HRV detected over monitoring intervals
that can range from <1 min to 24 h. The absolute or
relative quantity of signal energy inside component
bands is calculated using frequency domain data. The
unpredictability and complexity of a series of inter-
beat intervals (IBIs) are quantified by non-linear
metrics (Shaffer & Ginsberg, 2017). Additionally,
recent innovations in methodology have produced
positive outcomes in HRV investigations.
This work aims to find which indices that are most
sensitive to changes in cognitive arousal. Here, we
employed some novel features along with well-
known HRV features to track changes in cognitive
arousal status in short-term analysis.
2 STUDY PROTOCOL
2.1 Data Acquisition
In this study, 31 participants (18 male and 13 female)
with a mean age of 31.80 years and standard deviation
age of 10.28 years were recruited for the experiment.
Before taking part in this investigation, informed
consent was obtained from all participants involved
in the study which was conducted according to the
guidelines of the Declaration of Helsinki, and
approved by the local Ethics Commission for Human
Experimentation. To track the effect of arousal on the
human body, the experimental setup is designed to
induce changes in arousal in a laboratory setup using
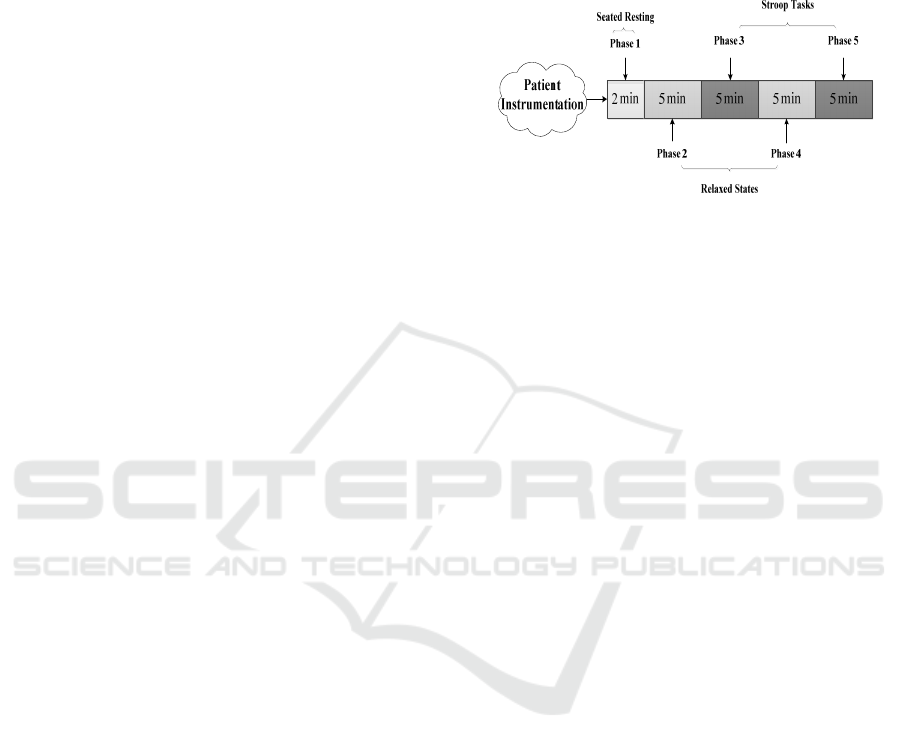
the following stages which are also shown in figure 1.
Figure 1: The block diagram of data acquisition.
Phase 1) Seated Resting
This phase consists of a recording for 2 min allowing
physiological adaptation, and it is not included in the
analysis. Before the start of recording, which initiates
at the beginning of this phase, the subject is seated
while the different sensors are attached. Seated
resting is commonly used as the resting or baseline
condition in psychophysiological reactivity studies
(Cacioppo, J. T. et al., 1998).
Phase 2) Relaxing State
At this level, participants listened to nature sounds for
5 min while keeping their eyes closed and were
instructed to breathe at will but try to maintain a slow
breathing rate. Paced breathing is often employed to
maximize respiratory sinus arrhythmia, which is
associated with decreased HR and increased vagally
mediated HRV measures (Vaschillo et al., 2006) but
has been not used because the task to synchronize the
breathing with an external stimulus can generate
unwanted arousal.
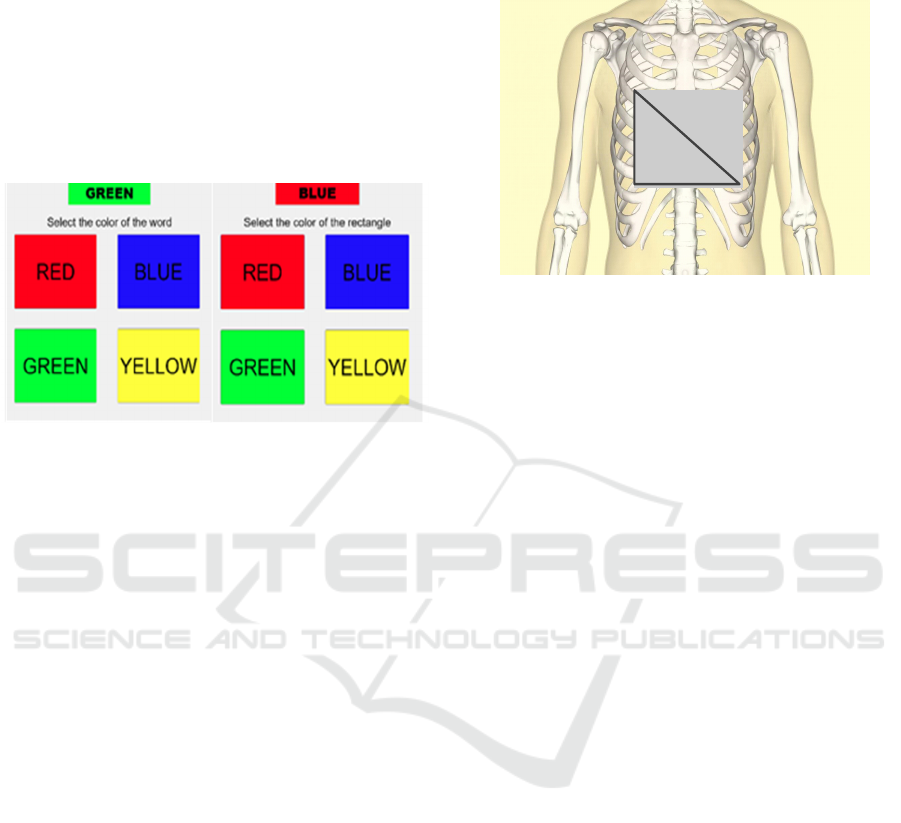
Phase 3) Stroop Task
To activate arousal, participants were presented with
a series of words in different colors, which is called
the Stroop test. They are instructed to select, as
rapidly as possible, on a computer screen and using a
mouse in the dominant hand, the color (either red,
blue, green, or yellow) that corresponds to a printed
word. The printed word is contained inside a
rectangle with a color that can be the same as the
printed word (color-word match) or not (color-word
mismatch). The selection task is repeated during the
5 minutes that correspond to this phase. As the time
since the beginning of this phase progresses, the
probability of color-word mismatch increases. To
implement the Stroop test MATLAB® Software was
BIODEVICES 2023 - 16th International Conference on Biomedical Electronics and Devices
100

utilized (See figure 2 a). During the test, the subject
is listening to traffic jam noise.
Phase 4) Relaxing Status
As in phase 2, in the fourth phase, participants had
been instructed to breathe slowly with closed eyes
while listening to nature sounds for 5 min.
Phase 5) Second Stroop Task
In the fifth phase, the Stroop test has been done for
the second time. However, the only difference
between this phase and phase 3 is that subject should
select the color of the rectangle instead of the color of
the word (See figure 2 b). The task is repeated for 5
minutes and the probability of color-word mismatch
also rises with time. During this task, the volunteers
listen to a death metal track.
Although not analyzed in this work, during each
phase of the relaxing status and Stroop task, at the
middle and the end of the task, voluntary saliva
swallowing was instructed for each subject when
hearing a gong sound embedded with the music,
traffic jam and nature sounds tracks. This reflex
associated with swallowing saliva will be analyzed in
future studies.
2.1.1 Data Collection Equipment
A Biopac MP36 acquisition unit (BIoPAC MP36
Product Sheet, 2016) is used for relevant bio-signals.
ECG, PPG, EMG, and breathing were simultaneously
sampled at 1 kHz. In this work, we focus only on the
ECG signal to be applied to recognize arousal status,
and accordingly the description of the remaining
signals such as EMG to track swallowing and thoracic
effort to track breathing is not presented.
Since a high-quality signal is required for
performing HRV analysis, data acquisition protocol,
filtering, artifact detection, and correction, all play a
key role. To achieve this, for ECG signal acquisition
the following configuration is considered,
Gain:1000
Low-pass cut-off frequency: 35 Hz
High-pass cut-off frequency: 5 Hz
Sampling frequency: 1000 Hz
For the ECG we have used the standard lead II
and accordingly, three electrodes have been attached
to the right arm (RA), left leg (LL), and right leg (RL)
as seen in figure 3. The relatively high value (as
compared with clinical ECG) of the high-pass cut-off
frequency (5 Hz) performs a pre-enhancement of the
QRS complex by reducing the amplitude of the P and
T waves and suppressing slow drifts associated with
baseline wander. On the other hand, the low value of
the low-pass cut-off frequency reduces the effect of
noise and interference. The 1 kHz sampling
frequency is considered large enough to accurately
capture the interval fluctuation between consecutive
QRS complexes.
To extract the RR time series the Kubios®
software is applied which contains two stages, pre-
processing and decision rules. The pre-processing
includes band-pass filtering of the ECG to reduce
power line noise, residual baseline wander, and other
noise components, squaring the data samples to
highlight peaks, and moving average filtering to
smooth close-by heights. The decision rules include
amplitude threshold and comparison to an expected
value between adjacent R-waves. After RR time
series extraction, the HRV indices are computed by
Kubios in the time domain such as mean RR, the
standard deviation of the IBI of normal sinus beats
(SDNN), mean heart rate (HR), the standard deviation
of heart rate (STD HR), minimum and maximum HR
(min HR and max HR), root mean square of
successive differences between normal heartbeats
(RMSSD), the number and the percentage of adjacent
NN intervals that differ from each other by more than
50 ms (NN50 and PNN50), triangular interpolation of
the NN interval histogram (TINN), Stress Index,
frequency components (VLF, LF, HF, LF/HF), and
non-linear approaches (SD1, SD2, SD1/SD2,
approximate entropy (ApEn), sample entropy
(SampEn), DFA1 and DFA2). In Kubios Software
(Mika P. Tarvainen et al., 2021), all-time domain
HRV parameters except mean RR, mean HR, and
max HR, are calculated from the detrended RR
interval data. In the frequency domain, the results for
Fast Fourier Transformation (FFT) spectrum
estimation was calculated. Before spectrum
estimation, the data were resampled at 4 Hz and
detrended using a smooth priors detrending method
with λ=500 (equivalent high pass cut-off frequency of
the time series at 0.035 Hz). The power spectrum was
estimated using Welch’s periodogram method using
a window overlap of 50%. According to (the Task
Force of the European Society of Cardiology and the
North American Society of Pacing and
Electrophysiology, 1996), the default values for the
frequency bands are VLF: 0–0.04 Hz, LF: 0.04–0.15
Hz, and HF: 0.15–0.4 Hz that are also applied in this
study. In non-linear approaches, the Poincaré plot and
the DFA results are also presented. In the Poincaré
plot, the successive RR intervals are plotted as dots
and the SD1 and SD2 variables obtained from the
ellipse fitting method are provided. In the DFA plot,
the detrended fluctuations F(n) are presented as a
function of n in a log-log scale and the slopes for the
short-term and long-term fluctuations α1 and α2,
On the Application of Short-Term Heart Rate Variability Indices to Track Changes in Cognitive Arousal
101
respectively, are indicated. Short-term fluctuations
were considered for scales between 4 and 12 beats
and long-term fluctuations were considered for scales
between 13 and 64 beats. For ApEn and SampEn, an
embedding dimension of 2 beats and a threshold of a
fifth of the standard deviation were employed. There
are some indices (kurtosis, skewness, ACI, FnQ, and
α) that are not computed by Kubios software but have
been also employed since we suspected that they can
be sensitive to arousal changes.
(a)
(b)
Figure 2: a) The Stroop test 1(Arousal task 1). b) The Stroop
test 2 (Arousal task 2).
Accordingly, the RR time series corresponding to
each phase were exported to MATLAB and these
additional indices were computed using MATLAB
functions (such as the case of kurtosis and skewness
that are included in the statistical toolbox) or
developing functions with the algorithm that
estimates the indices (such is the case of ACI, FnQ
and α that are next introduced).
Acceleration Change Index (ACI)
In 2003 García-González et al. (García-González et
al., 2003) proposed a new robust, fast, and easy-to-
use index for HRV analysis that reflects the dynamics
of the RR time series. This index characterized the
sign of the differences in a time series. The ACI is the
proportion of times that a local maximum is
immediately followed by a local minimum or vice
versa.
FnQ
Recently, fractional differintegration has been
applied as a novel technique in HRV studies. The
FnQ is a new efficient index derived from the
fractional differintegration operator that quantifies
how the time series adjust to a mono-fractal time
series model. This parameter focus on the change
with the order of the differintegration operator of the
standard deviation of the fractionally differintegrated
RR time series (García-González et al., 2013). Age,
postural changes, and paced breathing cause
significant changes in FnQ.
LL
RA
RL
Figure 3: The placement of electrodes.
Alpha (α)
García-González et al. also proposed α as the order
that minimizes the standard deviation of the
fractionally differintegrated RR time series. Due to
the obtained results, this index indicated a good
correlation with the short-term exponent achieved by
commonly used HRV parameters such as DFA,
LF/HF, and RMSDD (García-González et al., 2013).
After recovering the RR time series for each stage
(R1, R2, A1, and A2), ACI, FnQ, and α are calculated
using MATLAB, and the outcomes are taken into
account alongside the other indices derived from the
Kubios.
2.2 Results
According to the research strategy previously
described, the ECG signals of 31 subjects in arousal
and relaxed conditions are analyzed. To study arousal
by using short-term HRV analysis the mean and the
standard deviation of HRV indices in the time
domain, frequency domain, non-linear approaches,
and some novel indices (described in the previous
section) for these subjects are presented in Table 1.
The results are obtained for the four stages: Relaxing
1 (R1), Arousal 1 (A1), Relaxing 2 (R2), and Arousal
2 (A2). To determine that there is a significant
difference between these groups statistical analysis
has been carried out: two kinds of ANOVA tests (one-
and two-way) are applied by using MATLAB in this
study. The one-way ANOVA test has compared the
indices for two arousal states (relaxed R by pooling
each index for all subjects for R1 and R2 and aroused
by pooling them for all subjects and A1 and A2) and
for the four tested states (pooling the indices for all
the subjects and separately considering R1, R2, A1,
and A2). Note that if the results of the one-way
BIODEVICES 2023 - 16th International Conference on Biomedical Electronics and Devices
102

Table 1: mean ± standard deviation of HRV indices in relaxed (R1 and R2) and arousal conditions (A1 and A2).
HRV Parameter (Unit) R1 R2 A1 A2
Mean RR (ms) 773.03 ± 135.32 765.33 ± 123.46 737.68 ± 130.41 741.87 ± 123.39
SDNN (ms) 36.59 ± 17.51 35.99 ± 17.50 28.26 ± 12.90 28.68 ± 11.64
Mean HR (beat/min) 77.87± 13.95 78.43 ± 13.23 82.78 ± 14.42 81.18 ± 12.72
STD HR (ms) 3.76 ± 1.71 3.74 ± 1.72 3.13 ± 1.13 3.13 ± 1.13
Min HR (ms) 70.53 ± 12.07 70.33 ± 11.77 74.58 ± 12.02 73.17 ± 10.67
Max HR (ms) 91.48 ± 14.19 93.20 ± 13.66 95.78 ± 15.69 94.40 ± 13.56
RMSDD (ms) 32.73 ± 20.32 30.17 ± 17.33 26.99 ± 16.57 26.46 ± 14.17
NN50 53.58 ± 55.37 48.45 ± 48.84 38.45 ± 46.30 35.58 ± 39.18
PNN50 (%) 14.65 ± 16.43 12.88 ± 13.34 10.40 ± 13.44 9.47 ± 11.07
HRV triangular index 9.38 ± 3.87 9.58 ± 4.27 7.51 ± 3.35 7.71 ± 2.93
TINN (ms) 190.97 ± 86.69 185.35 ± 88.22 144.45 ± 63.38 150.94 ± 60.14
Stress Index 13.82 ± 6.79 13.93 ± 6.10 16.91 ± 6.89 16.01 ± 6.22
VLF (ms
2
) 60.96 ± 59.72 71.87 ± 104.76 32.66 ± 26.98 49.77 ± 58.54
LF (ms
2
) 850.29 ± 971.40 795.02 ± 782.01 446.01 ± 442.48 528.21 ± 440.81
HF (ms
2
) 684.58 ± 763.49 561.68 ± 593.01 338.44 ± 328.74 336.69 ±331.46
LF/HF 2.30 ± 3.67 2.79 ± 4.24 2.68 ± 3.26 2.78 ± 2.90
SD1 (ms) 23.18 ± 14.40 22.28 ± 13.73 19.11 ± 11.73 18.74 ± 10.04
SD2 (ms) 45.80 ± 21.02 45.97 ± 21.81 34.61 ± 15.05 35.60 ± 13.87
SD1/SD2 2.24 ± 0.64 2.35 ± 0.52 2.11 ± 0.76 2.13 ± 0.62
ApEn 1.13 ± 0.10 1.13 ± 0.09 1.20 ± 0.09 1.19 ± 0.08
SampEn 1.56 ± 0.27 1.51 ± 0.21 1.72 ± 0.27 1.68 ± 0.23
DFA1 1.16 ± 0.26 1.22 ± 0.22 1.15 ± 0.30 1.21 ± 0.25
DFA2 0.33 ± 0.13 0.36 ± 0.13 0.38 ± 0.13 0.36 ± 0.09
Kurtosis 3.88 ± 2.02 3.68 ± 1.21 3.70 ± 1.67 3.79 ± 1.01
Skewness 0.13 ± 0.68 0.12 ± 0.59 0.05 ± 0.68 0.04 ± 0.63
ACI 0.28 ± 0.13 0.30 ± 0.12 0.45 ± 0.13 0.4 ± 0.12
FnQ -11.21 ± 3.95 -11.54 ± 3.51 -5.60 ± 5.45 -6.37 ± 4.87
α 0.95 ± 0.40 0.98 ± 0.31 0.74 ± 0.30 0.77 ± 0.25
ANOVA test show significant differences between
arousal states can be concluded that the index has
good sensitivity to tracking arousal changes because
the observed differences between indices in the
different arousal states are large enough to be not
obscured by the inter-subject variability.
Complementing the one-way ANOVA, a two-way
analysis of variance can examine data that are
classified on two independent factors (X1=Subject,
X2=Arousal status). The results for the two-way
ANOVA tests are obtained again for two different
group classifications: Two groups (Relaxing (R) and
Arousal (A) where states R1 and R2 are pooled and
states A1 and A2 are pooled too) and four groups.
Table 2 and Table 4 respectively show the results
for the one-way ANOVA and the two-way ANOVA
using two groups for measuring the arousal change.
The results using four groups (R1, R2, A1, and A2)
can be seen in Table 3 for the one-way ANOVA and
Table 5 for the two-way ANOVA. As we can see, the
P values for the different HRV indices in Tables 3 and
5 are significantly lower than in tables 2 and 4 since
the two-way ANOVA accounts for the inter-subject
variability.
3 DISCUSSION
According to the results that are presented in the
previous section, the two-way ANOVA showed
superior performance rather than the one-way
ANOVA test since this method corrects the inter-
subject variability. Of 28 HRV indices that were
studied for two-group classification (arousal and
relaxed status), approximate entropy (ApEn), sample
entropy (SampEn), ACI, FnQ, and α have
demonstrated very significant changes caused by
arousal by using a one-way ANOVA test.
On the Application of Short-Term Heart Rate Variability Indices to Track Changes in Cognitive Arousal
103

Table 2: One-way ANOVA test results for two groups (R
and A). Indices with very significant changes caused by
arousal are written in bold (p<0.05). Indices with very
significant changes caused by arousal are written in bold.
Significances are marked for p<0.05 as + and ++ for
p<0.001.
HRV parameters P Value
Mean RR 0.2434
SDNN
+
0.0044
Mean HR 0.2501
STD HR
+
0.0168
Min HR 0.1006
Max HR 0.2831
RMSDD 0.1268
NN50 0.1029
PNN50 0.1196
HRV trian
g
ular index
+
0.0046
TINN
+
0.0033
Stress Index 0.0279
VLF
+
0.0418
LF
+
0.008
HF
+
0.0035
LF/HF 0.7676
SD1 0.0925
SD2
+
0.0012
SD1/SD2 0.1276
A
p
En
++
0.0002
Sam
p
En
++
0.0003
DFA1 0.7972
DFA2 0.172
Kurtosis 0.8976
Skewness 0.485
ACI
++
7.01e-10
FnQ
++
6.99e-10
α
++
0.0004
Indices such as Max HR, kurtosis and skewness in the
time domain, LF/HF in the frequency domain,
SD1/SD2, DFA1, and DFA2 in non-linear
approaches did not show a very significant difference
when comparing the arousal with the relaxed state.
The LF/HF, DFA1, kurtosis, and skewness do not
show significant differences at all so they can be
discarded as potential indicators of arousal changes.
Consequently, among all of the parameters ACI, and
FnQ, delivered the best results. Because FnQ is a
complex parameter to compute and ACI requires a
lower number of samples to be estimated, ACI can be
employed as an efficient index for arousal assessment
studies.
4 CONCLUSIONS
In this study, the short-term HRV analysis (5 min) has
been done for the diagnosis of arousal status. 31
subjects with states of A1, A2, R1, and R2 were
selected. Lower levels of arousal occur when
parasympathetic nervous control is greater than
sympathetic control. It means that, during relaxed
status, the parasympathetic is more activated which
increases HRV while arousal status rises sympathetic
activity and causes to decrease in HRV (Acharya et
al., 2006).
Table 3: One-way ANOVA test results for four groups (R1,
R2, A1, and A2). Indices with very significant changes
caused by arousal are written in bold. Significances are
marked for p<0.05 as
+ and ++ for p<0.001.
HRV Parameters P Value
Mean RR 0.6813
SDNN 0.0442
Mean HR 0.6717
STD HR 0.1288
Min HR 0.4058
Max HR 0.6795
RMSDD 0.4454
NN50 0.4115
PNN50 0.4344
HRV trian
g
ular index
+
0.0452
TINN
+
0.0328
Stress Index 0.1646
VLF 0.1402
LF 0.063
HF
+
0.026
LF/HF 0.9433
SD1 0.4072
SD2
+
0.0154
SD1/SD2 0.4338
ApEn
+
0.0022
Sam
p
En
+
0.0024
DFA1 0.6425
DFA2 0.4145
Kurtosis 0.9553
Skewness 0.9209
ACI
++
2.86e-08
FnQ
++
2.51e-08
α
+
0.0055
Here, 28 HRV indices include the commonly used
indices in the time domain, frequency domain, and
non-linear approaches, and some novel techniques
were obtained from the RR time series. According to
the results, approximate entropy (ApEn), sample
entropy (SampEn), and all of the new indices (ACI,
FnQ, and α) for two-group classification (relaxed and
arousal) showed very significant differences
regardless of the inter-subject variability. When
categorizing the arousal in four groups (R1, R2, A1,
and A2) only ACI and FnQ showed very significant
differences above the inter-subject variability.
Accordingly, the novel indices (ACI, and FnQ) that
BIODEVICES 2023 - 16th International Conference on Biomedical Electronics and Devices
104

are introduced by García-González et al. had better
performance among all of the parameters (in both
two- and four-group classifications) to distinguish
arousal from HRV measurements. ACI is a novel,
fast, and robust parameter for HRV analysis that
captures the dynamics of the RR time series. The sign
of differences in the RR time series can be a
promising surrogate time series to study changes in
cognitive arousal detection. For further analysis, the
use of ultra-short-term HRV analysis in real-time
assessment for arousal monitoring, which can have
more practical applicability, especially using
wearable heart rate monitoring devices, will be
considered. This future work goes in the direction of
other studies. As an example, Goldie et al. (Goldie et
al., 2010) introduced two features RRV3 values (the
variance of the past 3 RR intervals) measured in
milliseconds, and RRV8-3 values (the variance of the
past 8 RR intervals minus RRV3 values), which can
be used practically in real-time processing for arousal
detection. Also, Schaaff and Adam (Schaaff & Adam,
2013) showed that HRV indices such as PNN12,
PNN20, RMSSD, and SD1 are good candidate
features for assessment for ultra-short window sizes
such as 30 seconds
. Moreover, building subject-
dependent classifiers with the ability to distinguish
between two or more arousal levels appears to be a
potential area for future research. For instance, as
previously mentioned, ACI can be applied for ultra-
short HRV analysis in upcoming research.
Strictly speaking, a multiple-way analysis of
variance must be done using samples with a normal
distribution that shows homogeneity of the variance
among tested groups. Both homogeneity and
normality have been tested for the most significant
indices (ACI and FnQ) using the F test and the
Lilliefors' composite goodness-of-fit test. For both
indexes, the tests show homogeneous variance and
normality. Nevertheless, for other indices such as the
kurtosis, the tests show that they cannot be assumed
to be normally distributed or show variance
Table 4: Two-way ANOVA test results for two groups (R and A). Indices with very significant changes caused by arousal
are written in bold. Significance of differences are marked as n.s. for p>0.05, † for p<0.05, and ‡ for p<0.001 when analyzing
the subject as a factor of variance, and n.s. for p>0.05, + for p<0.05 and ++ for p<0.001 when analyzing the arousal as a factor
of variance.
HRV parameters P Value (subject) P Value (arousal)
Mean RR
‡,++
3.97e-52 1.80e-06
SDNN
‡,++
4.58e-26 4.86e-09
Mean HR
‡,++
1.10e-52 1.80e-06
STD HR
‡,++
8.71e-24 1.99e-06
Min HR
‡,++
1.64e-45 2.62e-08
Max HR
‡,+
0 0.001
RMSDD
‡,++
8.37e-37 1.80e-05
NN50
‡,++
1.84e-32 3.88e-05
PNN50
‡,++
2.13e-32 8.37e-05
HRV triangular index
‡,++
4.12e-20 3.79e-07
TINN
‡,++
7.81e-25 5.10e-09
Stress Index
‡,++
2.14e-32 7.62e-08
VLF
‡,++
0 1.39e-02
LF
‡,++
0 0.0006
HF
‡,++
4.59e-16 2.20e-06
LF/HF
‡,n.s.
0 0.7187
SD1
‡,++
3.23e-33 1.64e-05
SD2
‡,++
1.57e-21 3.62e-09
SD1/SD2
‡,+
0 0.0014
ApEn
‡,++
1.69e-08 8.89e-07
SampEn
‡,++
3.55e-11 2.98e-07
DFA1
‡,n.s.
0 0.6615
DFA2
‡,n.s.
0 0.0808
Kurtosis
‡,n.s.
0.0002 0.879
Skewness
‡,n.s.
0 0.2417
ACI
‡,++
5.4273e-12 1.30e-16
FnQ
‡,++
1.97e-10 1.18e-15
α
‡,++
1.44e-12 2.53e-07
On the Application of Short-Term Heart Rate Variability Indices to Track Changes in Cognitive Arousal
105

Table 5: Two-way ANOVA test results for four groups (R1, R2, A1, and A2). Indices with very significant changes caused
by arousal are written in bold. The significance of differences is marked as n.s. for p>0.05, † for p<0.05, and ‡ for p<0.001
when analyzing the subject as a factor of variance, and n.s. for p>0.05, + for p<0.05 and ++ for p<0.001 when analyzing the
arousal as a factor of variance.
HRV parameters P Value (subject) P Value (arousal)
Mean RR
‡,++
1.89e-51 1.21e-05
SDNN
‡,++
2.15e-25 1.94e-07
Mean HR
‡,++
2.41e-52 5.35e-06
STD HR
‡,++
3.87e-23 5.48e-05
Min HR
‡,++
5.11e-45 2.14e-07
Max HR
‡,+
0 2.40e-03
RMSDD
‡,++
1.85e-36 9.03e-05
NN50
‡,++
0 4.00e-04
PNN50
‡,++
0 5.00e-04
HRV triangular index
‡,++
1.35e-19 1.04e-05
TINN
‡,++
2.57e-24 1.42e-07
Stress Index
‡,++
6.10e-32 9.88e-07
VLF
‡,+
0 4.58e-02
LF
‡,+
0 6.80e-03
HF
‡,++
6.19e-16 1.95e-05
LF/HF
‡,n.s.
0 9.03e-01
SD1
‡,++
0 3.00e-04
SD2
‡,++
5.81e-21 1.48e-07
SD1/SD2
‡,n.s.
0 0.0072
ApEn
‡,++
2.46565e-08 1.56e-05
SampEn
‡,++
3.66e-11 2.52e-06
DFA1
‡,n.s.
0 1.76e-01
DFA2
‡,n.s.
0 1.97e-01
Kurtosis
‡,n.s.
3.00e-04 9.29e-01
Skewness
‡,n.s.
0 7.11e-01
ACI
‡,++
1.05522e-11 9.90e-15
FnQ
‡,++
3.11e-10 6.48e-14
α
‡,++
2.80e-12 5.87e-06
homogeneity. Future work will be devoted to
replicating the ANOVA analysis by using non-
parametric alternative statistical tests.
Furthermore, while swallowing saliva, the
parasympathetic nervous system, specifically the
vagus nerve, is inhibited. Hence, HRV analysis can
be applied to quantify the cardiovascular reflex to
swallowing saliva. By inhibiting the parasympathetic
component of the nervous system, the heart rate
increases. Therefore, in future analyses, the
relationship between swallowing saliva, HRV, and
arousal will be examined.
ACKNOWLEDGEMENTS
This work was supported by the Spanish Ministerio
de Ciencia e Innovación, project number: PID2019-
107473RB-C2.
REFERENCES
Acharya, U. R., Joseph, K. P., Kannathal, N., Lim, C. M.,
& Suri, J. S. (2006). Heart rate variability: A review.
Medical and Biological Engineering and Computing,
44(12), 1031–1051. https://doi.org/10.1007/s11517-
006-0119-0
BIoPAC MP36 Product Sheet. (2016). https://www.
biopac.com/wp-content/uploads/MP36-MP45.pdf
Cacioppo, J. T., Berntson, G. G., Malarkey, W. B., Kiecolt‐
Glaser, J. K., & Sheridan, J. F., Poehlmann, K. M.,
Glaser, R. (1998). (1998). Autonomic, Neuroendocrine,
and Immune Responses to Physiological Stree: The
Reactivity Hypothesis. Annals of the New York
Academy of Sciences, 840(1), 664–673.
Chen, Y. S., Clemente, F. M., Bezerra, P., & Lu, Y. X.
(2020). Ultra-short-term and short-term heart rate
variability recording during training camps and an
international tournament in U-20 national futsal
players. International Journal of Environmental
BIODEVICES 2023 - 16th International Conference on Biomedical Electronics and Devices
106

Research and Public Health, 17(3),1–12.
https://doi.org/10.3390/ijerph17030775
Egeth, H., & Kahneman, D. (1975). Attention and Effort. In
The American Journal of Psychology (Vol. 88, Issue 2).
https://doi.org/10.2307/1421603
García-González, M. A., Fernández-Chimeno, M.,
Capdevila, L., Parrado, E., & Ramos-Castro, J. (2013).
An application of fractional differintegration to heart
rate variability time series. Computer Methods and
Programs in Biomedicine, 111(1), 33–40.
https://doi.org/10.1016/j.cmpb.2013.02.009
García-González, M. A., Ramos-Castro, J., & Fernández-
Chimeno, M. (2003). A new index for the analysis of
heart rate variability dynamics: Characterization and
application. Physiological Measurement, 24(4), 819–
832. https://doi.org/10.1088/0967-3334/24/4/301
Georgiadis, J. R., & Kringelbach, M. L. (2012). The human
sexual response cycle: Brain imaging evidence linking
sex to other pleasures. Progress in Neurobiology, 98(1),
49–81.https://doi.org/10.1016/j.pneurobio.2012.05.004
Goldie, J., McGregor, C., & Murphy, B. (2010).
Determining levels of arousal using
electrocardiography: A study of HRV during
transcranial magnetic stimulation. 2010 Annual
International Conference of the IEEE Engineering in
Medicine and Biology Society, EMBC’10, 1198–1201.
https://doi.org/10.1109/IEMBS.2010.5625966
Jones, B. E. (2003). AROUSAL SYSTEMS. Social
Biology, 1, 438–451.
Mika P. Tarvainen, Jukka Lipponen, Juha-Pekka Niskanen,
& Perttu O. Ranta-aho. (2021). Kubios HRV Software
USER’S GUIDE. November 3, 2021, 4–39.
https://www.kubios.com/downloads/Kubios_HRV_Us
ers_Guide.pdf
Pumprla, J., Howorka, K., Groves, D., Chester, M., &
Nolan, J. (2002). Functional assessment of heart rate
variability: Physiological basis and practical
applications. International Journal of Cardiology,
84(1), 1–14. https://doi.org/10.1016/S0167-5273(02)00
057-8
Schaaff, K., & Adam, M. T. P. (2013). Measuring
emotional arousal for online applications: Evaluation of
ultra-short term heart rate variability measures.
Proceedings - 2013 Humaine Association Conference
on Affective Computing and Intelligent Interaction,
ACII 2013,362–368. https://doi.org/10.1109/ACII.2013
.66
Shaffer, F., & Ginsberg, J. P. (2017). An Overview of Heart
Rate Variability Metrics and Norms. Frontiers in
Public Health, 5(September), 1–17. https://doi.org/
10.3389/fpubh.2017.00258
Task Force of the European Society of Cardiology and the
North American Society of Pacing and
Electrophysiology. (1996). Hrv Literaturliste.
European Heart Journal, 17, 354–381.
Vaschillo, E. G., Vaschillo, B., & Lehrer, P. M. (2006).
Characteristics of resonance in heart rate variability
stimulated by biofeedback. Applied Psychophysiology
Biofeedback, 31(2), 129–142. https://doi.org/10.
1007/s10484-006-9009-3
Wang, C. A., Baird, T., Huang, J., Coutinho, J. D., Brien,
D. C., & Munoz, D. P. (2018). Arousal Effects on Pupil
Size, Heart Rate, and Skin Conductance in an
Emotional Face Task. Frontiers in Neurology,
9(December), 1–13. https://doi.org/10.3389/fneur.
2018.01029
On the Application of Short-Term Heart Rate Variability Indices to Track Changes in Cognitive Arousal
107
