
Context Discovery and Cost Prediction for Detection of Anomalous
Medical Claims, with Ontology Structure Providing Domain Knowledge
James Kemp
1 a
, Chris Barker
2 b
, Norm Good
3 c
and Michael Bain
1 d
1
School of Computer Science and Engineering, University of New South Wales, Building K17 UNSW Sydney,
Kensington NSW, Australia
2
Provider Benefits Integrity Division, Australian Government Department of Health, L10 260 Elizabeth Street,
Surry Hills NSW, Australia
3
Australian eHealth Research Centre, Commonwealth Scientific and Industrial Research Organisation, Level 7 STARS
Building - Surgical Treatment and Rehabilitation Service 296 Herston Road, Herston QLD, Australia
Keywords:
Unsupervised Machine Learning, Data Mining, Orthopedic Procedures, National Health Insurance, Fraud.
Abstract:
Medical fraud and waste is a costly problem for health insurers. Growing volumes and complexity of data
add challenges for detection, which data mining and machine learning may solve. We introduce a frame-
work for incorporating domain knowledge (through the use of the claim ontology), learning claim contexts
and provider roles (through topic modelling), and estimating repeated, costly behaviours (by comparison of
provider costs to expected costs in each discovered context). When applied to orthopaedic surgery claims, our
models highlighted both known and novel patterns of anomalous behaviour. Costly behaviours were ranked
highly, which is useful for effective allocation of resources when recovering potentially fraudulent or wasteful
claims. Further work on incorporating context discovery and domain knowledge into fraud detection algo-
rithms on medical insurance claim data could improve results in this field.
1 INTRODUCTION
Due to the beneficent nature of healthcare, providers
are generally expected to behave with integrity, per-
haps more so than in other industries (Couffinhal and
Frankowski, 2017). In practice, complex cost drivers
in the healthcare industry create opportunities for
fraudulent or wasteful conduct, and OECD healthcare
organizations typically lose 3-8% of expenditure to
fraudulent claims (Gee and Button, 2015; Couffinhal
and Frankowski, 2017). The cost of monitoring and
detecting fraud and waste can impact payer incentive
to take action, as not every investigation will result
in recovery of funds, and investigations can involve
substantial human time and expertise (Couffinhal and
Frankowski, 2017). With the ever-increasing vol-
ume of data being recorded, new approaches to data
analysis are necessary (Krumholz, 2014; Ekin et al.,
2018). Research on medical fraud detection typically
involves large amounts of data, so machine learning
a
https://orcid.org/0000-0002-1329-6707
b
https://orcid.org/0000-0003-2494-8587
c
https://orcid.org/0000-0001-6446-7644
d
https://orcid.org/0000-0002-4309-6511
approaches have been widely investigated Couffinhal
and Frankowski (2017); Ekin et al. (2018). Since
the more commonly used supervised machine learn-
ing methods require class labels, which can have a
high cost in human effort, research focus has moved
to unsupervised methods, although direct compari-
son where class labels are available shows that there
is room for improvement (Bauder and Khoshgoftaar,
2017; Ekin et al., 2018). Typically, unsupervised
methods for fraud detection depend on anomaly de-
tection, either with clustering or outlier identifica-
tion (Ekin et al., 2018). However, many studies have
focused on a single provider specialty or item.
Variation is common in medicine, and health con-
ditions, along with their presentation and treatment,
are heterogenous by nature (Ekin et al., 2018). Med-
ical insurance claim items are written to cover a va-
riety of situations in a complex, changing environ-
ment. Some items may be claimed in a variety of
medical situations, and, conversely, similar situations
may generate quite different sets of legitimate claims.
Some item specifications are written broadly and are
claimed by many providers across a range of special-
ties, whereas others are very specific and may only oc-
Kemp, J., Barker, C., Good, N. and Bain, M.
Context Discovery and Cost Prediction for Detection of Anomalous Medical Claims, with Ontology Structure Providing Domain Knowledge.
DOI: 10.5220/0011611000003414
In Proceedings of the 16th International Joint Conference on Biomedical Engineering Systems and Technologies (BIOSTEC 2023) - Volume 5: HEALTHINF, pages 29-40
ISBN: 978-989-758-631-6; ISSN: 2184-4305
Copyright
c
2023 by SCITEPRESS – Science and Technology Publications, Lda. Under CC license (CC BY-NC-ND 4.0)
29

cur infrequently. These characteristics make anomaly
detection from raw claims data difficult, because the
context in which items can and should occur (as seen
through their relationship to other items) can be diffi-
cult to determine without domain knowledge.
1.1 Challenges in Medical Claim
Anomaly Detection
Difficulties in analysing large datasets are common,
including, but not limited to, the variability of data
sources and features.
1
Despite costs in the order of
A$35 billion, and an historically low fraud detection
rate (Australian Government, 2017), relatively few
studies have examined the Australian Medicare Ben-
efits Schedule (MBS) data (Ng et al., 2010; Mendis
et al., 2011; Tang et al., 2010; Shan et al., 2008, 2009;
Hu et al., 2011; Yamanishi et al., 2004). MBS claims
have several characteristics which make anomaly de-
tection difficult, some of which may be shared across
medical claims datasets, and some which may be
unique. We note two broad categories: heterogene-
ity of the data, and information available to analysts.
1.1.1 Claim Heterogeneity
Many items, such as professional attendance items,
are ubiquitous and may be claimed in quite varied
circumstances, whereas others may be very specific
in use. There is a high degree of overlap between
many specialities and sub-specialities. Some items
allow for figurehead billing, a practice whereby the
claims of multiple providers are filed under a sin-
gle identifier (Australian Government Department of
Health, 2019). Provider claims may not be an ex-
act representation of service provided; aside from
potentially fraudulent billing practices such as up-
coding, unbundling, and bundling (Couffinhal and
Frankowski, 2017), administration errors can lead to
valid claims not being filed, incorrect items being
claimed, or claims being ascribed to the wrong pa-
tients or providers.
Practices for similar events can vary by region
or training school. For example, in surgeries in
metropolitan areas, there will usually be a trained
anaesthetist administering anaesthetic. However, in
regional areas where capacity is limited, surgeons or
other hospital staff may be cross-trained to some ex-
tent, leading to mixed types of claims. Co-claiming
some services is explicitly disallowed by the MBS,
but may be manually over-ridden by Services Aus-
tralia (an agency of the Australian Federal Govern-
1
The reader is referred to Sivarajah et al. (2017) for a
more complete discussion of big data challenges.
ment) during the claiming process in some circum-
stances.
1.1.2 Information Availability
Information relevant to verifying claims, such as pa-
tient case notes, is usually unavailable to analysts, and
an audit of the provider may be required to gain all the
relevant information. Providers have up to two years
to file a claim, so relevant information such as co-
claimed items and items claimed by other providers
for the same patient may be missing when an analysis
is conducted (Australian Government Department of
Health, 2019).
Interpreting whether an item is being claimed ap-
propriately can require domain knowledge. Admin-
istrative understanding and acceptance often moves
slower than current medical practice, leading to im-
precise or out of date mappings between claims and
the services they represent.
There is an inherent tension in the system be-
tween ensuring that services which are legitimately
required are paid for and available to all eligible per-
sons equally, and ensuring that fraudulent or wasteful
services are not unduly burdensome on the financing
of the healthcare system. Service payment is the pri-
mary focus of the MBS, and analysis for fraudulent or
wasteful services is a secondary activity. As such, the
available data is not designed for that purpose.
1.2 Research Goals
With such characteristics, identifying appropriate and
inappropriate behaviour from patterns in the data
alone is not straightforward. Ideally, an algorithm
should be able to process multiple contexts and learn
to separate them, so that similar providers are com-
pared with each other and outliers from any group
flagged. An additional concern is that unusual be-
haviour does not necessarily warrant attention. Due
to the large amount of intrinsic variation in medicine,
medical claims do not lend themselves to neat seg-
regation, and anomalies are to be expected. Audits
or other interventions can be costly, and time and re-
sources available to conduct them are limited. There-
fore, an additional driver for flagging outliers is po-
tential returns; an effective algorithm should max-
imise the return on investment in the investigation and
intervention process.
1.2.1 Graphical Association Analysis
In previous work we developed a method based on
creating directed graphs (digraphs) of association
rules for claim-item pairs, which we call Graphical
HEALTHINF 2023 - 16th International Conference on Health Informatics
30

Association Analysis (GAA). GAA was able to iden-
tify typical provider claims for joint replacement pro-
cedures, and variation from learned reference models,
across all provider roles and item types which may
be involved. In brief
2
, two-item association rules are
learned from all pairs of item codes in each set of per-
provider, per-patient claims on a single day of service.
This process is applied to each provider (creating a
model for typical claims of that provider), as well as
for the claim set as a whole (creating a typical model
across all providers). The association rules, which can
be interpreted as directed edges, are converted into
a graph structure. In the all-provider model, differ-
ent provider roles may be seen in the separate graph
components. Individual provider models are com-
pared with the closest component in the all-provider
model, and excess costs used to rank the providers
for potential recovery. In learning the provider roles
within the procedure, and the items which contribute
to those roles, this method is able to function as a
topic-modelling method, with the advantage of easy
visualisation using the graph structure which can help
with human interpretability.
While this method is generalisable to any single-
day procedure, downsides include that the context is
specified in relation to a single item – the particu-
lar procedure item under investigation. That is, it is
only able to learn the typical claim patterns for a sin-
gle procedure at a time. Using excess typical costs
as a metric meant that total recoverable costs for a
high-ranking provider were low if a provider only
performed a handful of procedures. Further work
is therefore required to compare provider behaviour
across a range of procedures, so that comparisons can
be made both within and between contexts, and to
rank providers on total recoverable costs.
1.2.2 Knowledge-Based Role and Cost Discovery
In order to achieve these goals, we incorporate do-
main knowledge in a low-effort, machine-friendly
manner by utilising the structure of the MBS ontol-
ogy in combination with topic modelling, to assist in
learning context and predict claim costs. Ontologi-
cal structures are difficult to create and maintain, but
are able to specify domain knowledge in a structure
that is simple for both humans and computers to inter-
pret, and they have become prominent in biomedical
applications (Konopka, 2015; Ivanovi
´
c and Budimac,
2014). For our purposes, the claims ontology offers
a simple way to define item relationships based on
medical reasoning, rather than attempting to find the
2
Full details of this method are currently in the publica-
tion review process.
relationships through clustering. We propose ranking
providers by the median of the difference between a
provider’s actual fees and predicted fees, weighted by
their number of procedures, in order to find behaviour
which is repeatedly costly and unusual. This method
could be useful as part of a decision support system
in two ways: it can prioritise potential targets for au-
dit, as well as identify previously unknown patterns
of potential fraud and waste for further investigation
or potential policy change.
2 RELATED WORK
Utilising methods to predict costs of claims and ex-
amine the discrepancy between actual costs has been
proposed by several authors and implemented on U.S.
Medicare and Medicaid data, with promising results.
Thornton et al. (2014) included, among other anal-
yses, a linear regression model of reimbursement
amount compared with number of claims by dentists,
with a standard deviation threshold to detect outliers.
Ko et al. (2015) performed a similar analysis on urol-
ogy claims, using number of patient visits instead of
number of claims. Bauder and Khoshgoftaar (2016)
generalised the concept to other provider types, com-
paring five different regression models within their
proposed framework to predict reimbursement de-
pending on the procedure/provider type combination
among five different provider specialties. Six features
were incorporated, each statistically significantly dif-
ferent between at least most of the provider special-
ties, and thresholds of error were set to flag outlying
providers. However, in each of these works only one
provider specialty could be analysed at a time, and for
provider specialties with a high degree of overlap, or
for procedure item codes which may legitimately co-
occur, such a method may not be feasible as reliably
segregating providers and procedures can be difficult.
Weiss et al. (2015) discuss the importance of iden-
tifying costly outliers from peer groups, and used pa-
tient demographic and diagnostic information in order
to predict provider prescriptions of Oxycodone (us-
ing volume as a proxy for cost). Providers with high
volumes of prescriptions that were predicted to be in
a low-volume demographic were flagged as anoma-
lous. This method relies on access to patient infor-
mation which may not be available to the insurance
provider; typically such information is held in the
medical provider’s local database, and there may be
legal restrictions on its access.
Context Discovery and Cost Prediction for Detection of Anomalous Medical Claims, with Ontology Structure Providing Domain Knowledge
31

3 METHODS
3.1 Data
The Medicare Program in Australia provides reim-
bursement for medical services and hospital care for
Australian residents and some visitors. Eligible ser-
vices and reimbursement amounts are defined by the
MBS as an ontology with a tree structure represent-
ing the relationship between items (Australian Gov-
ernment Department of Health, 2019). The tree com-
prises five levels: Category → Group → Subgroup →
Subheading → Item (with subgroup and subheading
being optional). Reimbursement claims are recorded
as rows in a tabular dataset, containing a claim for
a single professional service performed according to
the MBS, with information such as provider and pa-
tient identifiers, date of service, the item code (repre-
senting the service performed), and other relevant de-
tails. Multiple services may be claimed on the same
date, e.g., it may be appropriate for a consultation to
occur before a surgery, both of which are separate
items in the MBS. For this study, we used MBS claims
data from 01-Oct-2019 to 30-Sep-2020.
3
As far as we
know, this is the first time a full dataset from the De-
partment of Health (DoH) has been made available to
outside researchers to study compliance analytics.
3.2 Data Extraction
To provide real-world relevance to the project and en-
able comparison with currently used approaches (see
Section 3.6.2), target items were chosen to match
those of an existing investigation within the Com-
pliance Analytics team at the DoH. The target items
were all those related to either hand surgery (MBS
Category 3: Therapeutic Procedures, Group T8: Sur-
gical Operations, Subgroup 14: Hand Surgery), or
orthopaedic surgery (MBS Category 3: Therapeu-
tic Procedures, Group T8: Surgical Operations, Sub-
group 15: Orthopaedic).
From the claim dataset, we first create a set of pa-
tient events. A patient event contains all claim rows
for a single patient which shared the date of service
for at least one claim of a target item for that patient,
i.e., all claims for a patient on the day of a procedure
of interest. Table 1 shows an example where patient
events for two fictitious patients are identified for tar-
get items. In this example the first patient event for
Patient 1 is identified due to the claim of a knee re-
placement procedure (item code 49518) on January
3
Owing to privacy concerns it will not be possi-
ble to release this dataset. Source code is available:
https://github.com/jpkemp/anomaly detection framework
30. Three further items for Patient 1 claimed on the
same date are also included in the patient event (note
that two providers are involved). Patient 1 also has a
second patient event based on the claim of a different
target item, a shoulder replacement procedure (item
code 48918) on August 1. On the same date a dif-
ferent patient event is identified, a knee replacement
for Patient 2, with three different providers included
in this patient event.
We define episode pairs, based on patient events,
where each pair contains a provider episode and an
ontology episode. A provider episode contains the
list of items from a patient event claimed by a sin-
gle provider. For example, if three providers were
involved in a patient event, the items from the pa-
tient event would be split into three separate provider
episodes, each containing the list of items claimed
by that provider. Table 2 shows the three provider
episodes that would be generated from the patient
event for Patient 2 in Table 1.
An ontology episode contains a set of features de-
noting the ontology location of each item in the corre-
sponding provider episode. For a given item, its ontol-
ogy location is automatically derived by mapping the
item code to a tuple containing, in order, its respec-
tive ancestors in the ontology tree, i.e., the item’s Cat-
egory, Group, Subgroup, and Subheading in the MBS
ontology (see Figure 1). Each tuple is converted to a
single string, i.e., a feature, for the purposes of input
to a learning algorithm to enable role modelling (see
Section 3.3). This mapping reduced the 5953 individ-
ual item codes to 551 ontology locations (Australian
Government Department of Health, 2019). Using the
MBS ontology structure in this way creates a natural
and interpretable prioritisation of relationships by in-
nately identifying some close connections. In terms
of feature construction, the ontology locations repre-
sent the least generalisation of item codes with respect
to the MBS ontology (Han et al., 2011).
3.3 Role Modelling
Topic modelling identifies themes and the relation-
ships between them within documents, and is then
able to classify documents according to those themes.
Patient claims can be viewed as documents, and
themes based on item relationships discovered using
topic modelling. To give an initial context to the pa-
tient claims, the data was first grouped by the likely
primary surgery. Episode pairs were assigned to a
subheading collection by finding the ontology loca-
tion of the highest-cost hand surgery or orthopaedic
item within the parent patient event. The hand surgery
group has no subheadings, and the orthopaedic group
HEALTHINF 2023 - 16th International Conference on Health Informatics
32
Table 1: An example of claim rows (fictitious data) showing items claimed for two patients identified by target item (Knee or
Shoulder replacement) and separated by date and patient ID to create three patient events involving four providers (see text
for details).
Patient ID Provider ID Item Code Item Summary Date
1 1 49518 Knee replacement 30-Jan
1 2 17610 Anaesthetic consultation 30-Jan
1 2 21402 Anaesthetic initiation 30-Jan
1 2 22031 Pain management 30-Jan
1 1 48918 Shoulder replacement 01-Aug
1 2 17610 Anaesthetic consultation 01-Aug
1 2 21622 Anaesthetic initiation 01-Aug
2 3 49518 Knee replacement 01-Aug
2 3 105 Professional attendance 01-Aug
2 2 17610 Anaesthetic consultation 01-Aug
2 2 21402 Anaesthetic initiation 01-Aug
2 4 51303 Surgical assistant 01-Aug
Table 2: Fictitious claim rows illustrating how claims in a patient event are separated by provider ID. Provider episodes are
created from the items in the separated claim rows for each (Patient ID, Provider ID) pair on a given date of service.
Patient ID Provider ID Item Code Item Summary Date
2 3 49518 Knee replacement 01-Aug
2 3 105 Professional attendance 01-Aug
2 2 17610 Anaesthetic consultation 01-Aug
2 2 21402 Anaesthetic initiation 01-Aug
2 4 51303 Surgical assistant 01-Aug
has 21 subheadings, resulting in 22 potential subhead-
ing collections. The episode cost for an episode pair
was calculated by summing the schedule fees for the
items in the provider episode. Several fee-based fea-
tures are available in each claim row in the MBS. The
schedule fee is the base fee rate for an item, before
incentive payments or variable provider charges are
applied. Given that there is legitimate variation in
fees, using other fee types such as the total benefits
paid can lead to spurious results. For example, in the
MBS, variation in benefits paid to providers making
the same claims can be on orders of magnitude due
to government incentives with respect to location or
other factors. The schedule fee is therefore the most
comparable fee type for examining wasteful claims.
For each subheading collection, the associated
episode pairs were passed to a role modelling algo-
rithm. Two algorithms were examined for the purpose
of context discovery: GAA (see Section 1.2.1 and La-
tent Dirichlet Allocation (LDA) (Blei et al., 2003).
We use the term context discovery, as GAA is not
strictly a topic modelling algorithm in that it is not a
probabilistic generative model. Other topic modelling
or context discovery algorithms may also be effec-
tive, but were not examined for this study. While the
approach in each method is quite different, they can
both be used to perform the same task. Essentially,
typical roles within a surgery – e.g., surgeon, anaes-
thetist, assistant, etc. – were learned from the ontol-
ogy episodes by finding relationships between the on-
tology locations contained in the ontology episodes.
GAA works by finding pairwise item association
rules with association analysis (Tan et al., 2005), and
constructing a graph from those rules. When applied
to the ontology episodes, the association rules iden-
tify connections between ontology locations of items.
Because the ontology episodes are constructed on a
per-patient, per-provider basis, and because different
provider roles within a procedure utilise items from
different ontology locations within the MBS, com-
ponents of the graph indicate different provider roles
within the procedure (see Figure 2). Episode pairs
were assigned to a role based on the closest matching
component (i.e. the most matching ontology items).
LDA is a Bayesian probabilistic graphical model
which uses mixture models of items in collections
over a set number of hidden topics (Blei et al.,
2003). Similarly to GAA, when applied to ontology
episodes, modelled topics will find probabilities for
ontology locations appearing in documents within
that topic (see Table 3). Episode pairs were assigned
to a role by finding the closest matching topic, i.e.,
the discovered topics define the provider roles. We
arbitrarily assigned 5 topics, based on examination of
the GAA results.
Context Discovery and Cost Prediction for Detection of Anomalous Medical Claims, with Ontology Structure Providing Domain Knowledge
33
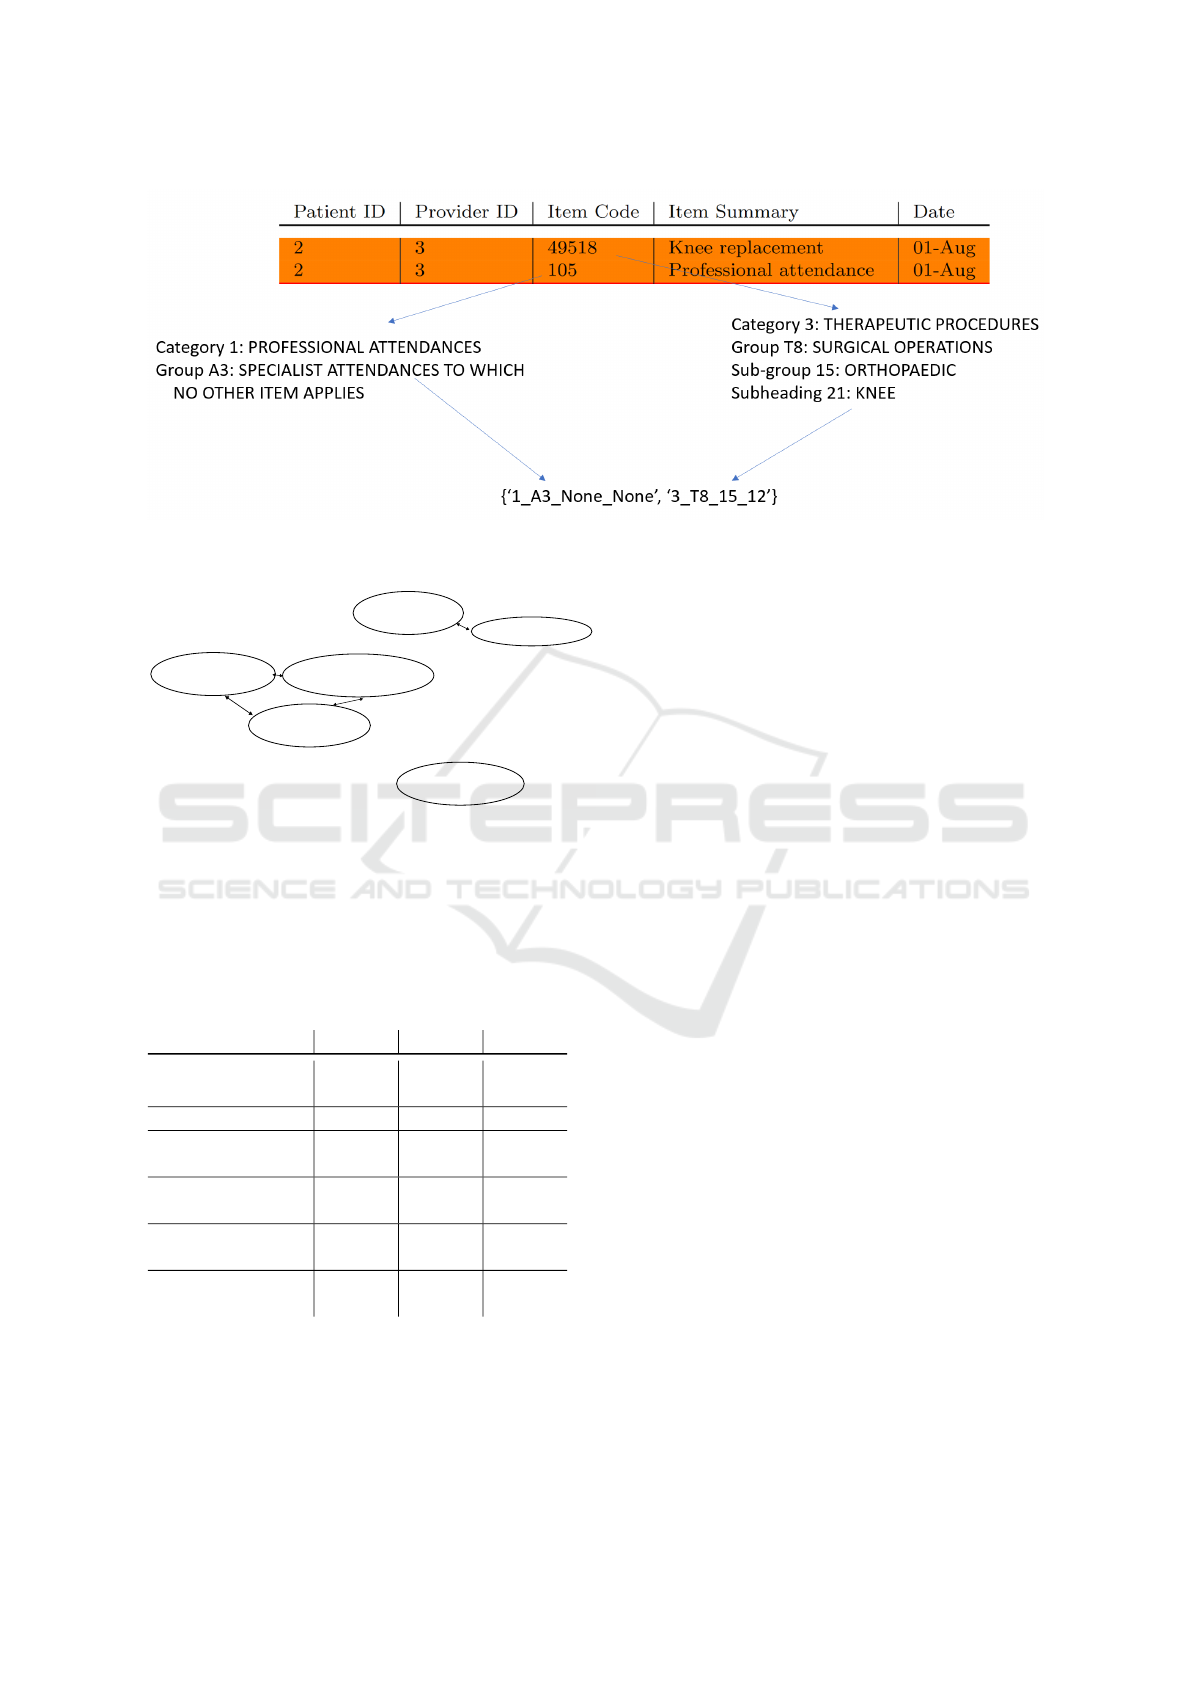
Figure 1: Depiction of the items in a provider episode being mapped to their ontology locations in order to create an ontology
episode.
Surgical
procedures
Consultations
Anaesthetic
management
Anaesthetics for
procedures
General
anaesthetics
Radiographic
examinations
Figure 2: Fictitious graph illustrating how GAA can learn
provider roles. The 2-item component represents sur-
geon claims, the 3-item component represents anaesthetist
claims, and the 1-item component represents radiologist
claims.
Table 3: Fictitious LDA topics illustrating how provider
roles are learned. Topic 1 represents surgeon claims, topic
2 represents anaesthetist claims, and topic 3 represents ra-
diologist claims.
Item Topic 1 Topic 2 Topic 3
Surgical
procedures
0.800 0.001 0.001
Consultations 0.150 0.001 0.050
Anaesthetics
management
0.001 0.400 0.001
Anaesthetics for
procedures
0.001 0.280 0.001
General
anaesthetics
0.001 0.310 0.050
Radiographic
examinations
0.047 0.048 0.897
The expected cost for a role within a context, re-
gardless of the topic modelling algorithm, was calcu-
lated by taking the mean of the episode costs from
the episode pairs associated with the role in a given
context.
3.4 Provider Ranking
Each provider was assigned a suspicion score. For the
n
p
episode pairs associated with a given provider p,
episode cost e
i
for the i
th
episode and expected cost r
i
for the role to which the episode pair is assigned, the
suspicion score s is
s
p
= n
p
× median(
n
∑
i=1
max(e
i
− r
i
, 0)) (1)
Providers were then ranked by their suspicion
score, with higher suspicion scores indicating pos-
sible repeated, expensive, and unusual activity as
the median represents the typical provider behaviour
which is then weighted by the number of episodes
for the provider. Note that this score is designed
to overcome the limitations of our previous method
which focused solely on items, which does not ade-
quately represent potential recoverable costs, as dis-
cussed in 1.2.2. The weighting by the number of
episodes assists with determining total benefit paid
to the provider, while use of the median represents
their typical costs which assists in preventing unusual,
costly patients unduly skewing the representation of
their normal behaviour.
3.5 Process Summary
The modelling and ranking process is summarised as
follows:
1. Identify context
(a) Identify the ontology location of the patient’s
primary surgery
i. E.g., knee, hip, shoulder
(b) Identify the provider’s role within the patient
event
HEALTHINF 2023 - 16th International Conference on Health Informatics
34

i. E.g., surgeon, anaesthetist, assistant
2. Calculate the typical fee for each role in each sub-
heading collection
3. Calculate the suspicion score for each provider
(a) Calculate the differences between the episode
cost and the typical cost of the assigned role for
each episode pair
(b) Take the median difference for the episode pairs
for each provider and weight by their total num-
ber of claims
4. Rank providers by the suspicion score
3.6 Validation
Due to the volume of data both as input and output
to these methods, validating the results is difficult. In
order to determine whether the method is producing
useful results, known anomalous providers as well as
high-scoring, previously unknown providers were ex-
amined.
3.6.1 LDA Repeatability
As LDA is a stochastic method, the topics produced
vary run to run, resulting in different episode role
assignments. To reduce the effect of the variation,
the LDA method was run multiple times, and the
mean suspicion scores were used to determine the fi-
nal rank. Two-way mixed effects intra-class corre-
lation coefficients for both single fixed and average
fixed raters (ICC3 and ICC3k) were used to measure
the variation in the scores across the LDA runs, treat-
ing the providers as raters (Koo and Li, 2016). ICC3
measures within-rater reliability of a fixed group of
raters over multiple ratings, whereas ICC3k measures
mean rating score from a fixed group of raters over
multiple ratings. In this way we can infer LDA consis-
tency from the reliability of the provider scores pro-
duced across the runs. The ICCs were tested on log-
transformed data, as the raw scores were highly right-
tailed. Descriptive statistics were done on the largest
change in score for all providers as a proportion of the
total schedule fees for their claims, i.e.
changes =
max(s
i,p
) − min(s
i,p
)
total fees(p)
∀p (2)
where s
i,p
is the score for a given provider p in a
single test run i, and total
fees is the sum of the
provider’s fees across all their episodes.
Rank-biased overlap (RBO) was used to measure
the differences in the rankings across the LDA runs,
as changes in the scores will affect the ranking. RBO
is a metric for determining rank-ordered list over-
lap which has several advantages over similar met-
rics, including being symmetric, top-weighted, and
not tail-dominated, which are consistent with the re-
quirements for ranking in this study (Webber et al.,
2010). RBO was applied to all pairwise combination
of ranks from the 10 runs. RBO was also used to com-
pare the rankings of the top 100 providers from the
LDA and GAA methods. A weight parameter of 0.99
was used with RBO to give 85% of the weight to the
top 100 providers.
3.6.2 Comparison of Provider Ranking to
Existing Information
Provider IDs were obtained for 100 surgical providers
recently flagged as anomalous by the Compliance An-
alytics team at the DoH. These providers made claims
from across the orthopaedic and hand-surgery MBS
items, over the same time period as the data we used.
They were identified using a variety of statistical anal-
yses focusing on item claim and co-claim counts. We
will refer to these 100 providers as the anomalous
set. Each of the mean LDA and GAA rankings was
segmented into 100 even sections. The number of
anomalous set providers in each cumulative section
was determined. That is, if we call the first segment
i
0
, and the second set i
1
, the first overlap calculated
would be the count of intersection between anoma-
lous set and the set of providers in i
0
, and the second
calculation would be between the intersection of the
anomalous set and the union of the set of providers in
i
0
and i
1
. As well as the intervals described above, the
number of overlapping providers in the top 100 was
calculated. This analysis indicated whether the rank-
ing provided by our method is able to pick up known
anomalies.
3.6.3 In-depth Examination of Previously
Unidentified Cases
High-scoring providers in our ranking who did not
appear in the anomalous set were examined against
their peers with methods currently in use at the DoH.
As the method incorporates cost into the ranking, it
is possible that the high-ranking providers were spe-
cialists working on more complicated patients instead
of abusing the system. The DoH assigns an in-house
provider specialty label (PSL) to its providers based
on the provider’s registered specialty and their item
claims over a quarter. We obtained the PSL for the
top 20 providers in the GAA rankings which were not
in the anomalous set; we will refer to these providers
as the high-scoring set. Counts of item claims and
co-claims were compiled from the provider episodes
Context Discovery and Cost Prediction for Detection of Anomalous Medical Claims, with Ontology Structure Providing Domain Knowledge
35

for all providers in each PSL, where provider episodes
existed (i.e., the providers had claims in the extracted
data from section 3.2). For each of the high-scoring
set providers, the number of claims and percentile of
claims for each item and item co-claim was examined
by hand to determine whether the provider was mak-
ing unusual claims.
Outlying item counts for items claimed by at least
10 providers were also flagged using an adjusted box-
plot outlier formula. By inspection, many of the
items had a right-tailed, zero-inflated Poisson distri-
bution. That is, a high proportion of providers did
not claim given items at all. Typical outlier detec-
tion methods do not work well with skewed, zero-
inflated data (Templ et al., 2020). The outlier cut-
off c was therefore calculated only on the positive-
valued data, using the following formula to account
for skew (Yang et al., 2011; Templ et al., 2020):
c = Q
3
+ 1.5 × IQR × e
3MC
, (3)
where MC is the medcouple. The medcouple mea-
sures univariate distribution skewness, reducing the
impact of outliers compared to the classical skewness
coefficient (Brys et al., 2004).
This analysis indicated whether the previously
unidentified providers were making unusual claims or
merely expensive ones.
3.7 Results
The extracted data comprised 1,918,643 claim rows
from 31,306 providers covering 331,323 patient
events. For the LDA runs, ICC3 on the log-
transformed provider scores was 0.035 whereas
ICC3k was > 0.99. This shows low consistency
within the provider scores across the LDA runs, but
good consistency in the mean scores. As a propor-
tion of total costs, the median change was 0.12, the
mean change was 0.15, and the maximum change
was 0.97. That is, most provider scores changed by
only a small amount across the LDA runs, but some
providers changed by a large amount. This is due to
the episode assignment to roles changing as the topics
change. Providers with many episodes which border
on two different roles will have large changes in score
as the role cost to which their episodes are compared
changes. For example, if a provider typically claims
episodes which contain both surgical and anaesthetic
items (an uncommon edge case), as the topic weight-
ings change the bulk of their episodes might be as-
signed to the topic representing the surgeon role, or
the topic representing the anaesthetist role. As sur-
gical procedure items tend to be relatively expensive,
the episode costs may be close to the mean if they are
assigned to the surgical role, but much higher than the
mean if they are assigned to the anaesthetist role. This
provider could then have either a low score or a high
score, depending on the learned topics.
The RBO between the rankings from the LDA
runs ranged from 0.51 to 0.86, with a mean of 0.74.
This shows that the provider ranks can vary due to
the stochastic nature of LDA, but in spite of the varia-
tion of the within-provider scores, agreement between
the rankings is generally good. The RBO between
the ranking from the GAA method and the combined
ranking from the LDA method was 0.81, also showing
good agreement.
3.7.1 Known Anomalous Providers
Plots of the ranking overlap with the anomalous set
are shown in Figures 3 and 4 for the GAA and
LDA methods respectively
4
. Of the 100 top-scoring
providers from the GAA ranking, 28 were part of the
anomalous set, and in the LDA results 33 of the top
100 were from the anomalous set. Most of the anoma-
lous set providers ranked within the top 10% with
both methods. The LDA method produced a steeper
curve, ranking more of the anomalous higher than the
GAA method. In both methods some of the anoma-
lous providers ranked low, with a score of 0. From
the plots, it can clearly be seen that the providers who
have ranked high are those with both more episodes
and a higher cost per episode. This is in line with
the objective of ranking providers based on potential
return, rather than solely on anomalous behaviour.
3.7.2 High-Scoring Providers
For privacy reasons we will only discuss the results
in general terms – the points noted will also apply
to other similar providers. The high-scoring sets
included cardio-thoracic surgeons, general surgeons,
orthopaedic surgeons, plastic and reconstructive sur-
geons, and anaesthetists. Seventeen providers over-
lapped in the GAA and LDA high-scoring sets, to-
talling twenty-three providers examined. The results
are summarised in Table 4
Two of the providers displayed behaviour that had
previously been investigated; the quantity and type of
items they claimed are common in a particular sub-
speciality, and are unlikely to be an abuse of the sys-
tem. Had this previous investigation not occurred,
these surgeons would have been considered worth fur-
ther investigation. Four providers, while high-volume
4
Note the number of providers in the GAA and LDA
results is different due to GAA assigning some providers to
no role, which was not assessed. The number of providers
in each interval is therefore also different.
HEALTHINF 2023 - 16th International Conference on Health Informatics
36
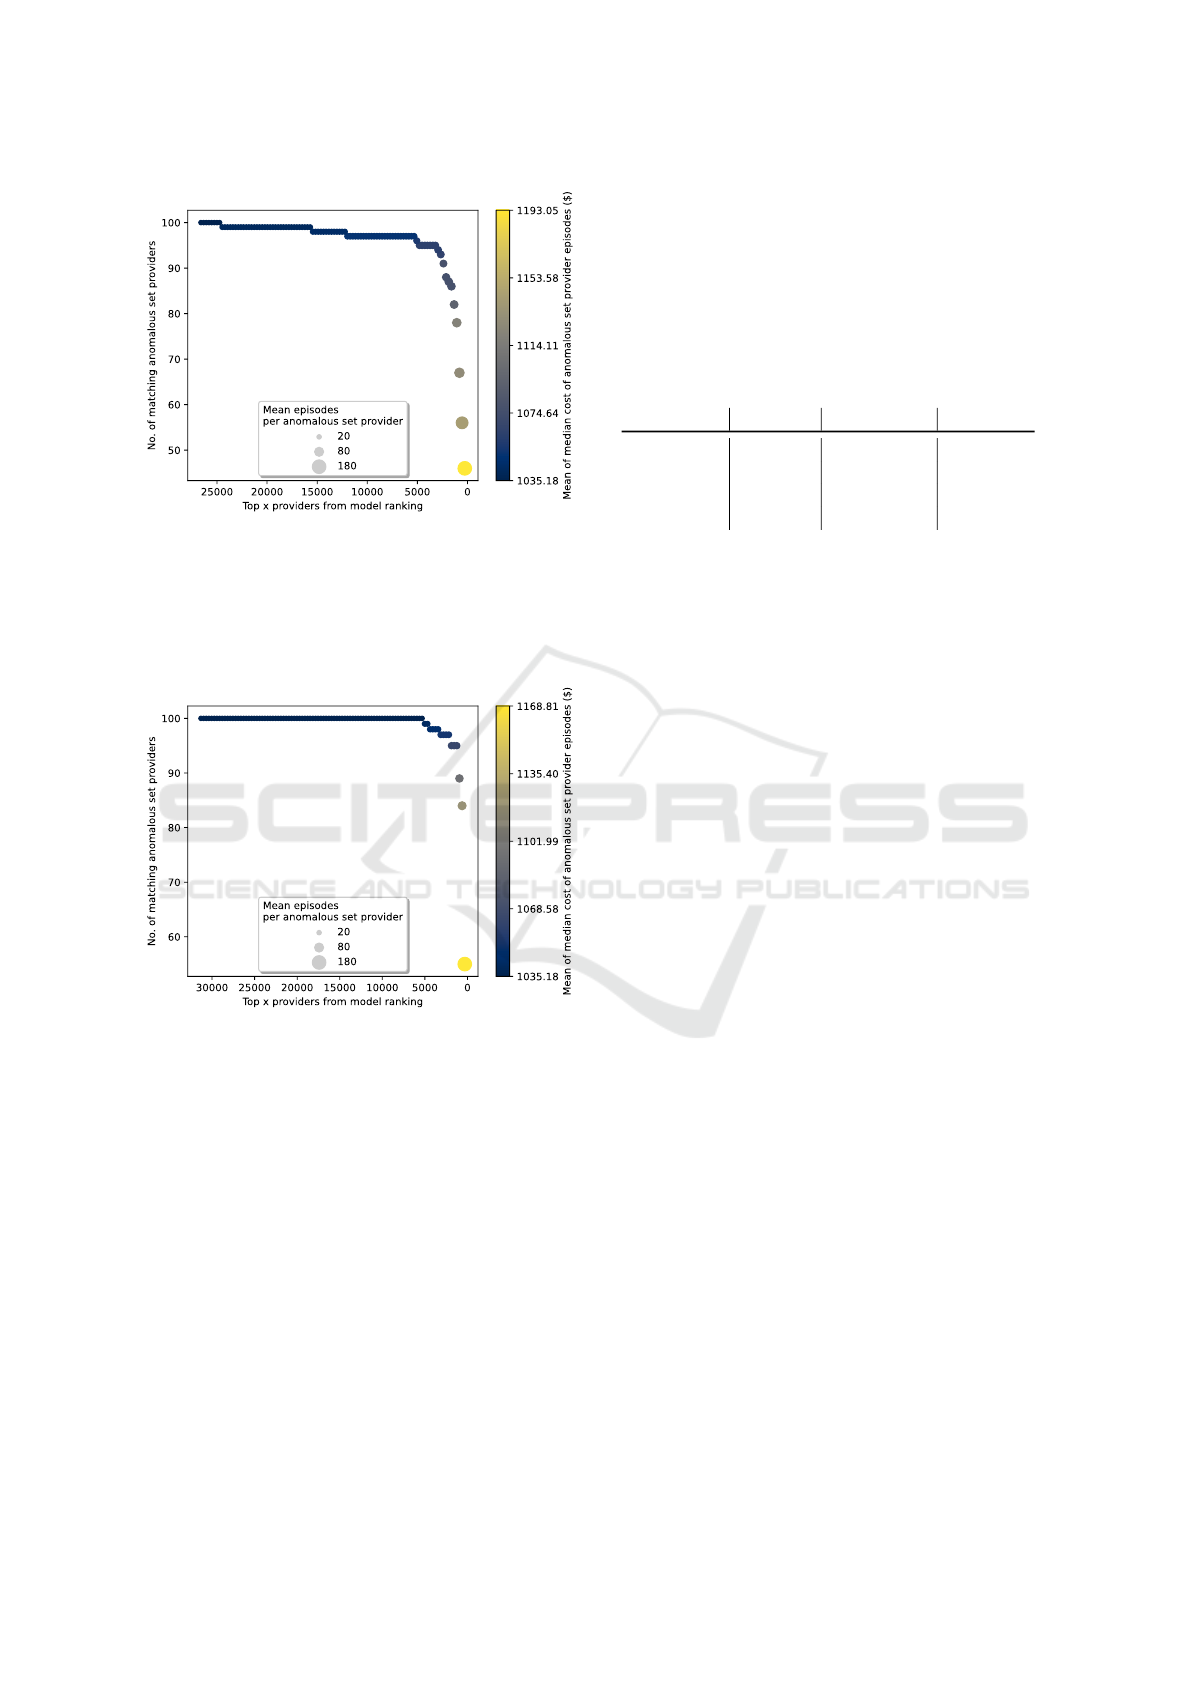
Figure 3: GAA provider rankings showing the overlap with
the anomalous set, with each circle representing 100%,
99%, 98%, and so on of the assessed providers. The anoma-
lous set providers ranked more highly by the GAA method
have more, and more expensive, episodes than the other
anomalous set providers as indicated by the larger, lighter
coloured circles as lower-ranked providers drop out of the
cumulative analysis.
Figure 4: LDA provider ranking overlap with the anoma-
lous set at even intervals. The plot is constructed as per
Figure 3.
claimants of some items, were either not clearly dif-
ferentiated from their near-peers, or were not engag-
ing in potential upcoding or unusual co-claiming be-
havior, and for a conservative estimate were consid-
ered likely to be senior practitioners rather than po-
tentially abusing the system.
The providers we considered unusual were in the
top percentiles of claimants in their PSL for co-
claimed items or items indicating potential upcoding
or unbundling, with a large increase in number of
claims from the percentiles below. Upcoding occurs
when a similar, higher value claim is made in place of
another service (Couffinhal and Frankowski, 2017).
Upcoding patterns can also potentially indicate claims
from senior consulting physicians who only take com-
plex patients, however it is not possible to assess the
difference from the claims data alone, and further in-
vestigation would be required. Unbundling occurs
when multiple codes are billed in place of a cheaper
‘bundled’ item which is intended to cover the collec-
tion of services, and is a common target for recov-
ery (Couffinhal and Frankowski, 2017).
Table 4: High-scoring set providers confirmed as unusual.
Method By hand By formula Assessed
GAA only 3 3 3
LDA only 2 3 3
Both 12 (14) 11 17
Total 17 (19) 17 23
Similar numbers of providers were detected by the
adjusted outlier detection formula as by hand. How-
ever, we found outlier detection on positive-valued
data is quite conservative and not always appropriate.
For example, one provider had several hundred claims
of an item. The value at the 99th percentile (including
0-valued data) was around 16, but the provider was
not flagged as an outlier. With most providers within
a PSL not claiming that item, such a high volume of
claims was considered of interest. The outlier formula
is not always calculable, as the medcouple can go to
infinity; alternate outlier thresholds should be consid-
ered if automated classification is required.
4 DISCUSSION
Data mining and statistical learning has a history of
use in aiding decision-making (Sivarajah et al., 2017;
Ekin et al., 2018). The method we propose here is
able to automatically group procedures and provider
roles within procedures from medical claims by in-
corporating domain knowledge encoded within the
claim ontology structure. It then ranks providers
based on the magnitude of the difference from their
peers, thereby incorporating potential return in the
anomaly detection mechanism. The results showed
that the method was able to detect both previously
identified and novel patterns of potential fraud and
waste. This method is therefore suitable as a decision-
support tool for prioritisation of potential cases for au-
dit, and for identifying patterns that can be encoded in
other decision-support tools and used for identifying
groups of providers exhibiting similar behaviour.
4.1 Underlying Challenges
Not all the providers who ranked highly displayed
patterns considered to be potentially fraudulent or
Context Discovery and Cost Prediction for Detection of Anomalous Medical Claims, with Ontology Structure Providing Domain Knowledge
37

wasteful. This is inevitable in an area as heteroge-
neous as medical claims. Some of the patterns identi-
fied will be “red herrings” with the providers involved
being specialists of some kind. Specialists might per-
form more expensive services than their peers work-
ing in a similar context. It is not possible to de-
termine whether a provider is a specialist or engag-
ing in abusive claiming practices from the data alone.
Other providers might perform services which border
two different roles in a procedure, and depending on
the role to which they are allocated, they might ap-
pear normal or expensive. This was highlighted by
the high change in costs for some providers over re-
peated LDA runs. However, the most appropriate role
cannot be determined from the data alone; expert as-
sessment is required for these edge cases. Any clus-
tering approach will have the same problem on data
with a high degree of overlap; some misclassifica-
tion is inevitable, and no one tool is likely to be able
to capture all fraudulent or wasteful practices (Kose
et al., 2015). It may be possible to assign multiple
roles to an episode based on probabilities or perhaps
Bayesian priors, however the method would need to
be significantly extended to account for multiple po-
tential scores. We consider some false-positives ac-
ceptable in a first stage decision-support tool, as the
behaviours can then be identified, investigated, and
assessed appropriately. Later-stage tools could incor-
porate known non-abuse patterns as a filter, or the
knowledge could be fed back into the ontology struc-
ture to help group the providers more appropriately.
Generally, the frequency of the patterns identified
here were shown to be anomalous compared with the
peer groups, as well as being expensive behaviours.
4.2 Cost as a Metric
Some providers engaging in known anomalous be-
haviour were ranked very low by the algorithm.
Those providers were involved in cheaper procedures;
while they exhibited some unbundling behaviour,
their total costs were lower than their peers. More-
over, they were generally involved in fewer proce-
dures than their peers. The providers who ranked
highly were those involved in more, and more expen-
sive, procedures. This is in accordance with the de-
sign goal of ranking by potential for return. Finer
granularity in the MBS ontology could help better
group the procedures so that complex, expensive pro-
cedures are not compared with simple ones.
4.3 Model Comparison
Both topic modelling methods performed well, dis-
covering unusually costly providers with both known
and unknown patterns of anomalous behaviour. There
are advantages and disadvantages to each.
GAA offers the ability to drop episodes which do
not fit the topics - classing them as not belonging to
a role, which are not assessed - whereas LDA pro-
vides the most likely result. This classification could
be useful as part of a decision-support suite, where
episodes outside the typical part of a procedure could
be sent to a different tool for further analysis. A
threshold for similarity could be set to provide the
same behaviour for LDA if required. The best ap-
proach may vary depending on the claims involved.
The GAA method is able to learn the number of
roles, whereas LDA requires it to be specified before-
hand. In this case the number set was based on vi-
sual examination of the GAA modelled roles. The
best number of roles may not be fixed. In both cases,
roles would need expert examination for suitability in
a decision-support system; if the typical claims mod-
elled by the topic-modelling algorithm did not make
sense to subject-matter experts, the results of the rank-
ing may not be appropriate.
4.4 Limitations
The model design is based on two assumptions which
do not hold. The first assumption is that providers
working within a similar area - i.e. a subheading col-
lection - will see a similar distribution of patients and
behave in a comparable manner. That is, it is assumed
each provider will claim a similar range of cheap and
expensive items within the subheading collection. In
practice, distributions vary in part due to specialisa-
tion and seniority of the providers, meaning that the
comparison between providers is not completely like-
to-like. Junior practitioners will typically perform a
far greater number of simple procedures, while se-
nior practitioners and specialists will be involved in
higher numbers of complex procedures, which would
be more expensive. As mentioned, this problem is in-
herent to data with a high degree of overlap, and is
difficult to overcome.
The second assumption is that the ontology struc-
ture is consistent, i.e. that items within a subheading
are equally related to each other and equally distant
from items in a different subheading. Similarly, sub-
headings within a subgroup are assumed to be equally
similar to each other, and equally distant from sub-
headings in a different subgroup. In practice, items
do not function equivalently, and the structure of the
HEALTHINF 2023 - 16th International Conference on Health Informatics
38

ontology is not formulated for this purpose. However,
it was a simple and effective way of incorporating do-
main knowledge which is difficult to learn from the
data due to its innate heterogeneity.
Validation of the models was necessarily limited
through lack of availability of subject-matter experts
able to review the results. Two fields of knowledge are
required for these experts: specialist medical knowl-
edge of the procedures, and knowledge of the legis-
lation and policies that drives further action in recov-
ering potentially fraudulent and wasteful claims. Few
such people are employed by the DoH, and none were
available for in-depth analysis, though they did pro-
vide assistance with our questions. The process for
recovery is lengthy, and results based on outcomes of
that process are also impractical to obtain at this stage.
Review by data analysts at the DoH was considered
to be adequate as the intent of the method is for a
decision-support tool, and the data analysts would be
the end-users, however a more thorough review would
be beneficial. Use of the PSL for comparison pur-
poses is not ideal, as it is known to be an imperfect
tool for grouping similar providers. However, it is the
tool that is currently in use, and as with all clustering
problems there are multiple possible solutions each
with advantages and disadvantages dependent on the
use-case (Estivill-Castro, 2002).
4.5 Future Work
Additional validation, such as ablation studies or fur-
ther examination of the rankings and provider roles,
including true negatives and mis-classified providers,
may help improve the approach. However, due to re-
source constraints this was not possible for this study.
Further research could focus on better segregating
similar providers. There are at least two ways this
could be done. One option would be to make use of
the cost distribution. Instead of using the median, it
may be possible to examine distance from cost peaks.
That may allow for different sub-specialties/seniority
of providers working on a similar subheading collec-
tion. However, it may also lead to more blurring as
low-scoring providers working similarly to providers
from an expensive peak overlap with high-scoring
providers working similarly to providers working
from a cheaper peak. Another option would be to
work on the ontology, providing a more suitable struc-
ture for this use case. Our key domain-knowledge
input to the algorithm is the ontology, and the flaws
are partly a fault of the ontology structure rather than
the algorithm itself. Learning similar role and pro-
cedure separation without the ontology would require
extensive extra features and possibly semi-supervised
or active learning. Weakly-supervised or seeded LDA
would enable expert opinion to be included. Better
incorporating domain knowledge into the ontology
structure or the model would facilitate better results.
Another line of research would be in extending
the algorithm to sequential data. It may be possible
to treat each day of an ongoing treatment as an input
to the role-modelling algorithm. Patterns over time
could then be identified, perhaps at the subheading
collection level, and significant or expensive varia-
tions from those patterns flagged for further investi-
gation.
5 CONCLUSION
We proposed a model that can automatically learn
procedure and role contexts by utilising topic mod-
elling and the MBS ontology, and then rank providers
by potential for recovery of costs based on magnitude
and quantity of difference to typical costs within the
given contexts. This model was able to detect both
known and novel patterns of potentially fraudulent
and wasteful behaviour, and was found to be suitable
for use as an early-stage decision support tool in the
claim-recovery process. For our methods we found
the MBS ontology structure to be a useful way of in-
corporating domain knowledge. To the best of our
knowledge, this is the first tool of its kind that is able
to learn the context for comparison at both the proce-
dure and role level for this type of claim data.
ACKNOWLEDGEMENTS
This research is supported by an Industry PhD schol-
arship which includes funding from the Common-
wealth Scientific and Industrial Research Organisa-
tion, the Department of Health, Australian Govern-
ment, and an Australian Government Research Train-
ing Program (RTP) scholarship.
REFERENCES
Australian Government (2017). Budget strategy and out-
look: Budget paper no. 1 2017–18.
Australian Government Department of Health (2019).
Medicare benefits schedule.
Bauder, R. and Khoshgoftaar, T. (2016). A novel method
for fraudulent Medicare claims detection from ex-
pected payment deviations. In 2016 IEEE 17th In-
ternational Conference on Information Reuse and In-
tegration (IRI), 28-30 July 2016, pages 11–19. IEEE
Computer Society.
Context Discovery and Cost Prediction for Detection of Anomalous Medical Claims, with Ontology Structure Providing Domain Knowledge
39

Bauder, R. and Khoshgoftaar, T. (2017). Medicare fraud de-
tection using machine learning methods. In 2017 16th
IEEE International Conference on Machine Learning
and Applications (ICMLA), 18-21 Dec. 2017, pages
858–65. IEEE Computer Society.
Blei, D. M., Ng, A. Y., and Jordan, M. I. (2003). La-
tent dirichlet allocation. J. Mach. Learn. Res.,
3(null):993–1022.
Brys, G., Hubert, M., and Struyf, A. (2004). A robust
measure of skewness. Journal of Computational and
Graphical Statistics, 13(4):996–1017.
Couffinhal, A. and Frankowski, A. (2017). Wasting with in-
tention: Fraud, abuse, corruption and other integrity
violations in the health sector, pages 265–301. OECD
Publishing.
Ekin, T., Ieva, F., Ruggeri, F., and Soyer, R. (2018). Statisti-
cal medical fraud assessment: Exposition to an emerg-
ing field. International Statistical Review, 86(3):379–
402.
Estivill-Castro, V. (2002). Why so many clustering algo-
rithms: A position paper. SIGKDD Explor. Newsl.,
4(1):65–75.
Gee, J. and Button, M. (2015). The financial cost of health-
care fraud. PKF Littlejohn LLP and University of
Portsmouth. Technical report.
Han, J., Kamber, M., and Pei, J. (2011). Data Mining: Con-
cepts and Techniques. Morgan Kaufmann.
Hu, Y., Murray, D. W., Shan, Y., Sutinen, A., Mendis, B.
S. U., and Tang, M. (2011). Prescriber-consumer
social network analysis for risk level re-estimation
based on an asymmetrical rating exchange model. In
Proceedings of the Ninth Australasian Data Mining
Conference, volume 121, pages 111–118. Australian
Computer Society, Inc.
Ivanovi
´
c, M. and Budimac, Z. (2014). An overview of on-
tologies and data resources in medical domains. Ex-
pert Systems with Applications, 41(11):5158–5166.
Ko, J. S., Chalfin, H., Trock, B. J., Feng, Z., Humphreys,
E., Park, S.-W., Carter, H. B., Frick, K. D., and Han,
M. (2015). Variability in medicare utilization and pay-
ment among urologists. Urology, 85:1045–1051.
Konopka, B. M. (2015). Biomedical ontologies — a re-
view. Biocybernetics and Biomedical Engineering,
35(2):75–86.
Koo, T. and Li, M. (2016). A guideline of selecting and
reporting intraclass correlation coefficients for relia-
bility research. Journal of Chiropractic Medicine, 15.
Kose, I., Gokturk, M., and Kilic, K. (2015). An inter-
active machine-learning-based electronic fraud and
abuse detection system in healthcare insurance. Ap-
plied Soft Computing, 36:283–299.
Krumholz, H. M. (2014). Big data and new knowledge
in medicine: The thinking, training, and tools needed
for a learning health system. Health Aff (Millwood),
33(7):1163–70.
Mendis, B. S. U., Murray, D. W., Sutinen, A., Tang, M.,
and Hu, Y. (2011). Enhancing the identification of
anomalous events in Medicare consumer data through
classifier combination. Presented at IWCD6 - 6th In-
ternational Workshop on Chance Discovery as part of
the International Joint Conference on Artificial Intel-
ligence 2011.
Ng, K. S., Shan, Y., Murray, D. W., Sutinen, A., Schwarz,
B., Jeacocke, D., and Farrugia, J. (2010). Detecting
non-compliant consumers in spatio-temporal health
data: A case study from Medicare Australia. In 2010
IEEE International Conference on Data Mining Work-
shops, pages 613–622.
Shan, Y., Jeacocke, D., Murray, D. W., and Sutinen, A.
(2008). Mining medical specialist billing patterns for
health service management. In AusDM ’08: Proceed-
ings of the 7th Australasian Data Mining Conference,
volume 87, pages 105–110. Australian Computer So-
ciety, Inc.
Shan, Y., Murray, D. W., and Sutinen, A. (2009). Discov-
ering inappropriate billings with local density based
outlier detection method. In AusDM ’09: Proceedings
of the Eighth Australasian Data Mining Conference,
volume 101, pages 93–98. Australian Computer Soci-
ety, Inc.
Sivarajah, U., Kamal, M. M., Irani, Z., and Weerakkody, V.
(2017). Critical analysis of big data challenges and
analytical methods. Journal of Business Research,
70:263–286.
Tan, P.-N., Steinbach, M., and Kumar, V. (2005). Introduc-
tion to data mining. New York, NY : Pearson Educa-
tion, Inc., New York, NY.
Tang, M. J., Mendis, B. S. U., Murray, D. W., Hu, Y.,
and Sutinen, A. (2010). Unsupervised fraud detection
in Medicare Australia. Conferences in Research and
Practice in Information Technology Series, 121:103–
110.
Templ, M., Gussenbauer, J., and Filzmoser, P. (2020). Eval-
uation of robust outlier detection methods for zero-
inflated complex data. Journal of Applied Statistics,
47(7):1144–1167.
Thornton, D., Van Capelleveen, G., Poel, M., Hillegersberg,
J., and Mueller, R. (2014). Outlier-based health insur-
ance fraud detection for U.S. Medicaid data. ICEIS
2014 - Proceedings of the 16th International Confer-
ence on Enterprise Information Systems, 2:684–694.
Webber, W., Moffat, A., and Zobel, J. (2010). A similarity
measure for indefinite rankings. ACM Trans. Inf. Syst.,
28(4). Article 20.
Weiss, S. M., Kulikowski, C. A., Galen, R. S., Olsen,
P. A., and Natarajan, R. (2015). Managing healthcare
costs by peer-group modeling. Applied Intelligence,
43(4):752–759.
Yamanishi, K., Takeuchi, J.-I., Williams, G., and Milne, P.
(2004). On-line unsupervised outlier detection using
finite mixtures with discounting learning algorithms.
Data Mining and Knowledge Discovery, 8(3):275–
300.
Yang, J., Xie, M., and Goh, T. (2011). Outlier identifica-
tion and robust parameter estimation in a zero-inflated
poisson model. Journal of Applied Statistics, 38:421–
430.
HEALTHINF 2023 - 16th International Conference on Health Informatics
40
