
Assessing Situation Awareness (SA) Using Single- or Dual-Location
functional Near Infrared Spectroscopy (fNIRS)
Bethany K. Bracken
1
, Aaron Winder
1
, Brandon Hager
1
, Mica R. Endsley
2
and Elena K. Festa
3
1
Charles River Analytics, 625 Mount Auburn St., Cambridge, MA, 02138, U.S.A.
2
SA Technologies, LLC, 5301 S. Superstition Mountain Drive, Suite 104377, Gold Canyon, AZ, 85118 U.S.A.
3
Brown University, 190 Thayer St, Providence, RI 02912, U.S.A.
Keywords: Cognitive Workload, Situation Awareness (SA), Training.
Abstract: To operate effectively across a variety of environments, personnel (e.g., air traffic controllers, pilots, truck
drivers, emergency response crews) need to be trained to the point at which their responses are automatic. If
their responses require high mental effort when carried out in emergency situations, they may be unable to
perform or to establish situation awareness (SA) needed to perform and to keep themselves safe. We have
been developing a software application to assess cognitive workload (i.e., mental effort) during task
performance using functional near-infrared spectroscopy (fNIRS). Here we present our work toward
extending this human state assessment software to include SA. We used a driving task (Crundall & Kroll,
2018; Muela et al., 2021) in which participants saw a clip of someone driving from a first person perspective
followed by a Level 3 SA (prediction) question asking what hazard was about to occur. Participants were 22
Brown University undergraduate and medical students (8 females) with an average age of 22.2 (SD=4.7) and
22 Army personnel in one of the U.S. Army installations with an average age of 49 (SD=11). We were able
to predict performance on the SA questions using the fNIRS data, at the group level (mean accuracy = 65%
in Brown students, 71% in Army personnel, and 65% in the combined datasets). We were also able to predict
SA performance of individual participants with a mean accuracy of 69% (range = .45-.88). This adds to the
growing literature indicating that neurophysiological information, even when data is acquired at a single
location, is useful for predicting individual SA.
1 INTRODUCTION
To operate effectively across a variety of
environments, personnel (e.g., air traffic controllers,
pilots, truck drivers, emergency response crews) must
act quickly and effectively in situations that can be
highly stressful. Personnel who experience cognitive
overload due to inexperience or lack of skill may
hesitate, make judgment errors, or fail to attend to
critical situational details; therefore, they must train
to ensure skills transfer to operational environments
(e.g., long durations of chaotic traffic, long duration
travel, retrieving patients from active crime scenes, or
disaster response scenarios).
Those who have not mastered critical skills to the
point of automaticity will be unable to establish and
maintain situation awareness (SA), especially during
chaotic battlefield conditions. This includes
perceiving relevant elements in the environment
(Level 1), understanding their meaning (Level 2), and
projecting their status into the near future (Level 3)
(Endsley, 1995). SA has been shown to be critical for
effective performance in complex environments
(Endsley, 2021).
Realistic training simulations (e.g., computer
simulators, medical simulation centers) provide
opportunity to practice and hone skills; however,
even the most rigorous training cannot ensure that
personnel will perform effectively in the highest
stress conditions. Currently, trainers must infer
trainee competence through observation (e.g., did
they hesitate before making a decision, did they
communicate poorly with teammates). However,
when trainees appear to be performing at similar skill
levels, even highly experienced trainers cannot
always reliably determine whether task execution still
requires significant individual cognitive resources or
whether individuals have been effective at
understanding and interpreting information relevant
to task performance.
Bracken, B., Winder, A., Hager, B., Endsley, M. and Festa, E.
Assessing Situation Awareness (SA) Using Single- or Dual-Location functional Near Infrared Spectroscopy (fNIRS).
DOI: 10.5220/0011610000003414
In Proceedings of the 16th International Joint Conference on Biomedical Engineering Systems and Technologies (BIOSTEC 2023) - Volume 4: BIOSIGNALS, pages 149-154
ISBN: 978-989-758-631-6; ISSN: 2184-4305
Copyright
c
2023 by SCITEPRESS – Science and Technology Publications, Lda. Under CC license (CC BY-NC-ND 4.0)
149
Through multiple Phase I and II SBIR efforts, we
have designed and developed a physiological system
to assist trainers by providing quantitative
information about trainee cognitive state. The
advantage of such a system is that it can collect
continuous data on trainees that may be used to detect
problems such as cognitive overload or low SA,
affording trainers the ability to make intervention as
needed. Physiological data collection also has the
advantage of not requiring additional inputs from
trainees (such as questionnaire or probe data).
The hardware component is our custom functional
near-infrared spectroscopy (fNIRS) sensor, which
uses fNIRS to non-invasively assess changes in the
oxygenation of blood in the brain, which provides a
robust, accurate, and real-time assessment of human
state (e.g., cognitive workload (Ayaz et al., 2012;
Bracken et al., 2019; Bunce et al., 2011; Xu et al.,
2019), and potentially SA (Hirshfield et al., 2015;
McKendrick et al., 2016)). Our physiological sensors
are paired with our Sherlock™ software product,
which provides an end-to-end solution to collect,
analyze, visualize, and reason about human states,
such as workload.
Previous work has focused exclusively on
cognitive workload. Here we will present our work to
extend capability to also assess SA under our
Monitoring, Extracting, and Decoding Indicators of
Cognitive Workload (MEDIC) and Physiological
Index of Situation Awareness (PISA) efforts.
2 METHOD
The goal of the experiments was to provide a ground
truth (i.e., data on which we know how cognitive
workload or SA is being manipulated) in order to
ensure the models are producing an accurate estimate
of participant SA. In addition, we wanted to collect
data in a diverse population of participants to assess
whether the results are generalizable outside of a
university population.
2.1 Participants
Participants were 22 Brown University
undergraduate and medical students (8 females) with
an average age of 22.2 (SD=4.7) and 22 Army
personnel in one of the U.S. Army installations with
an average age of 49 (SD=11).
2.2 Sensors
We used the fNIRS Pioneer and fNIRS Explorer
sensors available at https://www.pluxbiosignals.
com/products/functional-near-infrared-spectroscopy-
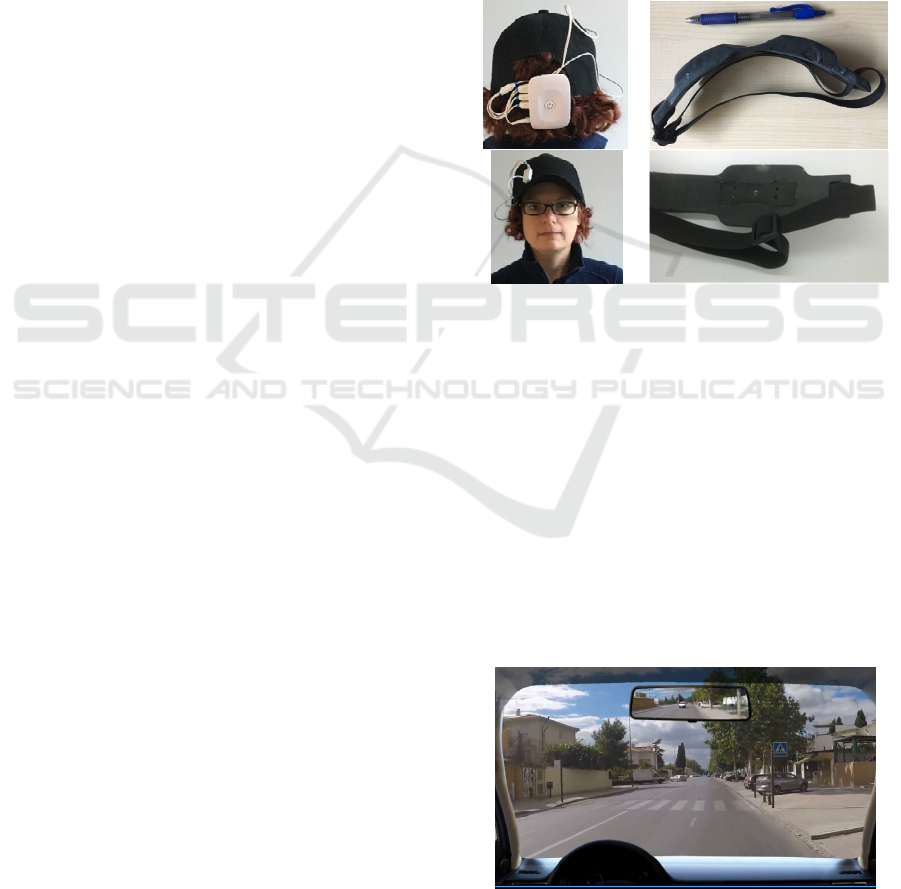
fnirs-sensor. The fNIRS Pioneer (Figure 1, left) is a
single channel system. One sensor was placed at F6
in the 10-20 EEG system (dorsolateral prefrontal
cortex; dlPFC), and a second sensor was placed at
FP2 (frontopolar prefrontal cortex). The fNIRS
Explorer (Figure 1, right) is a two-channel system
with an attached headband placed on the forehead
below the hair line at approximately FP2.
Figure 1: fNIRS Pioneer; a single channel sensor (left), an
d
fNIRS Explorer, a two-channel sensor (right). Note, the
image is the lead author on this paper, not a participant i
n
the study.
2.3 Experimental Task
We chose the driving hazard awareness task which
has been validated in a number of studies as
predictive of performance in driving (Crundall &
Kroll, 2018; Horswill, 2016) and is used as part of the
tests for obtaining a driver's license in several
countries. Participants are shown a driving video in
the first-person view. Videos were taken in Spain,
therefore driving is on the right side of the road (see
example screenshot in Figure 2)
Figure 2: Screenshot of a hazard perception video (Muela
et al., 2021).
BIOSIGNALS 2023 - 16th International Conference on Bio-inspired Systems and Signal Processing
150
We used a version of the hazard awareness task
that assesses level 3 SA (predicting future events), by
asking drivers to indicate what is likely to happen
next after watching a short video clip (Muela et al.,
2021). An example question and answer set is:
What is the driving hazard that is about to happen?
1. A truck is cutting us off.
2. A parked care is about to reverse into our
lane.
3. The car behind us is following too closely.
2.4 Data Analysis
To process the hazard awareness task fNIRS data, we
first normalized each subject’s data to a common
baseline with a time window of 30 seconds prior to
the onset of the first video. We then segmented the
data into task-specific epochs determined by the
variable durations of the observed videos and
response times. For each feature in Table 1, we
calculated the average feature value over the duration
of the task. This yielded point-like fNIRS features
that could be used to predict performance on each task
trial.
To build models to predict SA performance
(correct vs. incorrect responses to SA questions) from
fNIRS data used a logistic regression of the form:
log𝑓
𝑝𝑒𝑟𝑓𝑜𝑟𝑚𝑎𝑛𝑐𝑒
𝛽
𝛽
𝑋
where f(performance) is the logistic equation
(p(y))/(1-p(y)), β are the model coefficients, and X
are the model features.
3 RESULTS
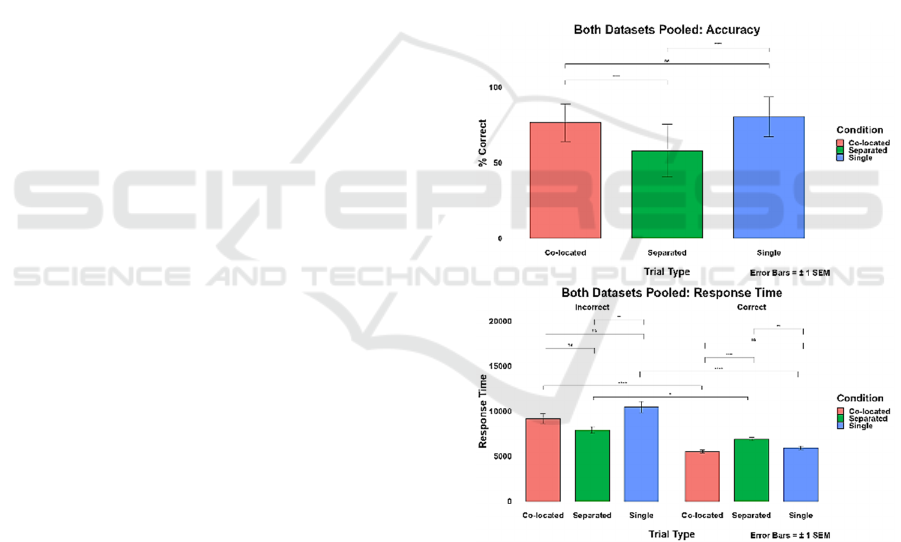
3.1 Behavioral Results
There were three types of hazard scenarios:
1. Single event in which one hazardous event
was present
2. Co-located dual events in which there were
two hazardous conditions present, in close
proximity with each other
3. Separated dual events in which there were
two events that occurred at different times
and locations (not in close proximity with
each other). This was the most difficult
condition with more errors expected because
attention could be incorrectly focused on the
potential hazard at a different location than
the real developing hazard
Behavioral results (Figure 3) were as expected
with the lowest accuracy occurring for the most
difficult condition (separated dual events) with 60%
accuracy for separated events, 78% for co-located
events, and 80% for single events. There were
significant differences between separated vs. co-
located events (t(36)=5.95, p<0.001) and separated
vs. single events (t(36)=6.00, p<0.001). Response
time was also longest in the separated dual events
condition—taking 7332 ms for separated, 6278 ms
for co-located, and 6647 ms for single events. There
were significant differences in response time between
separated vs. co-located events (t(36)=4.63,
p<0.001) and separated vs. single events (t(36)=2.62,
p<0.013) with longer response times associated with
greater likelihood of poorer performance accuracy.
Figure 3: Accuracy (top) and response time (bottom) results
were as expected. The lowest accuracy was on the most
difficult condition, dual events separated. The response
time data suggests that correct responses take longer to
consider when dual events are separated relative to the other
conditions. Additionally, when responses are incorrect, the
simplest condition takes longer to consider, while the most
complex (separated) takes less time. *p<0.05, **p<0.01,
***p<0.001.
Features used in the model predicting SA
performance from neurophysiological data are shown
in Table 1.
Assessing Situation Awareness (SA) Using Single- or Dual-Location functional Near Infrared Spectroscopy (fNIRS)
151
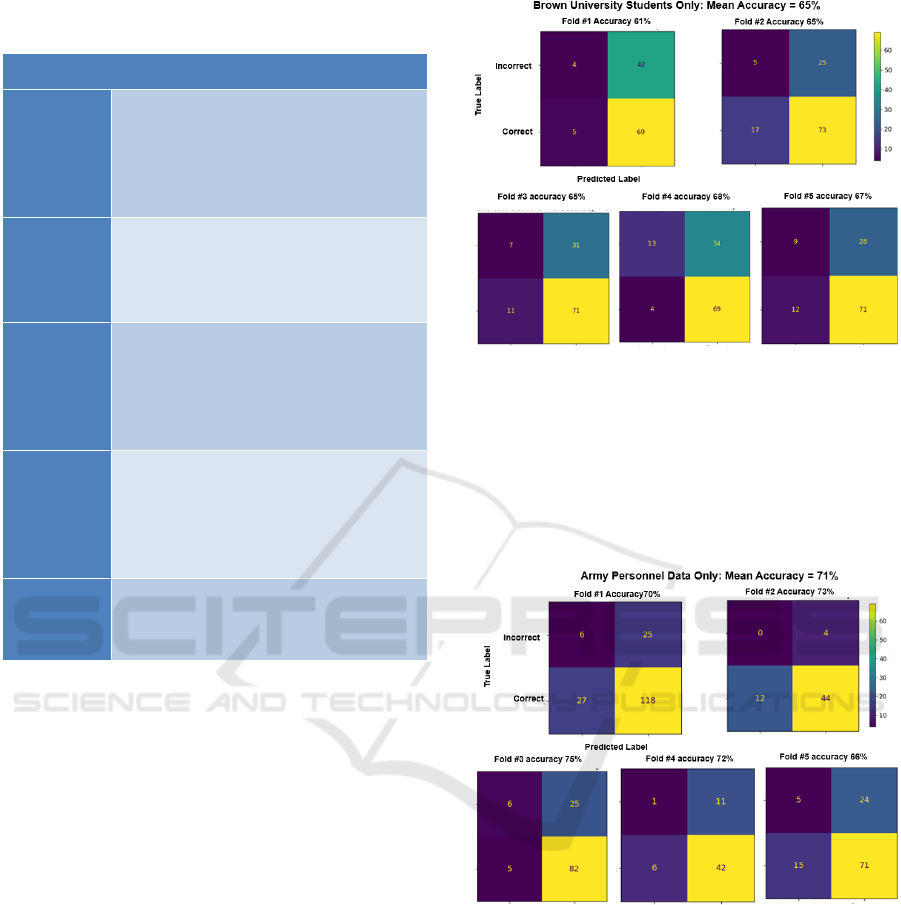
Table 1: Features used in analysis of physiological results,
and rationale for each.
Feature Rationale/Hypothesis
Signed
HbO /
HbR
amplitude
Amplitude changes in hemoglobin
concentrations correspond to level of
neural activity according to the
known neuroscience principles of
neurovascular coupling
Unsigned
HbO /
HbR
amplitude
Amplitude changes matter, but their
sign with respect to a baseline is not
as important
HbO /
HbR
direction
Precise amplitude of the fNIRS signal
is not as important as its direction
with respect to some baseline
(competing hypothesis to that
proposed by the unsigned amplitude)
HbO /
HbR
variance
Increased neural activity (and by
extension, SA) leads to a non-linearly
related fluctuation in the fNIRS
signal which is expressed by
increased variance in the signal
HbO /
HbR
derivative
Rate of change of fNIRS signal gives
information about level of SA
The first goal was to address the general
predictive power of the model features and
understand the variability of predictive power among
individual subjects. To quantify the general predictive
power, data was grouped into training and testing sets
ensuring no overlap of subjects with a ratio split of
60:20:20 for training, test, and validation sets,
respectively. We trained the model on 14-15
participants and tested and validated logistic
regression model performance on between 2 and 6
participants. We repeated this training and testing
process five times (i.e., five-fold cross validation) and
assembled each iteration of the model test results into
a confusion matrix, which shows the number of
correct responses predicted by the models (i.e., true
positives), incorrect responses predicted by the
models (i.e., true negatives), and incorrectly predicted
responses (i.e., false positives and false negatives).
The confusion matrices for the Brown University
student participants are shown in Figure 4. The
accuracy for fold 1 was 61%, for fold 2 was 65%, for
fold 3 was 65%, for fold 4 was 68%, and for fold 5
was 67%. The mean accuracy was 65%.
Figure 4: Confusion matrix for predicting SA from fNIRs
data for Brown University students only. Mean accuracy is
65%.
The confusion matrices for Army personnel data
only are shown in Figure 5. The accuracy for fold 1
was 70%, for fold 2 was 73%, for fold 3 was 75%, for
fold 4 was 72%, and for fold 5 was 66%. Mean
accuracy was 71%.
Figure 5: Confusion matrix for predicting SA from fNIRS
data for Amy personnel only. Mean accuracy is 71%.
Next, to examine model performance on a larger
dataset, data from both participant populations were
combined to see whether doubling the size of the data
set improved the predictive power of the model. We
trained the model on 30 participants and tested
logistic regression model performance on 11
participants for the test set and three for the validation
set. We repeated this training and testing process five
times (i.e., five-fold cross validation) and assembled
each iteration of the model test results into a
confusion matrix. The confusion matrices for data
BIOSIGNALS 2023 - 16th International Conference on Bio-inspired Systems and Signal Processing
152
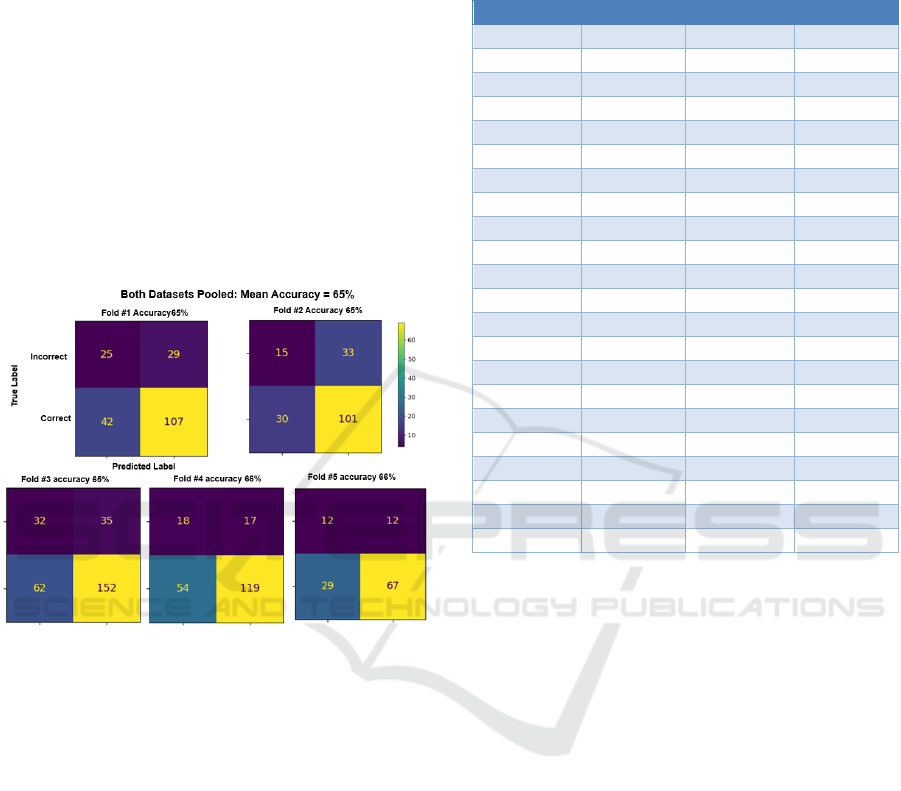
from both Brown University students and Army
personnel is shown in Figure 6. The accuracy for fold
1 was 65%, for fold 2 was 65%, for fold 3 was 65%,
for fold 4 was 66%, and for fold 5 was 66%. Mean
accuracy of the combined model for predicting level
3 SA in the driving task is 65%.
Our conclusion from this analysis is that we were
able to build a good predictive model of level 3 SA
based on fNIRS data with accuracy ranging from 65%
in the Brown University students to 71% in Army
personnel. However, data from the combined datasets
did not improve model accuracy. We hypothesize that
accuracy was higher in the Army personnel because
they were older, and therefore may have had more
driving experience (including international driving
experience) than the Brown University students.
Figure 6: Confusion matrix for combined data from both
Brown University students and Army personnel. Mean
accuracy was 65%.
Next, to examine the model’s ability to predict SA
performance using neurophysiological data among
individual participants, we trained the model on all
but one participant and then tested the trained model
of the participant that was omitted from the training.
Results are shown in Table 2.
The mean accuracy at predicting level 3 SA of
individual participants is 69%, ranging between 45%
and 88%. We conclude that the model shows a slight
increase in accuracy when applied to individual
participants.
4 CONCLUSIONS
With this initial data analysis from a driving task in
which participants viewed videos of impending
hazards from the first-person perspective of the driver,
Table 2: Results of model to predict level 3 SA accuracy
using neurophysiological data for each individual
participant (leave one out validation). Mean accuracy =
69%.
Participan
t
Accurac
y
Participan
t
Accurac
y
Brown 1 0.67 Arm
y
1 0.65
Brown 2 0.53 Arm
y
2 0.78
Brown 3 0.73 Arm
y
3 0.76
Brown 4 0.53 Arm
y
4 0.64
Brown 5 0.63 Arm
y
5 0.73
Brown 6 0.67 Arm
y
6 0.79
Brown 7 0.63 Arm
y
7 0.57
Brown 8 0.53 Arm
y
8 0.74
Brown 9 0.77 Arm
y
9 0.87
Brown 10 0.73 Arm
y
10 0.64
Brown 11 0.60 Arm
y
11 0.75
Brown 12 0.63 Arm
y
12 0.88
Brown 13 0.73 Arm
y
13 0.78
Brown 14 0.63 Arm
y
14 0.73
Brown 15 0.70 Arm
y
15 0.58
Brown 16 0.45 Arm
y
16 0.88
Brown 17 0.80 Arm
y
17 0.72
Brown 18 0.60 Arm
y
18 0.85
Brown 19 0.63 Arm
y
19 0.70
Brown 20 0.67 Arm
y
29 0.70
Brown 21 0.60 Arm
y
21 0.77
Brown 22 0.60 Arm
y
22 0.78
we have shown that we can build a good predictive
model of level 3 SA on upcoming hazards. We have
also shown that we can improve model performance
for many individual participants if we apply the
model to their new (not previously seen by the model)
data only (not pooled with other participants.
Level 3 SA, the ability to predict what is likely to
happen, is considered the highest level of situation
awareness and reflects high levels of expertise. It
allows people to be proactive in their decision
making, rather than just reactive. For example, hazard
awareness in driving has been shown to increase with
experience and to be related to reduced accidents. If
the physiological correlates of level 3 SA (e.g, ability
to detect and recognize key information in a visual
scene) can be modelled, this work can be extended to
many other domains and tasks in which the presence
of level 3 SA is important.
We continue to build, optimize, and integrate
models assessing SA into our Sherlock software that
can be transitioned into military training sites to
unobtrusively assessing SA during training. Our goal
is to transition MEDIC to live military (e.g., Fort
Bragg, Fort Indiantown Gap) and civilian training
environments (e.g., University of Massachusetts
Medical School, Mayo clinic).
Assessing Situation Awareness (SA) Using Single- or Dual-Location functional Near Infrared Spectroscopy (fNIRS)
153

In 2022, the DoD requested almost $112.6B on
training (Office of Under Secretary of Defense,
2021). A comprehensive understanding of trainee
knowledge acquisition and skill application will both
improve educational assessment techniques and
increase cost-effectiveness of medical team training
practices by enabling trainers to focus on areas where
trainees require the most improvement.
ACKNOWLEDGEMENTS
This material is based upon work supported by the
DHA SBIR Program/U.S. Army Medical Research
and Development Command (USAMRDC)
/Congressionally Directed Medical Research
Programs (CDMRP) under Contract No. W81XWH-
20-C-0058. Any opinions, findings and conclusions
or recommendations expressed in this material are
those of the author(s) and do not necessarily reflect
the views of the U.S. Army Medical Research and
Development Command (USAMRDC) or the U.S.
Army Medical Research Acquisition Activity
(USAMRAA).
Disclaimer: In the conduct of research where
humans are participants, investigators adhered to the
policies regarding the protection of human
participants as prescribed by Code of Federal
Regulations (CFR) Title 45, Volume 1, Part 46; Title
32, Chapter 1, Part 219; and Title 21, Chapter 1, Part
50 (Protection of Human Participants).
The research described herein was in part based
on data collected under U.S. Army Research Institute
for the Behavioral and Social Sciences contract
(W911NF-19-C-0072), “Assessing Situation
Awareness in Complex Operations” (Point of
Contact: Dr. Cary Stothart). The views expressed in
this presentation are those of the authors and do not
reflect the official policy or position of the U.S. Army
Research Institute for the Behavioral and Social
Sciences, Department of the Army, Department of
Defense, or the U.S. Government.
REFERENCES
Ayaz, H., Shewokis, P. A., Bunce, S., Izzetoglu, K.,
Willems, B., & Onaral, B. (2012). Optical brain
monitoring for operator training and mental workload
assessment. NeuroImage, 59(1), 36–47. https://doi.org/
10.1016/j.neuroimage.2011.06.023
Bracken, B., Festa, E., Sun, H.-M., Leather, C., &
Strangman, G. (2019). Validation of the fNIRS
Pioneer
TM
, a Portable, Durable, Rugged Functional
Near-Infrared Spectroscopy (fNIRS) Device. In
Biomedical Engineering Systems and Technologies:
12th International Joint Conference, BIOSTEC 2019,
Prague, Czech Republic, February 22–24, 2019.
Springer.
Bunce, S. C., Izzetoglu, K., Ayaz, H., Shewokis, P.,
Izzetoglu, M., Pourrezaei, K., & Onaral, B. (2011).
Implementation of fNIRS for monitoring levels of
expertise and mental workload. International
Conference on Foundations of Augmented Cognition,
13–22. https://doi.org/10.1007/978-3-642-21852-1_2
Crundall, D., & Kroll, V. (2018). Prediction and perception
of hazards in professional drivers_ Does hazard
perception skill differ between safe and less-safe fire-
appliance drivers? | Elsevier Enhanced Reader.
Accident Analysis & Prevention, 121, 335–346.
Endsley, M. R. (1995). Toward a Theory of Situation
Awareness in Dynamic Systems. Human Factors: The
Journal of the Human Factors and Ergonomics Society,
37(1), 32–64.
Endsley, M. R. (2021). A systematic review and meta-
analysis of direct objective measures of situation
awareness: A comparison of SAGAT and SPAM.
Human Factors, 63(1), 124–150.
Hirshfield, L., Costa, M., Bandara, D., & Bratt, S. (2015).
Measuring situational awareness aptitude using
functional near-infrared spectroscopy. International
Conference on Augmented Cognition, 244–255.
Horswill, M. S. (2016). Hazard perception in driving.
Current Directions in Psychological Science, 25(6),
425–430.
McKendrick, R., Parasuraman, R., Murtza, R., Formwalt,
A., Baccus, W., Paczynski, M., & Ayaz, H. (2016). Into
the wild: Neuroergonomic differentiation of hand-held
and augmented reality wearable displays during
outdoor navigation with functional near infrared
spectroscopy. Frontiers in Human Neuroscience, 10,
216.
Muela, I., Chica, A. B., Garcia-Fernandez, P., & Castro, C.
(2021). Visual attention in realistic driving situations:
Attentional capture and hazard prediction. Applied
Ergonomics, 90, 103235. https://doi.org/10.1016/
j.apergo.2020.103235
Office of Under Secretary of Defense. (2021). United States
Department of Defense Fiscal Year 2022 Budget
Request.
Xu, J., Slagle, J. M., Banerjee, A., Bracken, B., & Weinger,
M. B. (2019). Use of a Portable Functional Near-
Infrared Spectroscopy (fNIRS) System to Examine
Team Experience During Crisis Event Management in
Clinical Simulations. Frontiers in Human
Neuroscience, 13, 85. https://doi.org/10.3389/fnhum.
2019.00085.
BIOSIGNALS 2023 - 16th International Conference on Bio-inspired Systems and Signal Processing
154
