
Virtual Reality Simulation for Multimodal and Ubiquitous System
Deployment
Fabrice Poirier
1
, Anthony Foulonneau
1
, J
´
er
´
emy Lacoche
1 a
and Thierry Duval
2 b
1
Orange, 2 Av. de Belle Fontaine, Cesson-S
´
evign
´
e, France
2
IMT Atlantique, Lab-STICC, Brest, France
Keywords:
Applications, Simulation, Prototyping/Implementation, Virtual Reality.
Abstract:
Multimodal IoT-based Systems (MIBS) are ubiquitous systems that use various connected devices as interfaces
of interaction. However, configuring and testing MIBS to ensure they correctly work in one’s own environment
is still challenging for most users: the trial and error process in situ is a tedious and time-consuming method.
In this paper, we aim to simplify the installation process of MIBS. Thus, we propose a new VR methodology
and a tool that allow the configuration and evaluation of MIBS thanks to realistic simulation. In our approach,
users can easily test various devices, devices locations, and interaction techniques without prior knowledge
or dependence on the environment and devices availability. Contrary to on-the-field experiments, there is no
need to access the real environment and all the desired connected devices. Moreover, our solution includes
feedback features to better understand and assess devices interactive capabilities according to their locations.
Users can also easily create, collect and share their configurations and feedback to improve the MIBS, and to
help its installation in the real environment. To demonstrate the relevance of our VR-based methodology, we
compared it in a smart home with a tool following the same configuration process but on a desktop setup and
with real devices. We show that users reached comparable configurations in VR and on-the-field experiments,
but the whole configuration and evaluation process was performed faster in VR.
1 INTRODUCTION
In recent years, the spread of the Internet of Things
(IoT) has brought a lot of connected devices into our
surroundings. These sensors and actuators that sur-
round us simplify our interactions with the environ-
ments we live in, such as homes, offices, and fac-
tories. Moreover, they can provide a diversity of
modalities (e.g. vocal, visual) at a larger scale, which
renews the interest in multimodal interactions (Pru-
vost, 2013; Peters et al., 2016). More specifi-
cally, they allow the development of ubiquitous sys-
tems (Weiser, 1991) such as Multimodal IoT-Based
Systems (MIBS) (Poirier et al., 2022) that use con-
nected devices as medium of interactions. While there
are already instances of such systems in the litera-
ture, such as the ubicomp home assistant presented in
(Almeida et al., 2019), the interactive museum game
in (Manca and Patern
`
o, 2016) or the supermarket
shopping application in (Ghiani et al., 2015), MIBS
a
https://orcid.org/0000-0003-3926-7768
b
https://orcid.org/0000-0003-4300-1671
are not currently available off-the-shelf because it is
still difficult for MIBS administrators (i.e. people in
charge of the MIBS deployment, generally building
administrators or end-users) to easily and fully adapt
these systems to their own ubicomp environments.
Indeed, the usability of a MIBS depends on the
targeted environment topologies, on the interaction
techniques alternatives, on the selected connected de-
vices, and on the end-user profiles (Pittarello and
Celentano, 2007). These parameters are specific
to each environment and end-users, they cannot be
fully anticipated beforehand. Thus, MIBS adminis-
trators need to test various configurations (i.e. inter-
action techniques, connected devices and their loca-
tions in an environment), resorting to installation tools
(Tavakolizadeh et al., 2019) and documentations (Mi-
claus et al., 2014) to guide them, until they find a
satisfactory configuration. requires technical knowl-
edge, takes time, and the feedback coming from IoT-
based systems could be difficult to understand for a
MIBS administrator. To allow non-technical users to
configure and test interactive applications in ubicomp
environments, recent work has investigated the use
Poirier, F., Foulonneau, A., Lacoche, J. and Duval, T.
Virtual Reality Simulation for Multimodal and Ubiquitous System Deployment.
DOI: 10.5220/0011609900003417
In Proceedings of the 18th International Joint Conference on Computer Vision, Imaging and Computer Graphics Theory and Applications (VISIGRAPP 2023) - Volume 2: HUCAPP, pages
125-136
ISBN: 978-989-758-634-7; ISSN: 2184-4321
Copyright
c
2023 by SCITEPRESS – Science and Technology Publications, Lda. Under CC license (CC BY-NC-ND 4.0)
125

of Virtual Reality (VR) and Augmented reality (AR)
tools (Suzuki et al., 2019; Lacoche and Villain, 2022).
This way, users can have a better spatial understand-
ing of the configuration process, but there is no sup-
port for the deployment of more elaborated and longer
interactions that can come across in MIBS.
This is why we propose a new VR-based method-
ology and a tool for MIBS administrators to configure
and evaluate MIBS in realistic modeled environments
before deployment. MIBS administrators are im-
mersed in a digital twin (Grieves and Vickers, 2017)
of the target environment. Such a digital twin includes
information about the geometry of the target environ-
ments as well as information on the characteristics
and behaviours of target connected devices. Thus, the
administrators can observe and move similarly to real-
ity during the configuration and the test process. The
proposed tool facilitates the deployment process for
MIBS administrators. First, it allows MIBS adminis-
trators to select services, interaction techniques and to
manipulate simulated devices simply and effortlessly.
Second, it is possible to evaluate in VR the configured
services to provide a similar experience than in real-
ity, without needing any real device or access to the
real environment. Thus, our choice of VR over AR
allows to support the use cases where buildings are
not available. Finally, MIBS administrators are able
to provide feedback to MIBS producers (e.g. develop-
ers or designers) or to generate data facilitating the in-
stallation of the configured services in a real environ-
ment. A study demonstrates that our methodology is
better suited for MIBS configuration and testing than
on-the-field (OTF) experiments (i.e. test the system in
the actual space with real devices).
In section 2 we present a review of the related
work. Then, in section 3 we introduce the MIBS Con-
figuration and Evaluation methodology, the VR tool
we created, followed by a presentation of the study
and a discussion of the results in section 5. Finally,
we conclude and present perspectives for future work.
2 RELATED WORK
The deployment of an ubiquitous system in one’s own
environment is an important step in this system life
cycle, and is in most cases up to its administrator
(Beckmann et al., 2004). To assist him, most of the
approaches provide tools to facilitate the systems con-
figuration and test processes. These tools can be clas-
sified into three categories. First, the most common
ones are the 2D graphical desktop tools that support
the association process between the devices and the
system. Second, some desktop tools also include fea-
tures to improve the visualisation and manipulation of
spatial information. Third, more recent work harness
the immersive potential of VR and AR to facilitate the
deployment of IoT services.
2.1 Tools for Multimodal Interactions
ICON (Dragicevic and Fekete, 2001) is a developer
tool to configure multimodal systems. Users graphi-
cally assemble software components to create a given
service, or use preexisting ones and modify them. It
provides a separation between a service and the de-
vices capabilities, but requires technical knowledge to
create functional interaction techniques, and doesn’t
include usability evaluation features. The dynamic
customization tool in (Manca and Patern
`
o, 2016) en-
ables users to distribute different parts of the interface
across devices. They can also modify the distribu-
tion of the interface while testing the system. How-
ever, interaction techniques cannot be selected inde-
pendently from the available devices. With MIBO
IDE (Peters et al., 2016), interaction techniques can
be assembled from easy-to-understand components
without programming skills. Here, devices are pre-
processed to only show the modalities they can of-
fer, and the configurations are compared to find pos-
sible conflicts. Moreover, this tool displays the events
generated by the system at runtime. All these graph-
ical tools are easy-to-use and support the selection
of devices and interaction techniques for a desired
service. Some tools even provide support to evalu-
ate the configurations. However, they do not handle
the spatial distribution of devices in the environment,
which is essential in MIBS (Pittarello and Celentano,
2007). Indeed, multimodal interactions can require
the cooperation of multiple modalities to work prop-
erly, and these modalities are provided by different
devices placed at different locations in MIBS.
2.2 Tools for Spatialized Interactions
Biehl & Bailey (Biehl and Bailey, 2006) provide a
tool to associate applications to situated displays and
tablets using a top view of the modeled room. Users
have a better understanding and performance with
their spatial representation than with a simpler tool
without spatial information. However, this tool is lim-
ited to the configuration process. To help ergonomists
configure and evaluate MIBS, Pruvost proposed three
tools: the ontology editor ”Describe” to model the
environment, the rule editor ”Behave” to define the
system behaviour, and the simulation tool ”Simu-
late” (Pruvost, 2013). The latter is a tool to test MIBS
behaviours with different sets and locations of simu-
HUCAPP 2023 - 7th International Conference on Human Computer Interaction Theory and Applications
126

lated devices and people. Devices and people are rep-
resented as icons while the environment is represented
as multiple schematic areas. Their evaluation ap-
proach with simulation has the benefit of evaluating a
larger panel of configuration at low development cost.
Nevertheless, this approach requires knowledge on
ontologies and logical rules to configure MIBS. Re-
cent work on the notion of proxemics (Chaoui et al.,
2022) provide partial support to configure and eval-
uate MIBS. Proxemics is a paradigm to describe re-
lations between entities (e.g. devices, users, furni-
ture). For example, the distance and motion of a tablet
relative to a camera could be used to define the be-
haviour of these devices. The Proximity toolkit (Mar-
quardt et al., 2011) is a monitoring tool built on this
paradigm to better grasp the link between the system
behaviour and the locations of the devices and users.
The graphical tool in (Ghiani et al., 2015) provides a
simpler vocabulary for the proxemics (e.g. ”near to”
or ”when user is moving”) to adapt the distributed in-
terface to the entities proxemics. Although these tools
support spatialized interactions, users only have ac-
cess to 2D representations of environments or textual
information during the configuration process. Hav-
ing a 3D representation can benefit to this process
as some information cannot be visualized in 2D, or
conceptualized from textual information only. For ex-
ample, when configuring an interaction with cameras,
one need to be careful about their horizontal and ver-
tical view angles, as well as the minimal and maximal
distances required to work properly.
2.3 Immersive Tools
AR and VR technologies have brought new possi-
bilities in 3D representations, immersion, and more
specifically in the configuration and interaction with
connected devices. Indeed, MIBS can be configured
and tested at scale one in a real environment (AR) or
in its digital twin (VR) when the real environment
is unavailable (i.e. in construction, renovated, too
far away or already in use). For instance, ExProto-
VAR (Pfeiffer and Pfeiffer-Leßmann, 2018) provides
a methodology to prototype from 360 panorama pic-
tures a Mixed Reality (MR) interactive system inter-
acting with connected devices. The support of spa-
tialized and situational interfaces, as well as the an-
notation and recording features, facilitate the creation
and sharing of new designs by the system producers.
Suzuki et al. (Suzuki et al., 2019) proposed the AR
tool ReallifeEngine where the devices can be linked
through visual programming interfaces. Thus, it is
possible to create automation scenarios without tech-
nical knowledge while considering the device in the
real environment. The pipeline introduced in (La-
coche et al., 2019) also provides support for the man-
agement of connected devices. It includes the cre-
ation of the environment digital twin with AR and
VR. Moreover, the devices digital twins can simulate
realistic behaviours, thus the system can be tested in
VR independently of the real environment. In addi-
tion, Lacoche et al. (Lacoche and Villain, 2022) intro-
duced a VR authoring tool that can help non-technical
users adapt the interactive content elements in AR
applications depending on information collected by
connected devices. Another use of VR to configure
systems is the virtual commissioning (VC) for the in-
dustry 4.0 (Lechler et al., 2019). The VC consists
in the observation and validation of automation sys-
tems behaviour through hardware and software sim-
ulation, and it could be extended to interactive sys-
tems. For instance, Metzner et al. (Metzner et al.,
2020) present a method to integrate a human opera-
tor to test programmable logic controllers (PLC). Al-
though it is geared towards PLC producers and their
business partners during production, it provides an in-
tuitive and realistic device testing method. AR and
VR are powerful technologies to convert the logical
representation of interactive systems in intuitive and
easy-to-visualize information. However, the existing
tools are limited to MR services or IoT automation,
thus providing insufficient support for the manage-
ment of more complex and user-centered as multi-
modal interactive systems.
3 MCEV METHODOLOGY AND
TOOL
There is currently no tool that fully supports the con-
figuration and evaluation of MIBS. Thus, we pro-
pose MCEV: a MIBS Configuration and Evaluation
in VR methodology and tool to help MIBS adminis-
trators efficiently configure and test MIBS during the
installation process in various environments. MCEV
supports the selection of a MIBS context of use (i.e.
environment, devices, services and interaction tech-
niques), as well as MIBS simulations for immersive
testings. Moreover, MCEV provides several feedback
functionalities to share the configurations and evalua-
tion results.
Ergonomists could also apply the MCEV method-
ology to evaluate MIBS during their production, sim-
ilarly to the simulation methodology in (Loor et al.,
2006). The five steps of our methodology and our
tool interface are detailed in the next sections.
Virtual Reality Simulation for Multimodal and Ubiquitous System Deployment
127
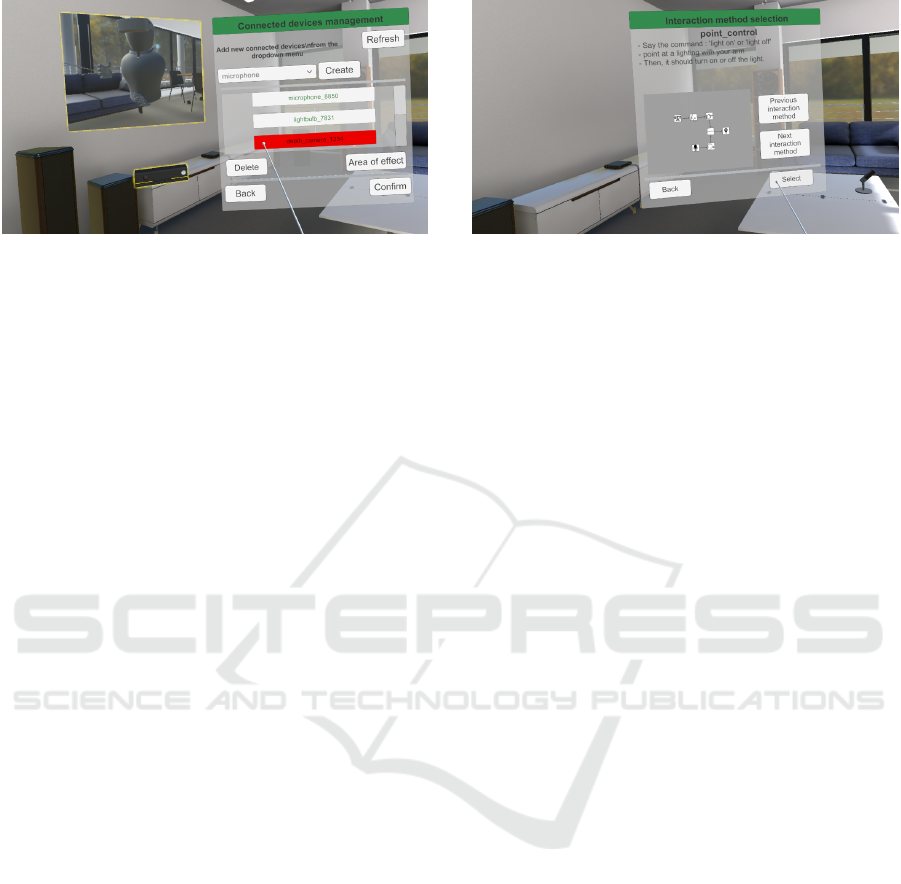
Figure 1: Device management menu.
3.1 Environment Selection
First, MIBS administrators import their environments
and select one at launch time. These environments
could be sandbox environments such as simplistic en-
vironments or demo environments provided by the
MIBS producers, or environments generated from the
digital twins of the target physical environment. The
creation of digital twins of devices and environments
could be seen as a constraint but we believe this is
not an obstacle nowadays: modern buildings are of-
ten described in Building Information Models (BIM),
and recent tools such as the AR capture tool pro-
posed in (Lacoche et al., 2019) can simplify this pro-
cess. Therefore, MIBS administrators can configure
and test MIBS in multiple and possibly huge virtual
environments without delay, even if the real environ-
ments are unavailable. To navigate in these virtual
environment, we provide a classic navigation feature
consisting in pointing at a desired position to instantly
move there.
In our evaluation introduced in Section 5, the dig-
ital twin was created from the model file (BIM) of
the building and then fine-tuned by a 3D graphic de-
signer. Nevertheless, digital twins of existing and
available environments could also be obtained with
capture tools such as (Soedji et al., 2020).
3.2 Connected Devices Management
To prospect changes in a real environment in prepa-
ration for a MIBS, the MCEV tool enables MIBS
administrators to instantiate simulated devices (e.g.
thermometer, connected speaker) in addition to those
already included in the 3D environments (see Figure
1). These simulated devices are composed of 3D rep-
resentations and scripted behaviours that reproduce
the behaviour of the real devices. For example, the
Kinect in Figure 1 has the same field of view than a
real Kinect. Each device can also be moved or rotated
by grabbing or selecting it with a ray.
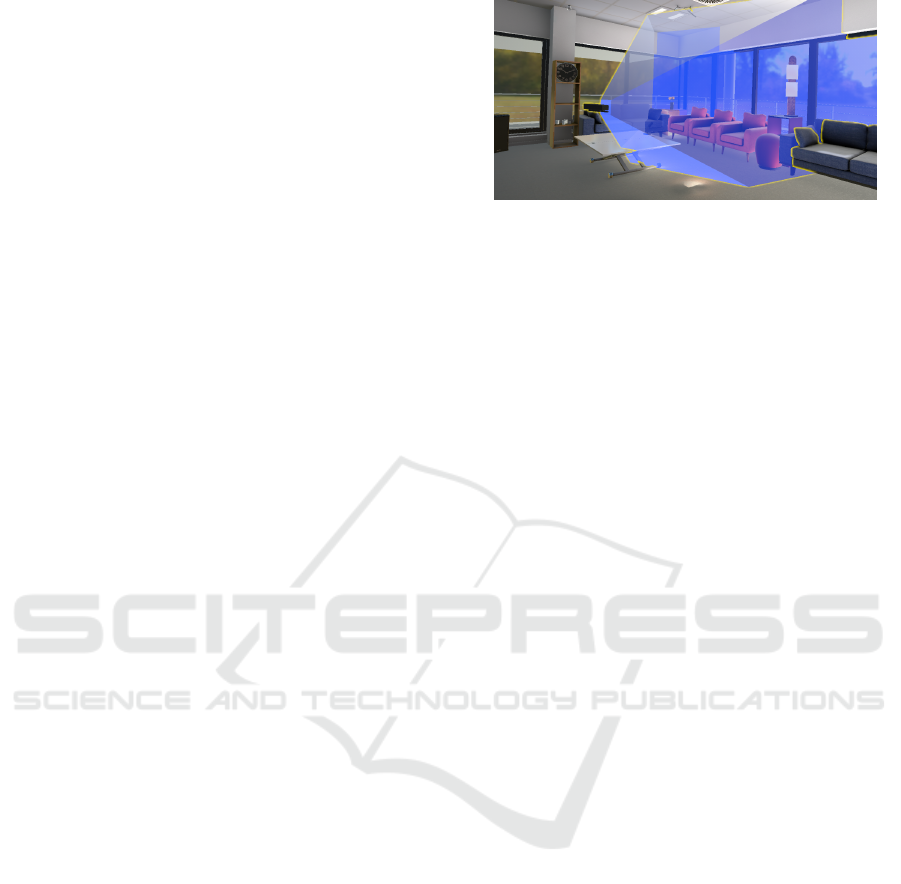
Moreover, the MCEV tool enables MIBS admin-
Figure 2: Interaction technique selection menu.
istrators to observe visually or orally (when it makes
sense) the aura (Benford and Fahl
´
en, 1993) of con-
nected devices, which are the areas in which they can
sense or be sensed, to help with the identification and
placement of these devices. For example, a MIBS ad-
ministrator can place a camera in front of chairs to
observe what it can see with its aura, as illustrated in
Figure 3. Representing these auras enables MIBS ad-
ministrators to rapidly and intuitively understand the
impact of a device location on its performance, and
find more easily a satisfactory location. Currently, our
tool includes several device models with their auras
that correspond to the real devices in our possession
and it can be extended to any other device.
3.3 Selection of Services and Associated
Interaction Techniques and Devices
The third step consists in selecting for each service
to configure an associated interaction technique and
devices that provide the necessary modalities.
For each service they want to configure, the MIBS
administrator selects an interaction technique. Inter-
action techniques are described and are illustrated by
a graphical representation of the associated software
component chains. For example, in Figure 2 the user
selected an interaction technique using a vocal com-
mand and a pointing gesture to turn on a pointed light
bulb. Thus, the MIBS administrator doesn’t need
technical knowledge to understand how to test a con-
figuration, but can obtain technical details by click-
ing on the different icons representing the component.
The MIBS administrator can also rapidly determine
what are the necessary modalities needed for the in-
teraction just by looking the extremities of the chains.
These interaction chains can be developed with one
of the graphical component composition tool for mul-
timodal systems, such as SKEMMI (Lawson et al.,
2010). Here, the MCEV tool imports files describing
possible interaction chains for each service, and pro-
vides simplified versions of these chains to the MIBS
administrator for better readability.
HUCAPP 2023 - 7th International Conference on Human Computer Interaction Theory and Applications
128
Then, for each required modality, the MIBS ad-
ministrator selects which devices to use. Each re-
quired modality can be associated to multiple de-
vices, either from the list in a 2D interface, or di-
rectly by pointing at the devices. The list of devices
the MIBS administrator can associate to an interac-
tion technique is limited to the devices that can pro-
vide one of the desired modalities. To help understand
the link between the two methods, the MIBS admin-
istrator can highlight each device and its identifier in
the list. Therefore, the MIBS administrator can se-
lect devices intuitively by directly pointing at them.
Moreover, the MIBS administrator also has a central-
ized view of the associations that simplify configura-
tion modification and multiple device selection.
The configuration features in our tool are accessed
through 2D user interfaces positioned in the 3D envi-
ronment. We provide a classic 3D ray-based selection
and manipulation technique to interact with these user
interfaces and with the devices (see Figure 1).
3.4 MIBS Evaluation
Then, MIBS administrators can test the service to
check the quality of experience offered by their con-
figurations.
To do so, the MCEV tool relies on an execu-
tion engine to run the configured services. The
execution engine is inspired by the state-of-the-art
component-based architectures such as the AM4I ar-
chitecture (Almeida et al., 2019) for their modular ap-
proach, ease of use and context awareness.
Then the simulated sensors generate information
and the actuators act accordingly to the commands
received from the system. Like in the virtual com-
missioning approaches in VR, the devices behaviours
included in the device models are based on the real de-
vices sensing and acting capabilities. Therefore, the
MIBS administrator can interact in VR as they would
do in OTF experiments.
During the test, the MIBS administrator can use a
console to find the received events from the devices,
the services, and the processing components of the in-
teraction techniques. Thus, it provides more insights
on the origin of a problem. This console is attached
to the non-dominant hand, and can be collapsed.
3.5 Collaborative Review
Once a MIBS is tested, either a configuration is sat-
isfactory and have to be deployed in the real environ-
ment, or there is a problem with the services, devices
or environment that may require providing an expla-
nation of the problematic context to the MIBS produc-
Figure 3: The auras of a camera (Kinect 2).
ers. To support both of these situations, the MCEV
tool incorporates three collaborative features.
First, MIBS administrators can write located and
time-stamped notes to describe the overall configura-
tion (e.g. advice or warnings when installing a con-
figuration), or during a test to notify about a specific
situation. Information about the current environment,
such as device positions, service state, and note posi-
tion are automatically saved in each note. Moreover,
the notes can be attached to devices or simply placed
at a specific position in the tested environment. Thus,
MIBS administrators can easily provide descriptive
feedbacks to MIBS producers.
Second, MIBS administrators can record and re-
play their actions in the tested environments. Thus,
they can check the impact of the MIBS use from
an external point of view. For example, the incon-
venience of vocal commands for other coworkers
could be more easily noticed this way. Moreover,
the recorded actions could be reused to test minor
changes (e.g. changing the microphone model doesn’t
impact the interaction process) effortlessly.
Finally, MIBS administrators can produce 2D
views of their configurations to help the ones in
charge of the deployment in the real environment. In-
deed, they can take screenshots from any location or
angle in the environment, and automatically generate
a 2D top-view map of the entire space with devices
locations marked. The screenshots also display the
localized notes that can be clicked to read them.
In addition, the notes, devices, and configurations
created can be saved in configuration files and can
be loaded to start from a preconfigured MIBS. There-
fore, alternative configurations for each environment
can be easily shared.
4 A 2D DESKTOP TOOL FOR OTF
AND MCEV COMPARISON
To evaluate the MCEV tool (see section 5), we needed
a graphical tool comparable to our tool that supports
OTF experiments on MIBS. As the existing graphical
Virtual Reality Simulation for Multimodal and Ubiquitous System Deployment
129
tools only provide limited support (e.g. devices po-
sition can’t be managed with the MIBO IDE (Peters
et al., 2016), and the Proximity tool (Marquardt et al.,
2011) only support the test process), we developed a
desktop tool for OTF experiments that supports the
configuration and test of spatialized and multimodal
interactions. To ensure a similar setup than in VR, the
desktop tool follows the same configuration process
as the MCEV tool, with an almost identical 2D inter-
face. Yet, there are notable differences between the
MCEV and desktop tools features.
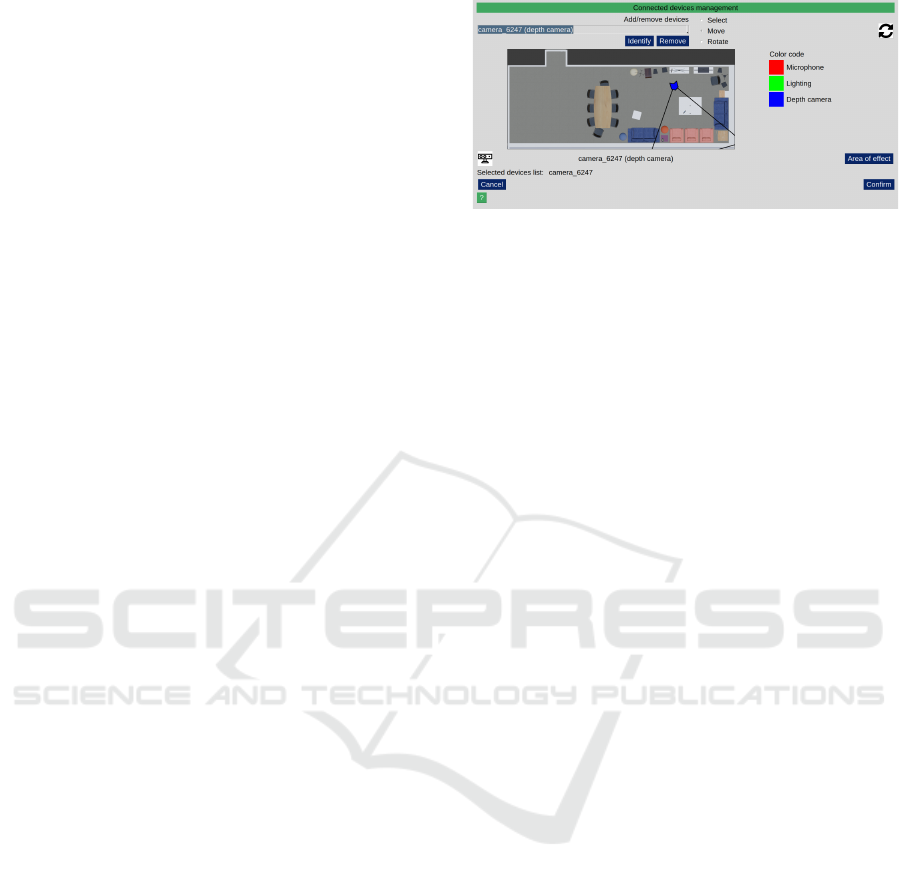
First, most connected devices can’t know by them-
selves their locations in the environment, and there
is no universal and automatic method to locate every
connected device (Brudy et al., 2019). Therefore, de-
vices locations are manually indicated with the desk-
top tool. It provides a 2D map generated from the
digital twin of the environment, as illustrated in Fig-
ure 4. On this map, the iconical representations of
the added devices can be moved and rotated to match
the real devices positions. Like with the 2D configu-
ration tools (chapter 2), this manual position tracking
method ignores the height and two degrees of free-
dom in rotation. These dimensions were not used in
our scenario so the positioning features capabilities of
the desktop tool were sufficient for the experiment.
Second, devices in our MCEV tool can be high-
lighted to identify them from their identifiers, but this
feature cannot be directly used in the OTF experiment
with the 2D tool. However, sensors feedbacks are
observable, and actuators can behave in a noticeable
way. Thus, for each device in our experiment, we im-
plemented a specific behaviour that the desktop tool
was able to initiate when an identification was needed
(e.g. camera feedback, light blinking). This feature
was added to provide a fair and reasonable counter-
part to the highlight feature of the MCEV tool.
Third, the devices auras in the desktop tool are
represented by their 2D views. 3D visualizations such
as in (Marquardt et al., 2011) were also considered,
but they require to use additional tracking devices,
which would create too much of a difference between
an experiment OTF and in VR. Thus, we integrated a
functionality to display or hide the aura of each de-
vice (e.g. the aura of a Kinect in Figure 4).
Finally, participants could associate devices by se-
lecting the icons on the 2D map. Thus, the association
process is based on a spatialized Point and click tech-
nique like for the method in VR.
Figure 4: Devices management in the desktop tool. Partic-
ipants identify the available devices and place them on the
top view representation of the room. The black lines repre-
sent the border of the Kinect aura.
5 EVALUATION OF MCEV
First, we want to determine if our MCEV tool could
help to configure and test MIBS faster than with the
desktop tool in OTF experiments, without degrading
the result. Second, we want to assess the cognitive
load and ease of use of our MCEV methodology com-
pared to OTF experiments. Indeed, even if most peo-
ple are more used to mouse-keyboard interactions, we
believe that VR can provide a more natural and effi-
cient way to configure MIBS thanks to 3D interac-
tions and navigation at scale one.
5.1 Experimental Context
To compare our MCEV methodology with OTF ex-
periments, we asked participants to configure and test
a light management service with both methodologies.
As illustrated in Figures 5 and 5, the environment in
VR was the same than in the OTF experiment.
5.1.1 The Light Management Scenarios
Our requirement for the experiment was to provide a
scenario that showcases the use of multimodal inter-
actions where the location of at least one connected
device has an impact on the result. Moreover, some
connected devices are difficult to install (e.g. power
supply, wall mount, narrow aura). Thus, we wanted
to use one such device. We avoided complex multi-
modal interactions as they can be difficult to use at
first for most users, and as providing many modal-
ity alternatives is a repetitive task which is unneces-
sary for an experiment. Therefore, participants had to
configure in VR and OTF a simple light management
service, which covers a use case suitable to various
environments (e.g. houses, offices).
This service consists in using vocal commands
and gestures to control two connected lightbulbs
placed at the same spots in the real environment and
HUCAPP 2023 - 7th International Conference on Human Computer Interaction Theory and Applications
130

in VR (see Figure 5). To represent use cases in which
some connected devices positions were already set
and unchangeable, the lightbulbs were already posi-
tioned and could not be moved. Only two modalities
in input (vocal and gestural) and one in output (lu-
minosity) were possible to provide multimodal inter-
action without unnecessary repetitions in the configu-
ration process. Participants had to use a microphone
and a depth camera for the vocal and gestures com-
mands. In the VR experiment, both devices had to be
instantiated and placed. In the real environment they
were in the room but purposely placed in wrong po-
sitions (see Figure 8), both devices were connected
by USB to a laptop that ran the desktop tool, and the
camera was fixed to a professional tripod adjustable
in angle and height. The depth camera was used as an
example of device that is difficult to install.
In addition to these devices that needed to be used
during the experiment, other devices were available.
Indeed, we wanted to recreate a scenario where con-
nected devices from outside of the considered envi-
ronment are available and detected. Thus, one light-
bulb and one microphone were simulated in both ex-
periments and were visible in the device identifiers
list, but the participants couldn’t find these devices
around them.
To facilitate the comparison of devices position-
ing, the interaction space was limited to a specific
area: participants were asked to configure the light
management service in order to be used from a spe-
cific location (seated on any of the three beige chairs
shown in Figure 5), with these techniques:
T1: control of the lighting with just the vocal com-
mand ”light” to turn ON or OFF the lightings
T2: control of the lighting with a pointing gesture and
a vocal command where the user needs to com-
mand orally to “turn on” or “turn off” a specific
light by pointing at it.
T3: control of the lighting with a vocal command as
a trigger to start or stop and considering the hand
position to change the lightings intensity.
T1 was a monomodal interaction technique to learn
the configuration process while participants tested T2
and T3 with both tools.
To provide similar conditions between the VR and
OTF experiment, the VR environment was a high-
fidelity replication of the real environment, which was
a meeting room dedicated to user experiments that
replicates a living room. In the VR environment, par-
ticipants were embodied by a body composed of two
hands and a body (see camera feedback in Figure 1).
This body representation aimed to help participants
situate themselves when they use the camera feed-
back, similarly to the real camera feedback.
5.1.2 Procedure
Participants had to experiment with both tools succes-
sively. They started with an explanation of the exper-
imentation procedure. Then, for each tool, they had
a training stage to get familiar with the process and
the tools specificities (e.g. commands in VR). Partic-
ipants were provided with a step-by-step configura-
tion guide with explanations to configure and test the
light management service with the interaction tech-
nique T1. They only needed the microphone at this
stage. Once they were trained with a tool, they were
asked to configure and test the service with the inter-
action techniques T2 or T3 without detailed instruc-
tions. Both T2 and T3 required a depth camera to
work properly. The overall experiment lasted up to 2
hours, with a mean of 1h16.
To prevent learning bias and bias caused by dif-
ferences in instructions and difficulties, participants
were dispatched into 4 groups presented in Table 1.
These groups were named with the interaction tech-
nique and the configuration method they had to use
at first. For example, the group that started with
the OTF experiment while using the method T2 was
”T2 OTF first”.
Table 1: The 4 groups of participants.
Start with T2 Start with T3
Start with the OTF experiment T2 OTF first T3 OTF first
Start with VR T2 VR first T3 VR first
5.1.3 Participants
To preserve a similar diversity of experience in VR,
gender, and age between groups, the 4 groups were
similarly composed of 6 persons. Each group was
composed of 5 males and 1 female. The mean (m)
and standard deviation(sd) of the age per group were:
• m=37.7, sd=16.8 for ”T2 OTF first”
• m=35.8, sd=15.8 for ”T2 VR first”
• m=42.3, sd=12.3 for ”T3 OTF first”
• m=34.8, sd=15.7 for ”T3 VR first”.
The groups that started in real had the same num-
ber of experts (i.e. participants with hours of experi-
ence in VR) and non-experts in VR (6 persons), while
there were 7 experts for 5 non-experts for the other
two groups. The experimenter and participants were
UI designers, developers and researchers of the same
company. Our institution doesn’t have an ethical com-
mittee but we did our best to follow ethical principles:
the participants were explained the experiment princi-
ples, they had to give their written consents and they
could stop the experiment at anytime. Moreover, the
Virtual Reality Simulation for Multimodal and Ubiquitous System Deployment
131
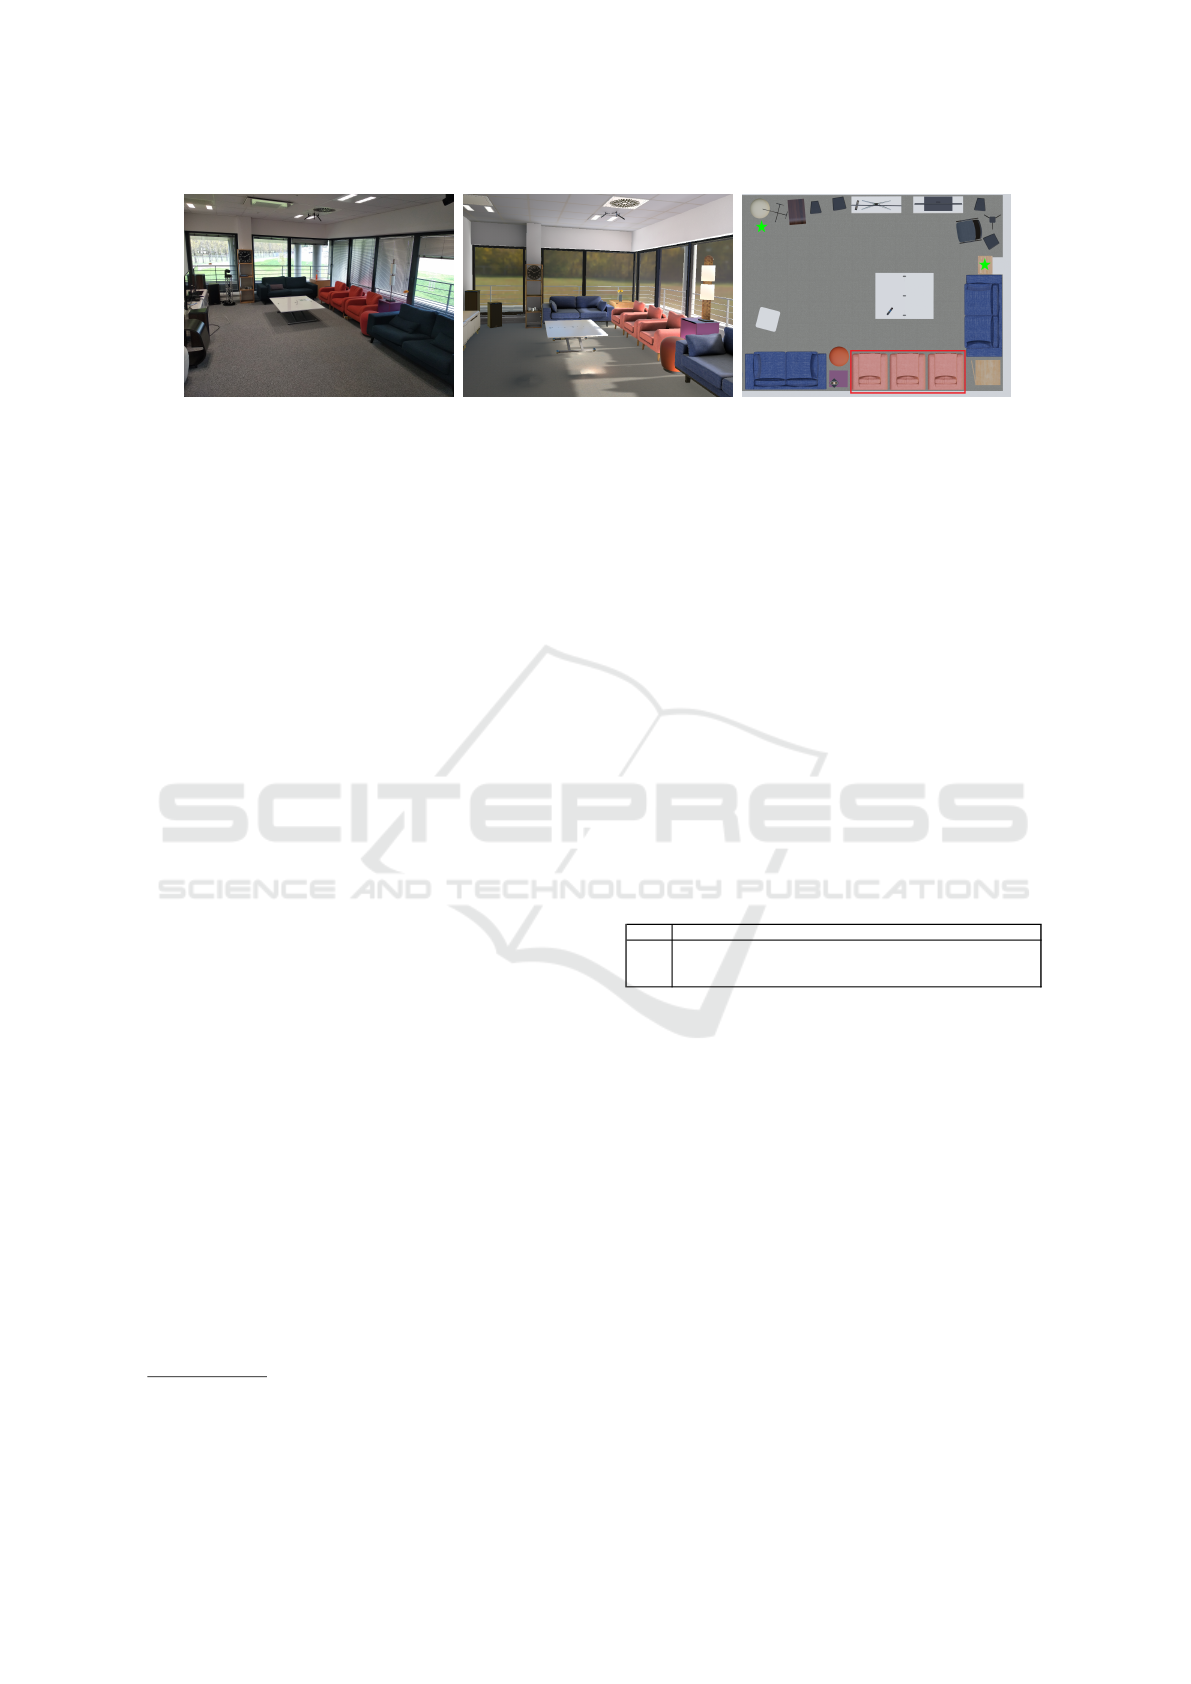
(a) (b) (c)
Figure 5: The two environments used for the experimentation: (a) the real one and (b) the virtual one. The green stars on (c)
the top view of the environment represent the lightbulbs positions, and the red square represents the interaction space.
collected data was stored anonymously and the exper-
iment didn’t engage the participants in any hazardous
situation.
5.1.4 Implementation and Hardware
Our MCEV tool is developed with Unity 2019.4 LTS
1
, and the execution engine is implemented using
ROS2
2
. We used Google vocal recognition API to
recognize the vocal commands. The MCEV tool ran
on an Oculus Quest 2 headset connected to a laptop
(RTX 2080, Intel Core I9-9900K, 32Go RAM) with
the link mode.
The desktop tool was developed with the Python
library PySimpleGUI
3
and was executed on a laptop
(RTX 2070, Intel Core I7-10750H, 16Go RAM) for
the OTF experiment. A Kinect (on a camera tripod)
and a USB microphone were connected to this PC.
The lightbulbs were Philips connected lightbulbs.
5.1.5 Collected Data
The completion times were recorded to compare the
time performance in the OTF experiment and VR.
Moreover, to compare the quality of the configura-
tions created with both tools, we recorded the devices
positioning each time the participants tested their con-
figuration. We implemented a percentage scoring sys-
tem to impose a minimal configuration quality on the
devices positioning and coverage of the interaction
space illustrated by the red square in Figure 5. A con-
figuration was considered acceptable if the score for
each device was high enough (above 75%). In prac-
tice, it was easily obtained as long as both the devices
were not too far from the chairs and the camera had
the chairs in its field of view. Thus, there was no spe-
cific optimal positioning that could be inferred from
the score.
1
https://unity3d.com/
2
https://docs.ros.org/en/eloquent/index.html
3
https://www.pysimplegui.org/en/latest/
At the end of each experiment, participants were
asked to answer the NASA Task Load Index (TLX)
questionnaire (Hart and Staveland, 1988), and could
propose methods to accelerate the whole process. In
addition, participants had to fill out the simulator sick-
ness questionnaire (SSQ) (Kennedy et al., 1993) be-
fore and after the experiment in VR to verify if cyber-
sickness had impacted the results of this experiment.
The objective of these questionnaires was to evaluate
and compare the overall cognitive costs of both meth-
ods with quantitative data. In addition, we wanted
to compare the usability of both methodologies rela-
tively to their device management process. Thus, we
asked participants to rate the 3 7-Likert scale affirma-
tions in table 6.
At the end, participants could comment on the
overall experience, which gave us more insights into
the experimentation results.
Id Affirmations Id Affirmations
Q1 The tool is pleasant to use FQ1 Placing and repositioning connected devices is easier …
Q2 The tool is useful and help to reach the objectives FQ2 Placing and repositioning connected devices is more permissive ...
Q3 The tool is easy to learn to use FQ3 Identify connected devices is easier ...
Q4 The tool is efficient
Figure 6: Affirmations used to compare devices manage-
ment in the OTF experiment and in VR, evaluated between
-3 (”in real”) and 3 (”in virtual reality”).
5.1.6 Hypotheses
Our objective is to prove that our MCEV methodol-
ogy could be a reliable alternative to OTF configura-
tion and testing of MIBS. In particular, we think that
our MCEV tool is more time efficient than a com-
monly used graphical tool such as our desktop tool,
and we expect similar device positioning in both ex-
periments. Moreover, we think that the advantages
of simulation and immersion brought by VR reduce
the arduousness of the configuration and testing pro-
cess. We believe it is especially true when handling
connected devices in multimodal and spatialized in-
teractions. Thus our hypotheses are the followings:
H1) Configuring MIBS with the MCEV tool is
faster than with the desktop tool, without degrading
HUCAPP 2023 - 7th International Conference on Human Computer Interaction Theory and Applications
132
the result.
H2) The MCEV tool has a lesser cognitive work-
load than the desktop tool.
H3) The MCEV tool has a better usability than
the desktop tool to identify, place or move the devices.
5.2 Results
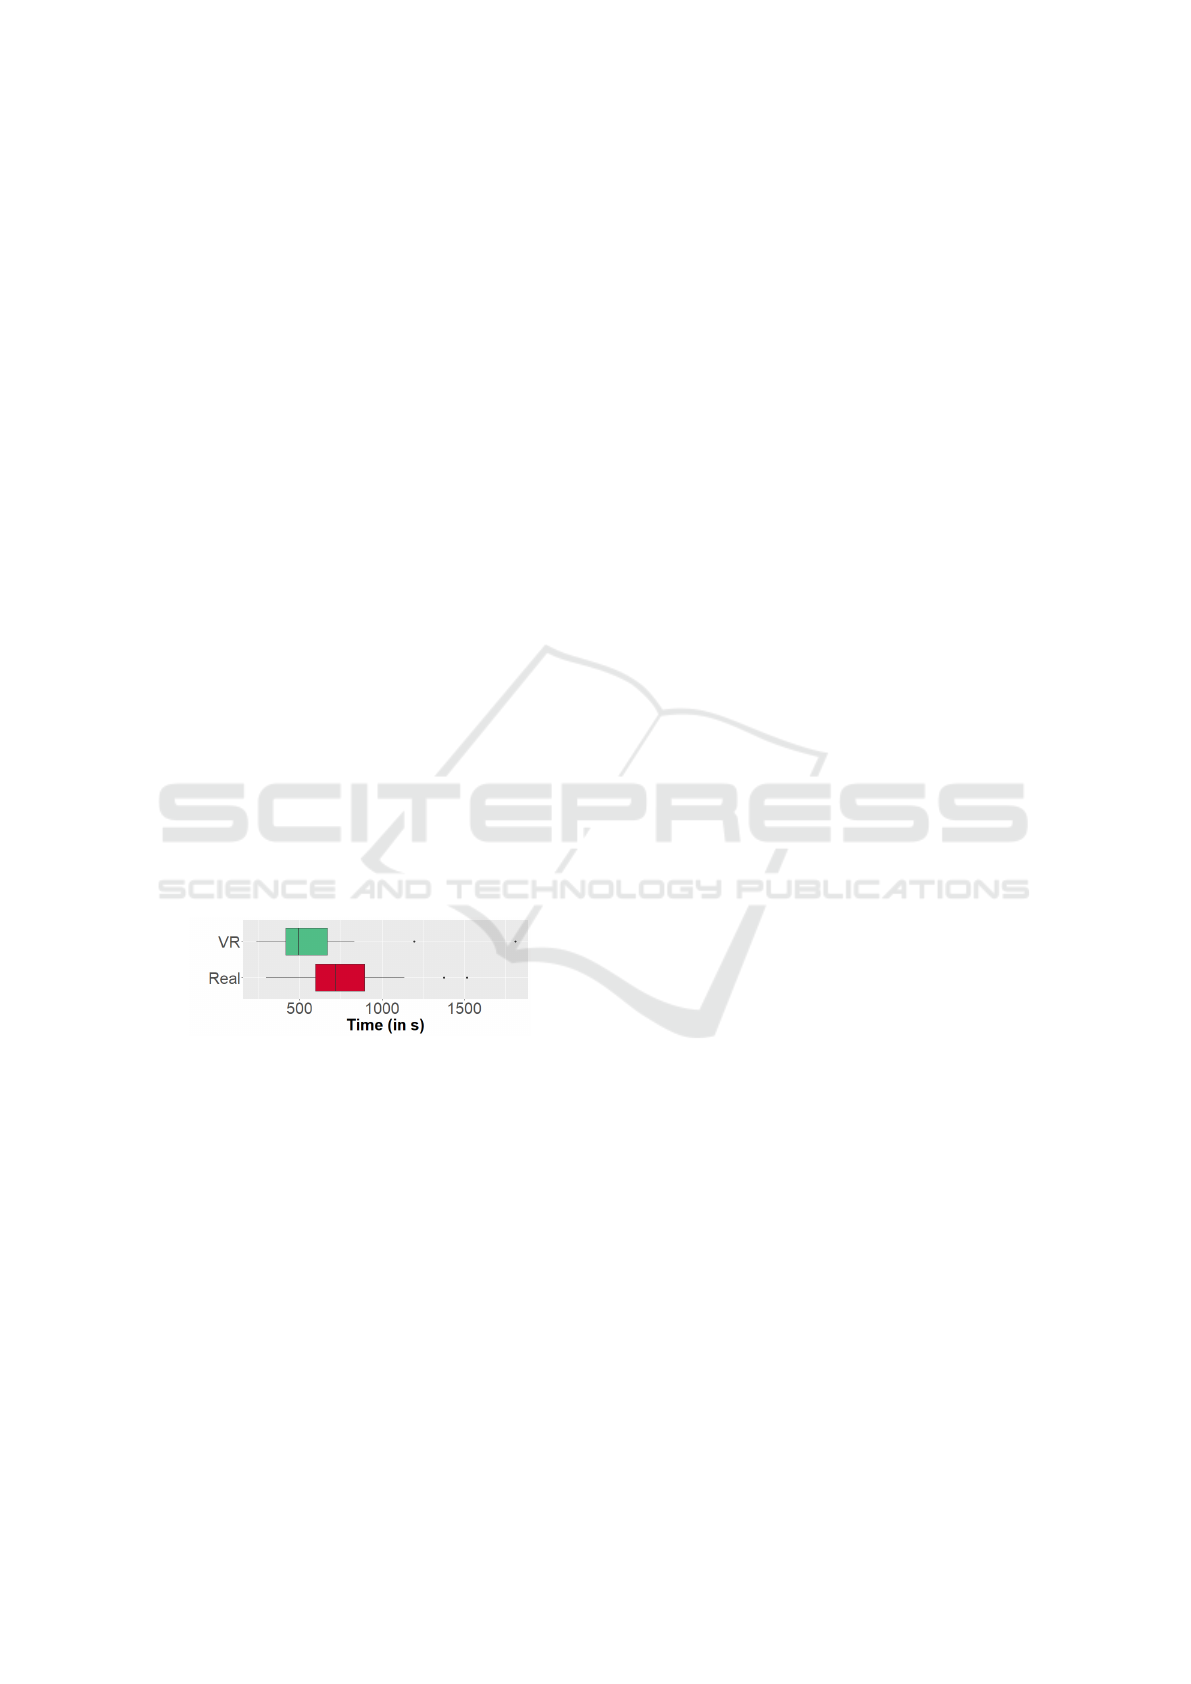
5.2.1 Time Performance
To compare the time necessary to configure and test
the light management service, we asked participants
to perform the tasks in a timely manner. The partici-
pants could stop the experiments as soon as the score
was above 75% for each device. The time taken to
configure and test was recorded. The total time mea-
surements are detailed in Figure 7. As we can see,
participants needed more time to configure the ser-
vice with the desktop tool than with the MCEV tool (a
mean difference of 195s). Each participant performed
in both real and VR, thus the measures are paired. As
the results did not follow a normal distribution, we
assess the significance of the result with a Wilcoxon
test. The result (Z=-2.23, p=0.013) confirmed the ini-
tial hypothesis that it is faster to configure MIBS in
VR with the MCEV tool than OTF with the desktop
tool. In particular, we observed that the difference
is significantly higher during the devices positioning
step (mean difference of 150s, Z=-3.78, p¡0.01) and
the testing step (mean difference of 108s, Z=-2.43,
p=0.02) than in the other configuration steps.
Figure 7: Total time to find an acceptable configuration.
5.2.2 Configuration Quality
The second part of hypothesis H1 is to ensure that the
configurations performed with the MCEV tool are of
the same quality as those performed with the desktop
tool. More precisely, the quality criterion is based on
the possible differences in the devices positions in VR
and reality. For this, the final devices positions pro-
jected on the floor were saved, as shown in Figures
8 and 8. In these Figures, the final positions of each
device are represented by transparent diamond points,
while the mean positions are hexagons. We measured
a mean distance (pair-wise) between the 2D positions
in the OTF experiment and in VR for the microphone
of 0.44m, and 1.10m for the camera. On average, it
does not seem they are differences in the microphone
positioning. For the depth camera, participants settled
on more diverse final positions, especially in reality.
Nevertheless, the depth camera average positions in
the OTF experiment and in VR were roughly at the
same place: in front of the three chairs. Therefore,
there is no noticeable difference in configuration qual-
ity between both experiments.
5.2.3 Workload
To evaluate the workload, we collected the results of
the NASA-TLX questionnaires completed after each
experiment. The results detailed in Figure 9 show that
the workload seems slightly lower in VR than in re-
ality. The results are paired similarly to the time per-
formance measures, thus we performed a Wilcoxon
test to evaluate the significance of this result. As a re-
sult, the global workload difference is not significant
(Z=-1.34, p=0.09). For further analysis, we compared
the results for each NASA-TLX factor, as detailed in
Figure 9. No trend was observed on most parameters
(p¿0.05) except for the performance criteria (Z=-2.51,
p=0.006) which was higher in VR than in real.
5.2.4 SSQ
To assess if cyber-sickness has impacted the experi-
ment in VR, we compared the SSQ results before and
after this experiment. The measurements didn’t fol-
low a normal distribution, thus we used a Wilcoxon
matched pair signed rank test to evaluate the signif-
icance of the questionnaire results. Even if the SSQ
score significantly (Z=-3.45, p=2.8 ∗ 10
−4
) increased
during the VR experiment (i.e. from a mean of 4.99
to 18.23), it remained low.
5.2.5 Usability
For the usability assessment of the MCEV tool com-
pared to the desktop tool, we analyzed the results of
the statements on the 7-Likert scale, detailed in Fig-
ure 10. For the 3 ratings, the result is in favor of
the VR experiment. The rating distribution isn’t nor-
mal, thus we validated the significance of this result
with a Wilcoxon signed rank test under the null hy-
pothesis that the ranks are lower or equal to 0. As
the ratings are significantly higher than 0 (FQ1: Z=-
3.43, p=3.0∗ 10
−4
, FQ2: Z=-3.62, p=1.5∗ 10
−4
; FQ3:
Z=-3.31, p=4.6 ∗ 10
−4
), it confirms that the MCEV
tool was considered more usable than the desktop tool
when handling connected devices (H3).
Virtual Reality Simulation for Multimodal and Ubiquitous System Deployment
133
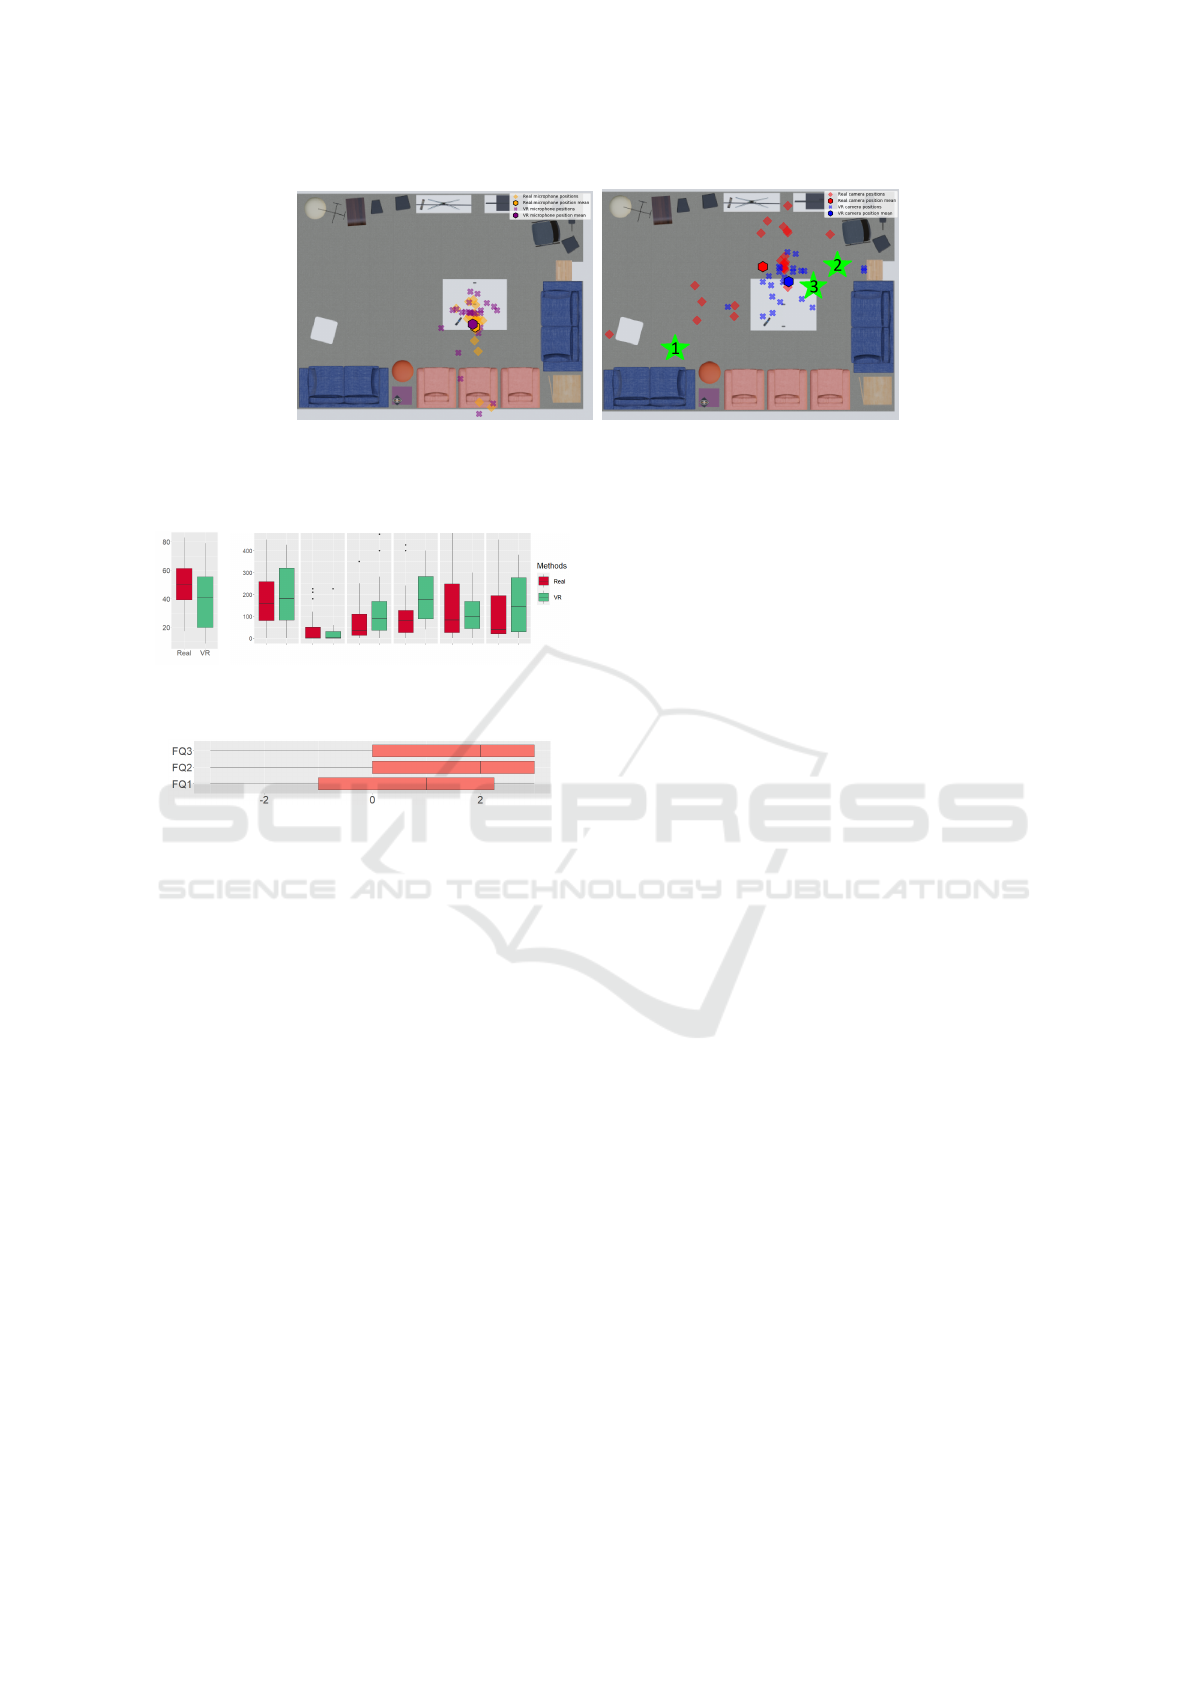
(a) (b)
Figure 8: (a) The microphone and (b) the depth camera final positions for all configurations, and the mean positions. The
green numbered stars in figure (b) are respectively the initial positions of the camera, microphone and laptop in the OTF
experiment.
(a) (b)
Figure 9: (a) Global and (b) detailed workload ratings.
Figure 10: Rating for the table 6 statements, between -3 and
3.
5.3 Participants Feedback
First, most participants reported difficulties placing
the camera in the OTF experiment, and lost time do-
ing that. We observed that most participants had to
go back and forth several times between the camera
to place it, and the laptop hosting the desktop tool for
the visual feedback. Even further, they didn’t move
the laptop to reduce the problem, even though they
were expressly allowed to do that in the instructions.
There were even participants who didn’t use the vi-
sual feedback of the camera at first, as they reported
they were confident in their camera placements. In
comparison, we observed that most participants didn’t
have issues placing the camera in the MCEV tool, and
were relatively fast at finding a seemingly acceptable
position. Second, some participants reported their
concerns about the realism of the device positioning
in VR. For example, it was possible to place the de-
vices (e.g. microphone) under or ”in” the furniture
in VR. Some participants tried such placements dur-
ing the experience, but they settled for more realistic
locations in the end.
5.4 Discussion
5.4.1 MCEV Tool Performance
Our hypothesis H1 is validated. Indeed, participants
were faster with our MCEV tool (mostly during the
devices positioning and testing steps), and the devices
were roughly positioned in the same areas. Our ob-
servations indicate that having a device feedback dis-
played closely to its device is time-saving during the
devices positioning step in VR (as in Figures 1 and 3)
compared to OTF where the participants had to reg-
ularly move the laptop (or walk back and forth) to
check the sensors feedback while manipulated them.
Similarly, the fact that device locations are directly
accessible in VR could help to avoid errors and ap-
proximations, thus it could also have a positive impact
on the time performance. The performance differ-
ence in more complex use cases (larger environments,
more devices, more elaborate services), such as a ser-
vice to guide newcomers in an ubiquitous computing
office needs further exploring. We believe the time
performance would be even better in VR for these de-
manding scenarios, as it would require more iterations
of devices positioning and testing.
However, some participants tried unrealistic posi-
tions in VR, and had concerns about the process of
replicating the configurations made in VR to the real
environment. Indeed, the realism of the devices po-
sitioning was not measured or constrained, and our
experiment relied on the participants to define what
was acceptable and what was not. Moreover, the qual-
ity of the configurations was only calculated from the
devices locations on 2D dimensions. We set this lim-
itation to compare the devices positioning in real and
VR with similar information. However, environmen-
tal factors such as 3D obstacles or the soundscape
could impact the configurations quality. Thus, the
realism of the VR environments and the quality of
support provided by the MCEV tool could impact the
HUCAPP 2023 - 7th International Conference on Human Computer Interaction Theory and Applications
134

time needed to install MIBS, and it could lead to more
in-depth experiments. Nevertheless, the MCEV tool
could be improved with a method to automatically
generate warnings and recommendations of devices
positioning from the devices and environment infor-
mation.
5.4.2 MCEV Tool Cognitive Load
Contrary to our hypothesis H2, our results suggest
that the desktop and MCEV tools have no verified dif-
ferences in cognitive load, except for the performance
criteria. This absence of difference in usability could
be explained by the sobriety of our experiment. In-
deed, we considered a diversity of participant profiles,
we limited our experiment to one simple scenario in
one room, and we didn’t experiment on the collabora-
tive features. As stated before, we agree with some of
the participants’ feedback that suggest the advantage
of VR could become more significant with situations
on a larger scale and complexity. The performance
difference in the NASA-TLX could be explained by
the difficulties most users had to understand that the
virtual and the real camera shared the same aura.
5.4.3 MCEV Device Management Usability
Our hypothesis H3 is validated, which means that
identifying and moving devices is considered easier
with the MCEV tool. The difficulties to handle de-
vices with non-trivial aura such as the depth cam-
era in our experiment seems to be the main reason
to the usability (and time) differences between both
experiments. This suggests that the MCEV method-
ology is beneficial for MIBS that heavily rely on uni-
directional sensors. The relevance of device position-
ing in VR could be further evaluated in more com-
plex scenarios. Indeed, the simulated and real devices
were roughly placed at the same position in average.
However, our scenario was limited to a relatively sim-
ple environment without disturbances or considerable
difficulties.
6 CONCLUSION AND FUTURE
WORK
In this article, we have proposed a methodology and
software tool based on VR to facilitate the configu-
ration and evaluation of MIBS. Thanks to 3D interac-
tions, it aims to facilitate the selection and positioning
of devices and their association with newly config-
ured multimodal interaction techniques and services.
The created MIBS can then be evaluated in immer-
sion without needing the real environment. Finally,
the evaluated configurations can be shared with our
proposed collaborative features to improve the MIBS
or facilitate the installation in the real environment.
We conducted a user experiment to compare the effi-
ciency and usability of our tool to the ones of a desk-
top tool we developed to adapt our methodology pro-
cess to OTF experiments. The results show that the
configuration and installation process is more efficient
with our VR tool, and that it has at least the same us-
ability as the desktop tool. Thus, we believe that our
proposed methodology and tool based on VR propose
a valid alternative to OTF experiments and could pro-
mote the democratization of MIBS.
In future work, the proposed collaborative method
needs to be evaluated by MIBS producers and admin-
istrators to validate the supposed advantages during
the integration and installation process. Thus, we plan
to evaluate the usability and completeness of our tool
collaborative features with ergonomists. We also plan
to create complex configurations with ergonomists
and ask MIBS administrators to install and evaluate
them in the real environment.
We are also working on new device manage-
ment features such as automatic recommendation
areas for devices and warnings to prevent errors.
We are also implementing an interactive World-in-
Miniature (Stoakley et al., 1995) to have a more com-
plete view of the environment, and easily move in
large environments. Finally, we are working on an
AR solution to configure and evaluate MIBS in real
environments when they are available. The objective
is to facilitate the transition from the virtual to the real
environment by configuring and testing with real de-
vices alongside the virtual ones.
REFERENCES
Almeida, N., Teixeira, A., Silva, S., and Ketsmur, M.
(2019). The AM4I Architecture and Framework for
Multimodal Interaction and Its Application to Smart
Environments. Sensors (Basel, Switzerland), 19(11).
Beckmann, C., Consolvo, S., and LaMarca, A. (2004).
Some Assembly Required: Supporting End-User Sen-
sor Installation in Domestic Ubiquitous Computing
Environments. In Davies, N., Mynatt, E. D., and Siio,
I., editors, UbiComp 2004: Ubiquitous Computing,
Lecture Notes in Computer Science, pages 107–124,
Berlin, Heidelberg. Springer.
Benford, S. and Fahl
´
en, L. (1993). A Spatial Model of Inter-
action in Large Virtual Environments. In de Michelis,
G., Simone, C., and Schmidt, K., editors, ECSCW ’93,
pages 109–124. Springer Netherlands, Dordrecht.
Biehl, J. T. and Bailey, B. P. (2006). Improving interfaces
for managing applications in multiple-device environ-
Virtual Reality Simulation for Multimodal and Ubiquitous System Deployment
135

ments. In AVI ’06, pages 35–42, Venezia, Italy. Asso-
ciation for Computing Machinery.
Brudy, F., Holz, C., R
¨
adle, R., Wu, C.-J., Houben, S., Klok-
mose, C. N., and Marquardt, N. (2019). Cross-Device
Taxonomy: Survey, Opportunities and Challenges of
Interactions Spanning Across Multiple Devices. In
CHI ’19, pages 1–28, Glasgow, Scotland Uk. Asso-
ciation for Computing Machinery.
Chaoui, K., Bouzidi-Hassini, S., and Bellik, Y. (2022). Spa-
tial User Interaction: What Next? pages 163–170.
Dragicevic, P. and Fekete, J.-D. (2001). Input Device Se-
lection and Interaction Configuration with ICON. In
Blandford, A., Vanderdonckt, J., and Gray, P., editors,
People and Computers XV—Interaction without Fron-
tiers, pages 543–558. Springer London, London.
Ghiani, G., Manca, M., and Patern
`
o, F. (2015). Authoring
context-dependent cross-device user interfaces based
on trigger/action rules. In MUM ’15, pages 313–322,
Linz, Austria. Association for Computing Machinery.
Grieves, M. and Vickers, J. (2017). Digital Twin: Mitigat-
ing Unpredictable, Undesirable Emergent Behavior in
Complex Systems. pages 85–113.
Hart, S. G. and Staveland, L. E. (1988). Development of
NASA-TLX (Task Load Index): Results of Empiri-
cal and Theoretical Research. In Hancock, P. A. and
Meshkati, N., editors, Advances in Psychology, vol-
ume 52 of Human Mental Workload, pages 139–183.
North-Holland.
Kennedy, R. S., Lane, N. E., Berbaum, K. S., and Lilien-
thal, M. G. (1993). Simulator Sickness Questionnaire:
An Enhanced Method for Quantifying Simulator Sick-
ness. The International Journal of Aviation Psychol-
ogy, 3(3):203–220.
Lacoche, J., Le Chenechal, M., Villain, E., and Foulonneau,
A. (2019). Model and Tools for Integrating IoT into
Mixed Reality Environments: Towards a Virtual-Real
Seamless Continuum. In ICAT-EGVE 2019, Tokyo,
Japan.
Lacoche, J. and Villain, E. (2022). Prototyping Context-
aware Augmented Reality Applications for Smart En-
vironments inside Virtual Reality. In GRAPP 2022,
Online, Portugal.
Lawson, J.-Y., Coterot, M., Carincotte, C., and Macq, B.
(2010). Component-Based High Fidelity Interactive
Prototyping of Post-WIMP Interactions. page 47.
Lechler, T., Russwurm, E., Metzner, M., Mayr, A., and
Franke, J. (2019). Virtual Commissioning – Scientific
review and exploratory use cases in advanced produc-
tion systems. Procedia CIRP, 81:1125–1130.
Loor, P. D., Bodic, L. L., Calvet, G., and Tisseau, J. (2006).
Un simulateur d’usage pour l’
´
evaluation des syst
`
emes
interactifs multimodaux. 7:33.
Manca, M. and Patern
`
o, F. (2016). Customizable dynamic
user interface distribution. In EICS ’16, pages 27–37,
Brussels, Belgium. Association for Computing Ma-
chinery.
Marquardt, N., Diaz-Marino, R., Boring, S., and Greenberg,
S. (2011). The proximity toolkit: prototyping prox-
emic interactions in ubiquitous computing ecologies.
In UIST ’11, pages 315–326, Santa Barbara, Califor-
nia, USA. Association for Computing Machinery.
Metzner, M., Krieg, L., Kr
¨
uger, D., K
¨
odel, T., and Franke,
J. (2020). Intuitive, VR- and Gesture-based Physi-
cal Interaction with Virtual Commissioning Simula-
tion Models. pages 11–20.
Miclaus, A., Riedel, T., and Beigl, M. (2014). End-user in-
stallation of heterogeneous home automation systems
using pen and paper interfaces and dynamically gen-
erated documentation. In 2014 International Confer-
ence on the Internet of Things (IOT), pages 19–24.
Peters, S., Johanssen, J. O., and Bruegge, B. (2016). An
IDE for multimodal controls in smart buildings. In
ICMI ’16, pages 61–65, Tokyo, Japan. Association for
Computing Machinery.
Pfeiffer, T. and Pfeiffer-Leßmann, N. (2018). Virtual Pro-
totyping of Mixed Reality Interfaces with Internet of
Things (IoT) Connectivity. i-com, 17(2):179–186.
Pittarello, F. and Celentano, A. (2007). Deployment of Mul-
timodal Services: an Ontology Driven Architecture.
In IEEE International Conference on Pervasive Ser-
vices, pages 267–274.
Poirier, F., Foulonneau, A., Lacoche, J., and Duval, T.
(2022). Interactive Multimodal System Characteriza-
tion in the Internet of Things Context. In HUCAPP
2022, Conf
´
erence Virtuelle en ligne, France.
Pruvost, G. (2013). Mod
´
elisation et conception d’une plate-
forme pour l’interaction multimodale distribu
´
ee en in-
telligence ambiante. phdthesis, Universit
´
e Paris Sud -
Paris XI.
Soedji, B. E. B., Lacoche, J., and Villain, E. (2020). Cre-
ating AR Applications for the IOT : a New Pipeline.
In VRST ’20: 26th ACM Symposium on Virtual Real-
ity Software and Technology, pages 1–2, Virtual Event
Canada, France. ACM.
Stoakley, R., Conway, M. J., and Pausch, R. (1995). Vir-
tual reality on a WIM: interactive worlds in miniature.
In CHI ’95, pages 265–272, Denver, Colorado, USA.
ACM Press/Addison-Wesley Publishing Co.
Suzuki, R., Masai, K., and Sugimoto, M. (2019). Real-
lifeEngine: A Mixed Reality-Based Visual Program-
ming System for SmartHomes. The Eurographics As-
sociation.
Tavakolizadeh, F., Chala, S. A., and Zhang, H. (2019). An
Interactive Interface for Bulk Software Deployment in
IoT. In IoT 2019, pages 1–4, Bilbao, Spain. Associa-
tion for Computing Machinery.
Weiser, M. (1991). The Computer for the 21 st Century.
Scientific American, 265(3):94–105.
HUCAPP 2023 - 7th International Conference on Human Computer Interaction Theory and Applications
136
