
Generative Adversarial Network Synthesis for Improved Deep Learning
Model Training of Alpine Plants with Fuzzy Structures
Christoph Praschl
1 a
, Roland Kaiser
3 b
and Gerald Adam Zwettler
1,2 c
1
Research Group Advanced Information Systems and Technology, Research and Development Department,
University of Applied Sciences Upper Austria, Softwarepark 11, Hagenberg, 4232, Austria
2
Department of Software Engineering, School of Informatics, Communications and Media,
University of Applied Sciences Upper Austria, Softwarepark 11, Hagenberg, 4232, Austria
3
ENNACON Environment Nature Consulting KG, Altheim 13, Feldkirchen bei Mattighofen, Austria
Keywords:
Plant Cover Image Data Synthesis, Generative Adversial Networks, Deep Learning Instance Segmentation,
Small Training Data Sets.
Abstract:
Deep learning approaches are highly influenced by two factors, namely the complexity of the task and the size
of the training data set. In terms of both, the extraction of features of low-stature alpine plants represents a
challenging domain due to their fuzzy appearance, a great structural variety in plant organs and the high effort
associated with acquiring high-quality training data for such plants. For this reason, this study proposes an
approach for training deep learning models in the context of alpine vegetation based on a combination of real-
world and artificial data synthesised using Generative Adversarial Networks. The evaluation of this approach
indicates that synthetic data can be used to increase the size of training data sets. With this at hand, the results
and robustness of deep learning models are demonstrated with a U-Net segmentation model. The evaluation is
carried out using a cross-validation for three alpine plants, namely Soldanella pusilla, Gnaphalium supinum,
and Euphrasia minima. Improved segmentation accuracy was achieved for the latter two species. Dice Scores
of 24.16% vs 26.18% were quantified for Gnaphalium with 100 real-world training images. In the case of
Euphrasia, Dice Scores improved from 33.56% to 42.96% using only 20 real-world training images.
1 INTRODUCTION
Over the last decades, the effects of global warm-
ing have increased dramatically, resulting in a signifi-
cantly higher global mean surface temperature than in
the pre-industrial period. This process comes with an
increased frequency, intensity and duration of climate
events. Altogether, the climate crisis leads to a shift
of regional climate zones and threatens the fauna and
flora on our planet (Shukla et al., 2019). Next to var-
ious other regions, this influence has been observed
in detail for the European Alps based on, e.g. the re-
treat of the glaciers (Sommer et al., 2020; Steinbauer
et al., 2022) or the upward shift of the potential tim-
ber line’s mean altitude (Rubel et al., 2017; K
¨
orner,
2012). These factors are already causing a pending
local decline and retreat of alpine animals (Brunetti
et al., 2019; Gobbi et al., 2021) and plant species
a
https://orcid.org/0000-0002-9711-4818
b
https://orcid.org/0000-0002-2487-9289
c
https://orcid.org/0000-0002-4966-6853
(Rumpf et al., 2019; Engler et al., 2011; Dirnb
¨
ock
et al., 2003).
In light of the processes mentioned above, it is es-
sential to conduct objective and quantitative monitor-
ing of the alpine biota over a long period of time in or-
der to accurately track the advance of climate change
and its impact on alpine plant diversity (K
¨
orner et al.,
2022; K
¨
orner and Hiltbrunner, 2021). Automating
a process such as visual-based long-term monitoring
is now possible, thanks to recent improvements in
computer vision. In particular, paradigms from deep
learning are critical factors in developing such a sys-
tem. However, these methods have the disadvantage
of requiring large amounts of labelled training data
to build suitable predictive models (Sun et al., 2017).
Since the availability of appropriate training data for
the study system is still limited and manual labelling
of this input information requires much effort, the
data is a sticking point for the practicality of such a
system.
The collection of images in alpine environments is
resource-intensive due to the need to transport image
Praschl, C., Kaiser, R. and Zwettler, G.
Generative Adversarial Network Synthesis for Improved Deep Learning Model Training of Alpine Plants with Fuzzy Structures.
DOI: 10.5220/0011607100003417
In Proceedings of the 18th International Joint Conference on Computer Vision, Imaging and Computer Graphics Theory and Applications (VISIGRAPP 2023) - Volume 4: VISAPP, pages
151-158
ISBN: 978-989-758-634-7; ISSN: 2184-4321
Copyright
c
2023 by SCITEPRESS – Science and Technology Publications, Lda. Under CC license (CC BY-NC-ND 4.0)
151

acquisition equipment to remote locations. In order
to conserve time resources, it is impossible to capture
images of alpine plants in huge numbers. Further-
more, to allow objective and unbiased long-term stud-
ies, changing light conditions and external weather
influences must be avoided during image accession
(Eberl and Kaiser, 2020). Artificial data can help to
increase the amount of data available to deep learning
models. We, therefore, reviewed the use of generative
adversarial networks (GAN) (Creswell et al., 2018)
for improving U-Net models (Ronneberger et al.,
2015) for segmenting fuzzy structures, such as alpine
plants, in the context of quantitative monitoring of
alpine vegetation over a long period.
2 RELATED WORK
Antoniou et al. proposed to employ generative ad-
versarial networks for the creation of artificial data
in addition to classic augmentation strategies such
as image transformations or colour adaptions. Like
this, they were able to use the so-created data to ex-
tend real-world data sets for training additional mod-
els; they apply their approach in the context of clas-
sification problems (Antoniou et al., 2017). Next to
that, Sandfort et al. transferred the idea of utiliz-
ing generative adversarial networks to create artifi-
cial labelled data to the medical domain. They used
this methodology for creating a data set consisting
of real-world and augmented data, allowing for im-
provement in the accuracy of a U-Net segmentation
model in the context of computer tomography (CT)
scans (Sandfort et al., 2019). Also, Dong et al. go
a similar way by creating a combined model archi-
tecture called U-Net-GAN, which uses a set of U-Net
models as generators of the underlying GAN network
in combination with multiple fully convolutional net-
works as discriminators. This U-Net-GAN architec-
ture is used for the automatic multi-organ segmenta-
tion in thorax images in different medical areas such
as CT scans, pathology or X-ray images (Dong et al.,
2019). A method for training deep learning models
in medical domains with small reference data sets is
also presented by Zwettler et al. Like in the present
work, a U-Net model is iteratively trained for the seg-
mentation of the targeted domain using artificial im-
ages created using a GAN network (Zwettler et al.,
2020). Similar to the previously mentioned publi-
cations, also Schonfeld et al., Guo et al. and Chen
et al. combine U-Net segmentation approaches with
the generation of training data using GAN networks
to increase the number of training images (Schonfeld
et al., 2020; Guo et al., 2020; Chen et al., 2021). The
mentioned publications mainly focus on the combi-
nation of U-Net models together with GAN architec-
tures in the context of medical applications. They are,
for this reason, substantially distinct from the present
work. CT and magnetic resonance images differ sig-
nificantly from RGB images in appearance. On top of
that, the structural impression of human organs con-
trasts with that of plants and is therefore barely com-
parable. With higher variability in appearance, thin-
ner structures and partly overlapping plant canopies,
the vegetation images represent a more challenging
domain for precise instance segmentation compared
to high-contrast 3D tomography in medicine.
3 MATERIAL
Within an interdisciplinary monitoring and research
program for long-term observation of alpine ecosys-
tems in the Hohe Tauern National Park (Austria), a
digital true colour image archive in the form of strictly
standardised (geo-static, colourfast), high-resolution
nadir photos (view vertical to the ground) is being
built up. This image data archive provides 215 exam-
ple RGB images with a size of 600 ×600 px (10 × 10
cm in real-world) that are cut-outs of the raw image
data (original size: 3000 × 3000 px equalling 50 × 50
cm) showing one or multiple alpine plants in an ex-
actly defined area. In order to achieve a consistent
and comparable light source, two diffused flashes are
used, as well as a shading curtain. Colour charts and
grey cards are added to the photographs for calibra-
tion. The images are captured with a full-frame cam-
era and a 50 mm lens (Eberl and Kaiser, 2020).
The images of the data set are manually la-
belled using image classification masks regarding
the following plant species: Euphrasia minima,
Gnaphalium supinum, Leucanthemopsis alpina, Po-
tentilla aurea, Primula glutinosa, Primula minima,
Salix herbacea, Scorzoneroides helvetica, Soldanella
pusilla and Vaccinium gaultheroides. Images show
partially overlapping occurrences of these species.
Figure 1a shows an example image of the training
data set, and Figure 1b presents the associated clas-
sification mask. The distribution of the different plant
species is shown in Table 1.
4 METHODOLOGY
In this work, multiple deep learning models are
trained using a U-Net and a progressive growing GAN
(PGGAN) model architecture, as proposed by Karras
et al. (Karras et al., 2018). By generating an addi-
VISAPP 2023 - 18th International Conference on Computer Vision Theory and Applications
152
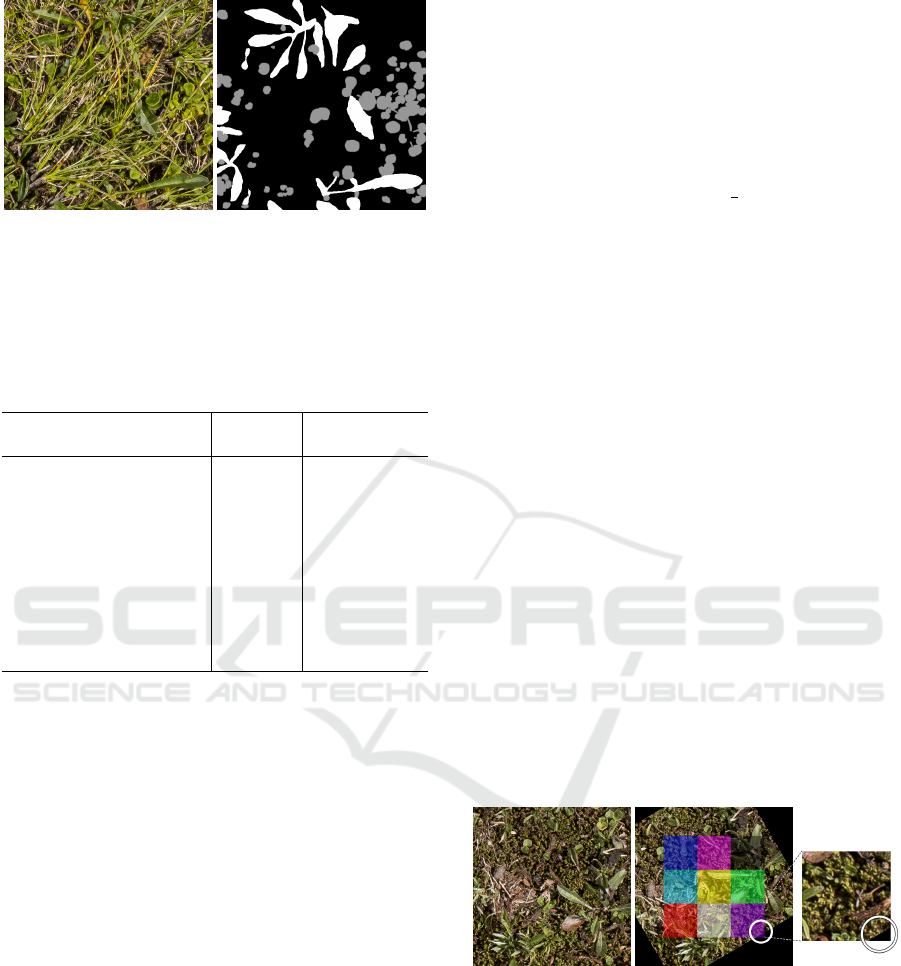
(a) (b)
Figure 1: (a) Sample image of the training data set with
(b) the associated image mask showing multiple annotated
plants species, namely Scorzoneroides helvetica in white
and Soldanella pusilla in grey.
Table 1: Distribution of the alpine plant species in the train-
ing data set of 215 images with 77,400,000 pixels in total.
Unclassified pixels are interpreted as background pixels.
Plant species # Images
Relative pixel
proportion
Euphrasia minima 23 0.236%
Gnaphalium supinum 103 1.152%
Leucanthemopsis alpina 24 0.416%
Potentilla aurea 6 0.475%
Primula glutinosa 4 0.061%
Primula minima 7 0.276%
Salix herbacea 103 1.954%
Scorzoneroides helvetica 73 6.127%
Soldanella pusilla 162 1.505%
Vaccinium gaultheroides 4 0.616%
tional artificial training set for the U-Net network, the
GAN network can increase the diversity of the train-
ing set and, thus, improve the segmentation model.
4.1 Data Augmentation
In order to counteract overfitting of the proposed
models, a data augmentation strategy is applied to in-
crease the size of the training data set. This enhance-
ment is achieved by applying geometric and intensity
transformations to the input images with uniformly
distributed random parameters to create variations of
the input images and their associated ground truth im-
age masks as follows.
• Affine Transformation: Randomly applies affine
transformations in the form of rotations and trans-
lations to the input image and mask. The images
are rotated up to ±90°and translated between 0
and ±20% of the image’s width along the x-axis
and with a height ratio of 0 to ±20% along the
y-axis. For the value interpolation, the Lanczos
algorithm (Fadnavis, 2014) is used for the RGB
input images and the nearest neighbour interpo-
lation (Rukundo and Cao, 2012) is used for the
ground truth masks to avoid noise in the masks’
border areas.
• Gamma Correction: Applies a gamma correc-
tion by manipulating the value channel of the in-
put image in HSV space. The manipulation is
done using a factor f between 0.7 and 1.3. This
factor results in darker colours with a value below
1 and in brighter colours above 1. It is applied on
the value channel like v
′
= v
1
f
.
• Convolution: Either sharpens or blurs the im-
age by applying different convolution filters like
Gaussian Blur with a randomly selected kernel
size k ∈ [3;7] or a sharpening filter with weight w
between 1 and 1.2 that is applied like I
s
(x, y) = w ∗
k ∗ I
i
(x, y) using the kernel k =
0 −1 0
−1 5 −1
0 −1 0
.
• Noise: Adds a normally distributed noise to the
image based on a randomly selected standard de-
viation between 0 and 20 with I
n
(x, y) = I
i
(x, y) +
N (x, y), N ∼ (µ, σ
2
).
Finally, the images and their masks are normalized
to a valid space of the unsigned char datatype and are
cropped to 3 ×3 tiles with a size of 128×128 px each,
cf. Figure 2b. Only tiles from the centre of the aug-
mentation results are used to avoid black areas from
affine transformations such as rotation or translation.
To ensure that weak areas (containing background re-
gions as a result of the transformations) are not used
for the training, the tiles are also checked according
to the background (black) to foreground ratio. The
resulting data set is filtered to remove images with a
background ratio greater than 0.01%.
(a) (b)
Figure 2: (a) Sample image of the training data set with (b)
one associated augmentation result using an affine transfor-
mation and noise. Due to the transformation, the bottom
right tile contains 3.24% of the background area (marked
with a circle) and, for this reason, is not used for the model
training. In addition, the finally cropped central tiles are
highlighted in colour.
Generative Adversarial Network Synthesis for Improved Deep Learning Model Training of Alpine Plants with Fuzzy Structures
153
4.2 U-Net Based Multi-Class Image
Segmentation
In order to segment alpine plants, multiple U-Net
models are trained. Due to the heterogeneous nature
of the addressed plants, especially their small stature,
the proposed models are intended for segmenting ex-
actly one target plant species like Euphrasia minima.
This also comes hand in hand with the significant im-
balance of the created training data set.
The U-Net architecture consists of five encoders
and five decoder steps and thereby expects an un-
signed char image with a size of 128 × 128 px and
three channels. Within the contraction path, the im-
ages are resized to 64 × 64 px in the first step and
down to 4 × 4 px in the last step – respectively vice
versa in the expansion path.
Within the training phase, an Adam Optimizer
(Kingma and Ba, 2014) at a learning rate of 0.0001
using a sparse categorical cross entropy loss function
and a batchSize = 64 are used for up to 100 epochs.
The results of the U-Net model are post-processed
by filtering small contours with an area smaller than
0.05% of the image size and using the Grab Cut al-
gorithm (Rother et al., 2004) in an automized way.
Based on the initial segmentation mask provided by
the U-Net model, a gaussian mixture model is cre-
ated using the already segmented foreground pixels
as “sure” foreground for the post-processing step.
In addition, this segmented mask is extended in a
second iteration by morphological transformations to
define a “possible” foreground and background. Both
dilation steps are applied using a 5 × 5 kernel. The
U-Net post-processing step is shown in Figure 3.
4.3 Progressive Growing Generative
Adversarial Network
In this paper, a progressively growing generative ad-
versarial network (PGGAN) is proposed for the ex-
pansion of the U-Net training data set. For this pur-
pose, a GAN network is trained with six levels of res-
olution, starting with 4×4 px and ending with images
of 128 × 128 px. The underlying generator neural
network creates images based on a random input us-
ing multiple convolutional layers. With the contesting
discriminator network, the GAN can iteratively im-
prove its results by determining if the created images
are fakes or reals. This architecture is shown based
on sample images of multiple stages in Figure 4. The
augmented training data set for the network training is
resampled to six resolution levels using the Lanczos
interpolation algorithm for the RGB data. This step
is followed by the nearest neighbour interpolation of
(a) (b)
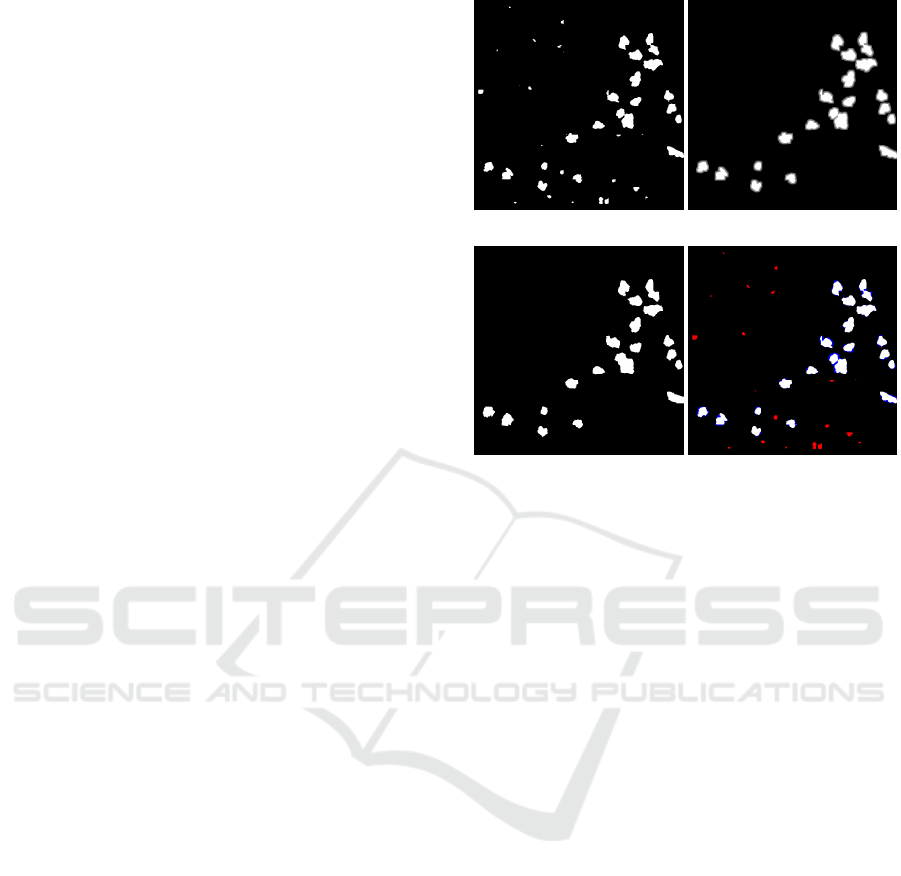
(c) (d)
Figure 3: (a) Resulting mask created by the U-Net segmen-
tation, (b) the filtered and dilated version used for the cre-
ation of the gaussian mixture model, (c) the application of
the Grab Cut algorithm and (d) the comparison of the initial
U-Net result and the corresponding post-processed version
showing filtered areas in red and extended areas in blue.
the binary masks. The values of the binary masks are
equally distributed between the image range of 0 to
255. Within the training, an Adam optimizer with
a learning rate of 0.001 is used on four-channel im-
ages containing the RGB information and the binary
ground truth class mask.
Due to the multi-class nature with partially over-
lapping plant individuals, the generated result masks
of the GAN network are noisy and do not contain
unified class regions. Consequently, post-processing
is required. To this end, a region-based approach is
adopted to extract individual classes from the image
by finding the closest class for every pixel. The so-
created regions get manipulated using morphological
operations with a kernel k = 3 × 3 in the form of an
erode step followed by a dilation, allowing the re-
moval of outliers. The cleaned regions are then fil-
tered based on the size ratio compared to the total im-
age size. Like this, objects containing less than 5%
of the image’s pixels get discarded. Finally, a con-
tour extraction is applied. During this last step, the
average pixel value gets evaluated within every con-
nected contour, the value of which is, in turn, used to
determine the final region’s class. Based on this post-
processing approach, the class noise is cleared out,
as shown in Figure 5. Due to the overlapping char-
VISAPP 2023 - 18th International Conference on Computer Vision Theory and Applications
154
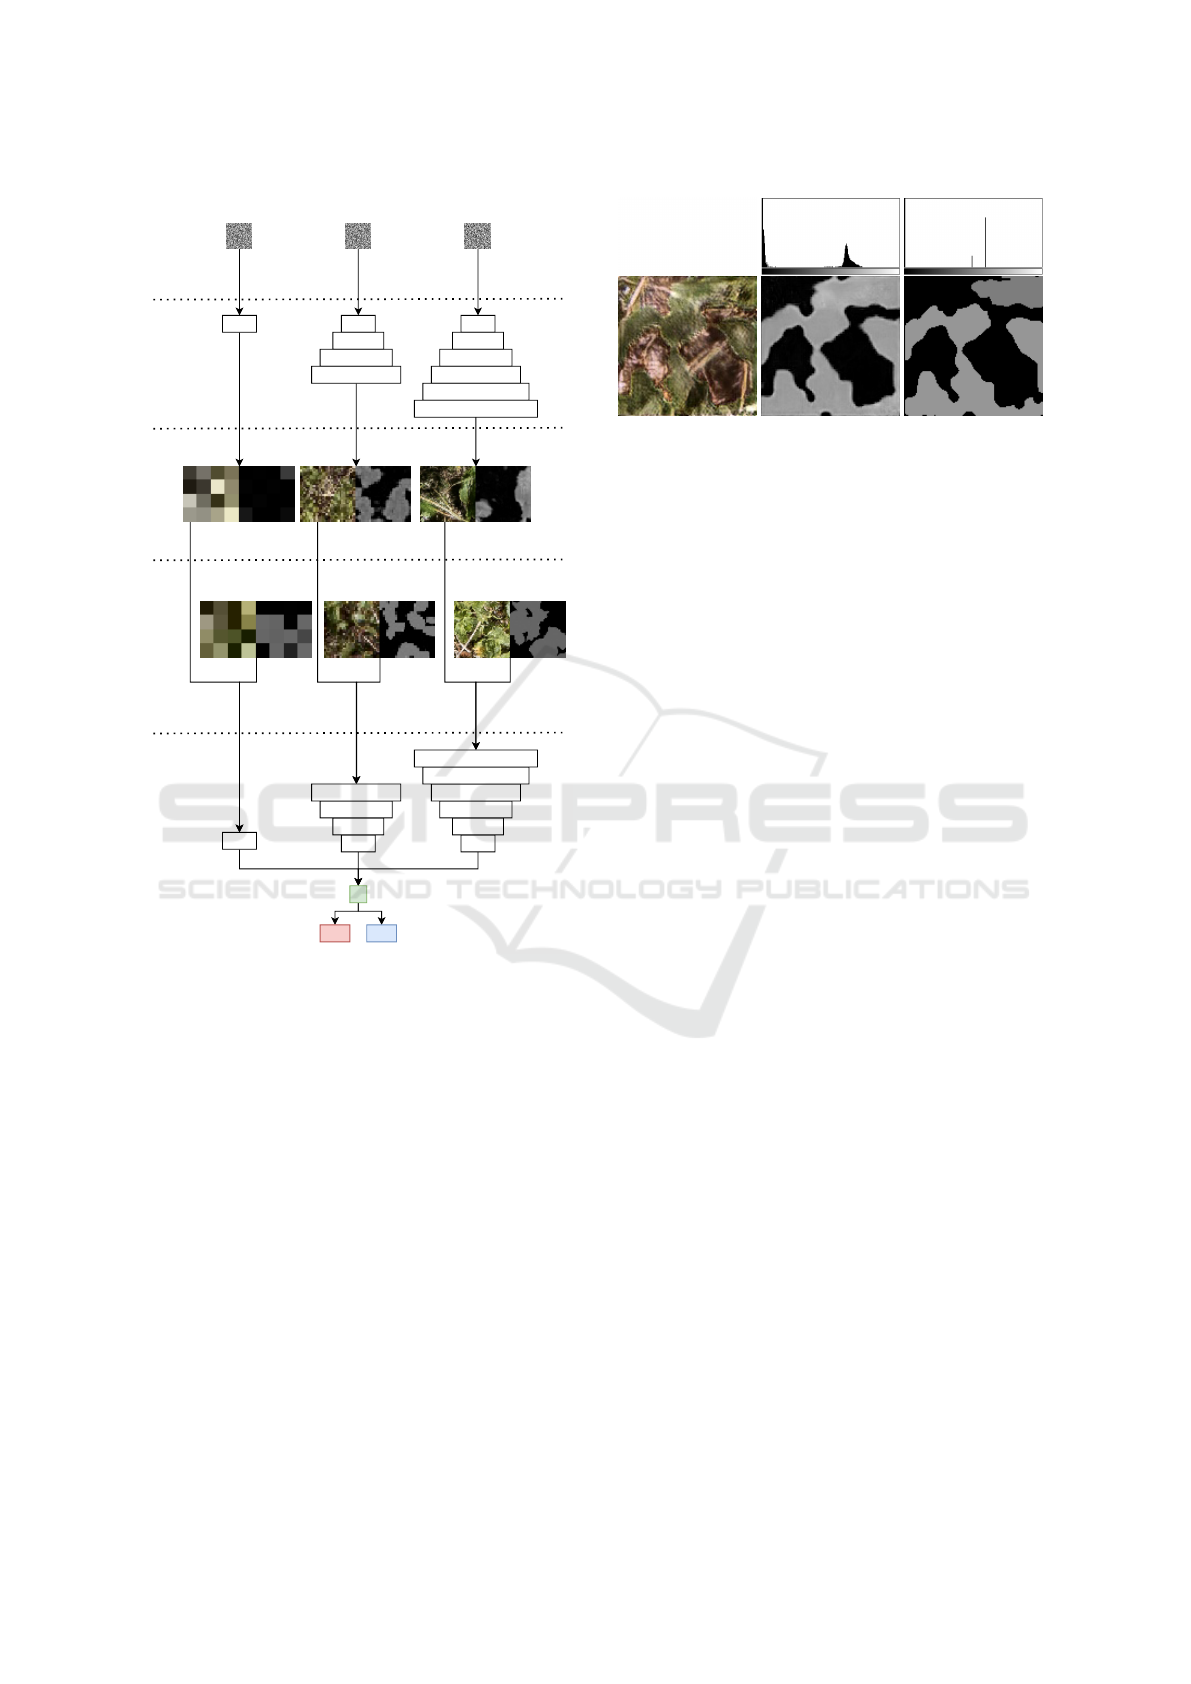
4x4
Generator
4x4
8x8
16x16
32x32
4x4
8x8
16x16
32x32
64x64
128x128
random input
... ...
Discriminator
fake images
4x4
real images
4x4
8x8
16x16
32x32
4x4
8x8
16x16
32x32
64x64
128x128
?
fake real
... ...
Figure 4: The Architecture of the Progressive Growing
Generative Adversarial Network is shown with three ex-
ample stages of the model with image sizes of 4 × 4 px,
32 × 32 px and 128 × 128 px. Based on random inputs, the
respective generator stages create fake images, which are
compared against authentic images from the training data
set within the associated discriminator stage. Reconstructed
from Figure 4 in (Zwettler et al., 2020).
acteristic of plants, the process partially results in a
splitting of regions and, with this, in sometimes mis-
classified regions, which is also recognizable in the
upper-central area of Figure 5c.
5 EVALUATION
The proposed process is evaluated based on the fol-
lowing three plant species in the created data set: Sol-
danella pusilla, Gnaphalium supinum, and Euphra-
sia minima. Due to the small reference data set, the
evaluation uses a cross-validation approach, where
(a) (b) (c)
Figure 5: The GAN model’s sample output shows (a) the
resulting RGB image and (b) the associated classification
mask with its histogram. Due to the noise in the created
mask, region-based post-processing is applied, resulting in
(c) an improved mask as highlighted by its histogram.
three randomly-selected images of the specific plant
species get removed from the data set. The remaining
images of the respective species are augmented and
used to train a single-class U-Net model. Like this,
only real-world images enter the model. Addition-
ally, the data set of all species, excluding the three
left-out images, is also augmented and used to train
a PGGAN model. This model is, in turn, employed
to generate 1000 artificial images containing the cur-
rent plant species. The generated images are then aug-
mented and used with the plant-specific images from
the real-world data set to train another U-Net model.
Based on the U-Net segmentation model trained from
exclusively real-world images and the second model
built up on real-world and artificial images, the eval-
uation involves the initially selected three images
by comparing the segmentation accuracy. This pro-
cess is done three times per plant species, with non-
overlapping evaluation examples from the base data
set, resulting in nine independent evaluation runs.
6 RESULTS
The confusion matrices associated with the evalua-
tion results are listed in Table 2 per run and image,
and summarized in Table 3 based on the Dice Score.
Reading Table 3 shows an average Dice Score of
47.96% for the real-world model and an accuracy of
36.59% for the artificial model for Soldanella pusilla,
24.16% and 26.18% for Gnaphalium supinum, and
33.56% and 42.96% for Euphrasia minima.
The evaluation shows that the utilization of a gen-
erative approach, like a PGGAN model, can be used
to enhance the data basis for the training of deep
learning models for the segmentation of fuzzy struc-
tures such as in plant species. Although, this is not
Generative Adversarial Network Synthesis for Improved Deep Learning Model Training of Alpine Plants with Fuzzy Structures
155
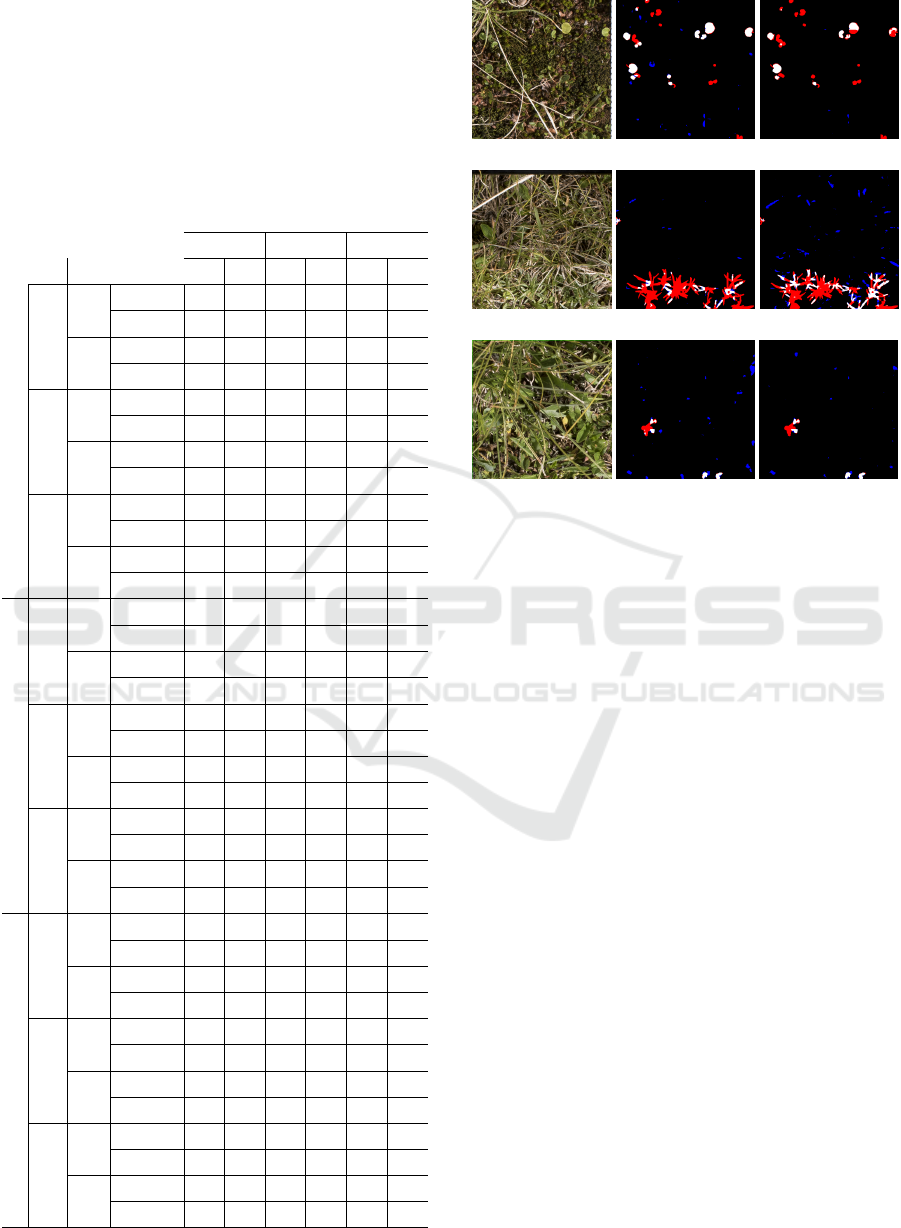
Table 2: Relative confusion matrix of the evaluation, show-
ing the individual results of the runs and the associated im-
ages based on the (in-)correctly detected foreground (FG)
and background pixels (BG) in the resulting mask, com-
pared to the ground truth (GT) mask. The matrix compares
multiple runs using U-Net segmentation models that have
been trained using real-world (RW) data only and such ones
that have been trained using both real-world as well as arti-
ficial data (AD), which has been generated using a PGGAN
model.
Image
1 2 3
Run Data FG BG FG BG FG BG
Soldanella pusilla
1
RW
FG (GT) 0.63 0.37 0.21 0.79 0.01 0.99
BG (GT) 0.01 0.99 0.01 0.99 0.00 1.00
AD
FG (GT) 0.41 0.59 0.03 0.97 0.00 1.00
BG (GT) 0.00 1.00 0.00 1.00 0.00 1.00
2
RW
FG (GT) 0.51 0.49 0.52 0.48 0.00 1.00
BG (GT) 0.01 0.99 0.00 1.00 0.00 1.00
AD
FG (GT) 0.31 0.69 0.27 0.73 0.04 0.96
BG (GT) 0.00 1.00 0.00 1.00 0.00 1.00
3
RW
FG (GT) 0.53 0.47 0.49 0.51 0.56 0.44
BG (GT) 0.00 1.00 0.01 0.99 0.01 0.99
AD
FG (GT) 0.45 0.55 0.41 0.59 0.37 0.63
BG (GT) 0.00 1.00 0.00 1.00 0.00 1.00
Gnaphalium supinum
1
RW
FG (GT) 0.17 0.83 0.28 0.72 0.00 1.00
BG (GT) 0.00 1.00 0.00 1.00 0.00 1.00
AD
FG (GT) 0.33 0.67 0.10 0.90 0.00 1.00
BG (GT) 0.02 0.98 0.01 0.99 0.00 1.00
2
RW
FG (GT) 0.69 0.31 0.28 0.72 0.01 0.99
BG (GT) 0.00 1.00 0.00 1.00 0.00 1.00
AD
FG (GT) 0.71 0.29 0.38 0.62 0.05 0.95
BG (GT) 0.00 1.00 0.00 1.00 0.01 0.99
3
RW
FG (GT) 0.04 0.96 0.02 0.98 0.08 0.92
BG (GT) 0.00 1.00 0.00 1.00 0.00 1.00
AD
FG (GT) 0.00 1.00 0.19 0.81 0.05 0.95
BG (GT) 0.00 1.00 0.00 1.00 0.01 0.99
Euphrasia minima
1
RW
FG (GT) 0.50 0.50 0.23 0.77 0.40 0.60
BG (GT) 0.01 0.99 0.01 0.99 0.02 0.98
AD
FG (GT) 0.51 0.49 0.21 0.79 0.51 0.49
BG (GT) 0.00 1.00 0.01 0.99 0.01 0.99
2
RW
FG (GT) 0.79 0.21 0.35 0.65 0.52 0.48
BG (GT) 0.01 0.99 0.00 1.00 0.01 0.99
AD
FG (GT) 0.89 0.11 0.53 0.47 0.26 0.74
BG (GT) 0.01 0.99 0.00 1.00 0.00 1.00
3
RW
FG (GT) 0.59 0.41 0.76 0.24 0.11 0.89
BG (GT) 0.01 0.99 0.03 0.97 0.00 1.00
AD
FG (GT) 0.38 0.62 0.65 0.35 0.19 0.81
BG (GT) 0.00 1.00 0.02 0.98 0.00 1.00
(a) (b) (c)
(d) (e) (f)
(g) (h) (i)
Figure 6: Evaluation results of the first image per first run
from Table 2 for Soldanella pusilla with (a, b, c), Gnaphal-
ium supinum with (d, e, f) and Euphrasia minima with (g,
h, i). The first column shows the randomly selected images
from the data set. The second column shows the raw seg-
mentation results of the real-world-only U-Net model and
the third column the raw results of the second model, which
is also based on artificial images. The segmentation results
are shown without the proposed post-processing step. Val-
ues that are classified as true-positives are shown in white,
true-negatives in black, false-positives in blue and false-
negatives in red.
applicable for all plant species, as shown with Sol-
danella pusialla in the evaluation, the results are im-
proved for Gnaphalium supinum and especially for
Euphrasia minima. These results are linked to the
used data set. The images generated using the PG-
GAN model share similar features, that have been iso-
lated during the models’ training, with the real world
images. Regardless of that, the visual quality is not
comparable to their real world counterparts, because
of the small training data set. This is particularly ev-
ident for Soldanella pusialla as the most prominent
of the ten available plant species with a comparable
huge training data set of 162 images, where the ad-
ditional, artificial and not-photorealistic images dilute
the high quality real-world images. On the other hand,
the amount of examples available for Euphrasia min-
ima are massively smaller with only 23 available im-
ages, through which the utilization of additional, ar-
tificial data shows more advantages. While Gnaphal-
ium supinum is with 103 occurrences in between of
VISAPP 2023 - 18th International Conference on Computer Vision Theory and Applications
156
Table 3: Evaluation results comparing the U-Net models based on real-world data only and the models, that are also trained
using additional artificial images, which are created using a PGGAN model.
Soldanella pusilla Gnaphalium supinum Euphrasia minima
Run
Dice Score
(Real-World)
Dice Score
(Artificial)
Dice Score
(Real-World)
Dice Score
(Artificial)
Dice Score
(Real-World)
Dice Score
(Artificial)
1 35.92% 21.27% 23.17% 19.22% 32.86% 45.53%
2 44.38% 30.86% 41.75% 46.06% 28.65% 39.76%
3 63.57% 57.64% 7.56% 13.24% 39.19% 46.60%
Avg 47.96% 36.59% 24.16% 26.18% 33.56% 42.96%
the other two plant species, also the improvements
of the second segmentation models get smaller. Fig-
ure 6 visually highlights the raw results for the first
image of every first run listed in Table 2, where the
additional, artificial training data leads to less false-
positive results for Euphrasia minima (cf. Figure 6h
and 6i) and an increased amount of true-positives,
but also an increasing number of false-positives for
Gnaphalium supinum (cf. Figure 6e and 6f). Ad-
ditionally, the Soldanella pusialla example shows an
increased number of false-negatives, while decreasing
the amount of false-positives (cf. Figure 6b and 6c).
7 CONCLUSION
The utilization of artificial data shows promise for
training deep learning models in the context of seg-
menting fuzzy structures such as alpine plants. Es-
pecially for application areas with only a few pre-
segmented examples available for training, architec-
tures such as PGGAN widen the data set and improve
results, as shown in the context of segmentation. Due
to the separation in multiple models, instead of us-
ing a combined architecture as proposed by Dong et
al. (Dong et al., 2019), this approach meets the re-
quirements of sustainable artificial intelligence (AI)
defined by the European Union. Since a separate
model is given for each plant species, the portfolio to
be segmented and classified can be expanded at any
time. Otherwise, the training for a cumulative deep
learning model would have to be trained each time for
each adaptation, using immense amounts of energy.
The fragmentation into separate models supports an-
other premise of the European Union regarding ma-
chine learning and AI, namely explainability. By di-
viding the task into separate models, good technolog-
ical conditions are created to support explainable AI.
In the future, we plan to increase the number of
tests further. The behaviour of the approach will be
tested for taller plants such as Scorzoneroides hel-
vetica. Additional plant species will be included as
they become available.
ACKNOWLEDGMENTS
Our thanks to the province of Upper Austria for fa-
cilitating the project AlpinIO with the easy2innovate
funding program.
REFERENCES
Antoniou, A., Storkey, A., and Edwards, H. (2017). Data
augmentation generative adversarial networks. arXiv
preprint arXiv:1711.04340.
Brunetti, M., Magoga, G., Iannella, M., Biondi, M.,
and Montagna, M. (2019). Phylogeography and
species distribution modelling of cryptocephalusbarii
(coleoptera: Chrysomelidae): is this alpine endemic
species close to extinction? ZooKeys, 856:3.
Chen, X., Li, Y., Yao, L., Adeli, E., and Zhang, Y. (2021).
Generative adversarial u-net for domain-free medical
image augmentation. arXiv e-prints, pages arXiv–
2101.
Creswell, A., White, T., Dumoulin, V., Arulkumaran, K.,
Sengupta, B., and Bharath, A. A. (2018). Generative
adversarial networks: An overview. IEEE Signal Pro-
cessing Magazine, 35(1):53–65.
Dirnb
¨
ock, T., Dullinger, S., and Grabherr, G. (2003). A
regional impact assessment of climate and land-use
change on alpine vegetation. Journal of Biogeogra-
phy, 30(3):401–417.
Dong, X., Lei, Y., Wang, T., Thomas, M., Tang, L., Cur-
ran, W. J., Liu, T., and Yang, X. (2019). Automatic
multiorgan segmentation in thorax ct images using u-
net-gan. Medical physics, 46(5):2157–2168.
Eberl, T. and Kaiser, R. (2020). Monitoring-
und Forschungsprogramm zur langfristigen
¨
Okosystembeobachtung im Nationalpark Hohe
Tauern. Verlag der
¨
Osterreichischen Akademie der
Wissenschaften.
Engler, R., Randin, C. F., Thuiller, W., Dullinger, S., Zim-
mermann, N. E., Ara
´
ujo, M. B., Pearman, P. B.,
Le Lay, G., Piedallu, C., Albert, C. H., et al. (2011).
21st century climate change threatens mountain flora
unequally across europe. Global Change Biology,
17(7):2330–2341.
Fadnavis, S. (2014). Image interpolation techniques in dig-
ital image processing: an overview. International
Generative Adversarial Network Synthesis for Improved Deep Learning Model Training of Alpine Plants with Fuzzy Structures
157

Journal of Engineering Research and Applications,
4(10):70–73.
Gobbi, M., Ambrosini, R., Casarotto, C., Diolaiuti, G.,
Ficetola, G., Lencioni, V., Seppi, R., Smiraglia, C.,
Tampucci, D., Valle, B., et al. (2021). Vanishing
permanent glaciers: climate change is threatening a
european union habitat (code 8340) and its poorly
known biodiversity. Biodiversity and Conservation,
30(7):2267–2276.
Guo, X., Chen, C., Lu, Y., Meng, K., Chen, H., Zhou, K.,
Wang, Z., and Xiao, R. (2020). Retinal vessel segmen-
tation combined with generative adversarial networks
and dense u-net. IEEE Access, 8:194551–194560.
Karras, T., Aila, T., Laine, S., and Lehtinen, J. (2018). Pro-
gressive growing of gans for improved quality, sta-
bility, and variation. In International Conference on
Learning Representations.
Kingma, D. P. and Ba, J. (2014). Adam: A method for
stochastic optimization. In International Conference
on Learning Representations.
K
¨
orner, C. (2012). Alpine Treelines. Springer.
K
¨
orner, C., Berninger, U., Daim, A., Eberl, T.,
Fern
´
andez Mendoza, F., F
¨
ureder, L., Grube, M.,
Hainzer, E., Kaiser, R., Meyer, E., Newesely, C.,
Niedrist, G., Petermann, J., Seeber, J., Tappeiner, U.,
and Wickham, S. (in press 2022). Long-term monitor-
ing of high elevation terrestrial and 2 aquatic ecosys-
tems in the alps – a five-year synthesis. ecomont,
14:44–65.
K
¨
orner, C. and Hiltbrunner, E. (2021). Why is the alpine
flora comparatively robust against climatic warming?
Diversity, 13:1–15.
Ronneberger, O., Fischer, P., and Brox, T. (2015). U-net:
Convolutional networks for biomedical image seg-
mentation. In International Conference on Medical
image computing and computer-assisted intervention,
pages 234–241. Springer.
Rother, C., Kolmogorov, V., and Blake, A. (2004). ” grab-
cut” interactive foreground extraction using iterated
graph cuts. ACM transactions on graphics (TOG),
23(3):309–314.
Rubel, F., Brugger, K., Haslinger, K., Auer, I., et al. (2017).
The climate of the european alps: Shift of very high
resolution k
¨
oppen-geiger climate zones 1800–2100.
Meteorologische Zeitschrift, 26(2):115–125.
Rukundo, O. and Cao, H. (2012). Nearest neighbor value
interpolation. International Journal of Advanced
Computer Science and Applications, 3(4):25–30.
Rumpf, S. B., H
¨
ulber, K., Wessely, J., Willner, W., Moser,
D., Gattringer, A., Klonner, G., Zimmermann, N. E.,
and Dullinger, S. (2019). Extinction debts and col-
onization credits of non-forest plants in the european
alps. Nature communications, 10(1):1–9.
Sandfort, V., Yan, K., Pickhardt, P. J., and Summers, R. M.
(2019). Data augmentation using generative adversar-
ial networks (cyclegan) to improve generalizability in
ct segmentation tasks. Scientific reports, 9(1):1–9.
Schonfeld, E., Schiele, B., and Khoreva, A. (2020). A u-
net based discriminator for generative adversarial net-
works. In Proceedings of the IEEE/CVF Conference
on Computer Vision and Pattern Recognition, pages
8207–8216.
Shukla, P., Skea, J., Calvo Buendia, E., Masson-Delmotte,
V., P
¨
ortner, H., Roberts, D., Zhai, P., Slade, R., Con-
nors, S., Van Diemen, R., et al. (2019). Ipcc, 2019:
Climate change and land: an ipcc special report on
climate change, desertification, land degradation, sus-
tainable land management, food security, and green-
house gas fluxes in terrestrial ecosystems. Intergov-
ernmental Panel on Climate Change (IPCC).
Sommer, C., Malz, P., Seehaus, T. C., Lippl, S., Zemp,
M., and Braun, M. H. (2020). Rapid glacier retreat
and downwasting throughout the european alps in the
early 21 st century. Nature communications, 11(1):1–
10.
Steinbauer, K., Lamprecht, A., Winkler, M., Di Cecco, V.,
Fasching, V., Ghosn, D., Maringer, A., Remoundou,
I., Suen, M., Stanisci, A., Venn, S., and Pauli,
H. (2022). Recent changes in high-mountain plant
community functional composition in contrasting cli-
mate regimes. Science of The Total Environment,
829:154541.
Sun, C., Shrivastava, A., Singh, S., and Gupta, A. (2017).
Revisiting unreasonable effectiveness of data in deep
learning era. In Proceedings of the IEEE international
conference on computer vision, pages 843–852.
Zwettler, G. A., Holmes III, D. R., and Backfrieder, W.
(2020). Strategies for training deep learning models in
medical domains with small reference datasets. Jour-
nal of WSCG. 2020.
VISAPP 2023 - 18th International Conference on Computer Vision Theory and Applications
158
