
Classifying Intelligence Tests Patterns Using Machine Learning Methods
Georgios Liapis
a
, Loukritira Stefanou and Ioannis Vlahavas
b
Aristotle University of Thessaloniki, Thessaloniki, Greece
Keywords:
Intelligence, Raven Matrices, Machine Learning, Pattern Classification.
Abstract:
Intelligence testing assesses a variety of cognitive abilities and is frequently used in the evaluation of people
for jobs, army recruitment, scholarships, and the educational system in general. Licensed psychologists and
researchers create and analyze intelligence tests, setting the difficulty layer, grading them, and weighing the
results on a global scale. However, developing new model tests is a time-consuming and challenging pro-
cess. In this study, we lay the groundwork for developing a model that classifies the IQ patterns, in order to
generate new IQ Raven tests. More specifically, we analyze Raven’s Progressive Matrices Tests, a nonverbal
multiple-choice intelligence test, and their patterns using a variety of Machine Learning (ML) techniques. In
such intelligence tests, the question’s data includes mostly abstract images aligned in a grid system, with one
missing element and a pattern that connects them by threes in horizontal and vertical order. These tests have
been labeled based on several factors, such as the number of images, the type of pattern (e.g. counting, adding,
or rotating), or their complexity and in order to classify them, various ML methods are used. Results of the
current study act as a defining basis for the use of advanced Neural Network models, not only for classification
but also for the generation of new IQ patterns.
1 INTRODUCTION
Intelligence is one of the most intriguing research
topics, and many people believe that evaluating it is
crucial. Many attempts have been made throughout
history to develop tests that would make this assess-
ment feasible and valid. The Raven Progressive Ma-
trices (John and Raven, 2003) are tests that achieve
Intelligence Quotient (IQ) assessment, amongst other
things, and are utilized by numerous organizations
across the world. They are based on a grid of nine
elements, each of which is related to the ones in the
same row (or column), and the final element is miss-
ing. The individual must first identify the pattern that
connects these figures to find the missing one.
In recent years, technology has advanced signif-
icantly, and many attempts have been made to ad-
dress previously unsolved problems, particularly in
the area of picture identification and classification.
Attempts to classify pictures with topics ranging from
animals to handwritten symbols have been effective
(noa, ). With the use of methods, like Machine Learn-
ing (ML), and in particular, Neural Networks (NN),
such challenges can be solved in a variety of ways.
Despite the fact that Artificial Intelligence (AI) has
a
https://orcid.org/0000-0003-1124-4257
b
https://orcid.org/0000-0003-3477-8825
numerous applications in image classification, iden-
tifying and classifying patterns is a novel, intriguing,
and challenging aspect. This is because discovering
hidden relationships between image elements differs
from identifying specific elements in a picture.
In this paper, we propose AI methods that can
classify Raven IQ tests based on custom labels for
how they handle the pattern. More specifically, we
categorize the kind of pattern, whether it was about
adding or subtracting elements, or some parts of the
elements were moving, or there were elements that
existed on a vertical or horizontal axis.
The method of finding the images online turned
out to be challenging. Web scraping was used to find
pictures with the necessary features, but very few of
them were in the right format. Unfortunately, pic-
tures with Raven patterns in a certain type of grid, that
were of good quality and free of noise were uncom-
mon. We did manage to find and collect an adequate
amount of data nonetheless.
Next, we build models using state-of-the-art AI
methods, that they can be trained to identify the pat-
tern in a very abstract way. To reach a high enough
level of efficiency, such algorithms require a large
number of resources and data, which is a significant
limitation in this type of work.
Another challenge we had to overcome is the di-
Liapis, G., Stefanou, L. and Vlahavas, I.
Classifying Intelligence Tests Patterns Using Machine Learning Methods.
DOI: 10.5220/0011606500003411
In Proceedings of the 12th International Conference on Pattern Recognition Applications and Methods (ICPRAM 2023), pages 717-724
ISBN: 978-989-758-626-2; ISSN: 2184-4313
Copyright
c
2023 by SCITEPRESS – Science and Technology Publications, Lda. Under CC license (CC BY-NC-ND 4.0)
717
mensions of the images. There is a high computa-
tional need when trying to diminish the images’ di-
mensions. However, we used our available computing
power as efficiently as possible to create models that
could perform well on average.
This paper contributes to analyzing the way Raven
IQ tests work as patterns and can be used as a first step
to create models that can generate new IQ tests.
Regarding the paper’s structure, we first examine
related research that has been done in the classifica-
tion of IQ tests, and then providing a general overview
of the major issues, such as human, artificial, and
machine learning. The creation and preparation of
our data set is covered in the following chapter, af-
ter which we introduce our models and analyze the
training procedure. We also include a discussion and
possible future work at the end.
2 RELATED WORK
Numerous attempts have been made to classify a va-
riety of images, but to the best of our knowledge, the
classification of Raven IQ test images based on pat-
tern types is the first of its kind.
One of the best known examples is the CIFAR
data set (Krizhevsky, 2009), which is a data collec-
tion that includes 50,000 training photos and 10,000
test photos with 10 different labels (airplane, automo-
bile, bird, cat, deer, dog, frog, horse, ship, and truck).
Three convolutional layers are followed by concen-
tration layers in the model that conducts the classifi-
cation of these images.
Other pattern recognition problems that have been
solved, include topics like optical microscopy images
(Bulgarevich et al., 2018). In this work, the Random
Forest classifier was used, with highly accurate re-
sults.
Regarding the combination of IQ tests and
AI methods, deep learning methods were used to
solve abstract visual reasoning domain problems
(Małki
´
nski and Ma
´
ndziuk, 2022). More specifically,
this paper reviews the work regarding traditional and
neural network models trying to solve Raven Progres-
sive Matrices. The difference between this approach
and ours is that we label and categorize the matrices
themselves, while the above research tries to solve the
matrix while having the answer as a label.
Based on these findings, we decided to use not
only traditional ML methods, but also Neural Net-
works, to classify IQ tests and compare our models
in such a diverse and complicated data set.
3 BACKGROUND
This section delves into the definition of intelligence,
its qualities, and how it is measured. In this section,
we also define artificial intelligence and analyze the
details of the methodologies we utilize.
3.1 Human Intelligence
There are numerous definitions of intelligence, as it is
such a complex aspect of human life. In a broad sense,
it’s defined as ”the intellectual activity of capturing
the important elements of a situation and accurately
responding to its demands” (Heim, 1970). Many at-
tempts have been made to lay a foundation of its char-
acteristics and establish a theory about it.
The Intelligence Quotient (IQ) refers to a person’s
ability to deliberately adapt his spirit to new surround-
ings and requirements, as well as to new responsibili-
ties and living conditions (Stern, 1949).
A common practice to employ the processing
speed to given tasks is intelligence testing (IQ Tests).
The questions on IQ tests are designed to look at
a wide range of mental abilities, including the ones
mentioned above. There are samples for each type of
question that could come on an IQ test for each kinds.
The most common IQ tests were created by Raven
(John and Raven, 2003), and they consist of a grid of
9 shapes that follow one or more patterns horizontally
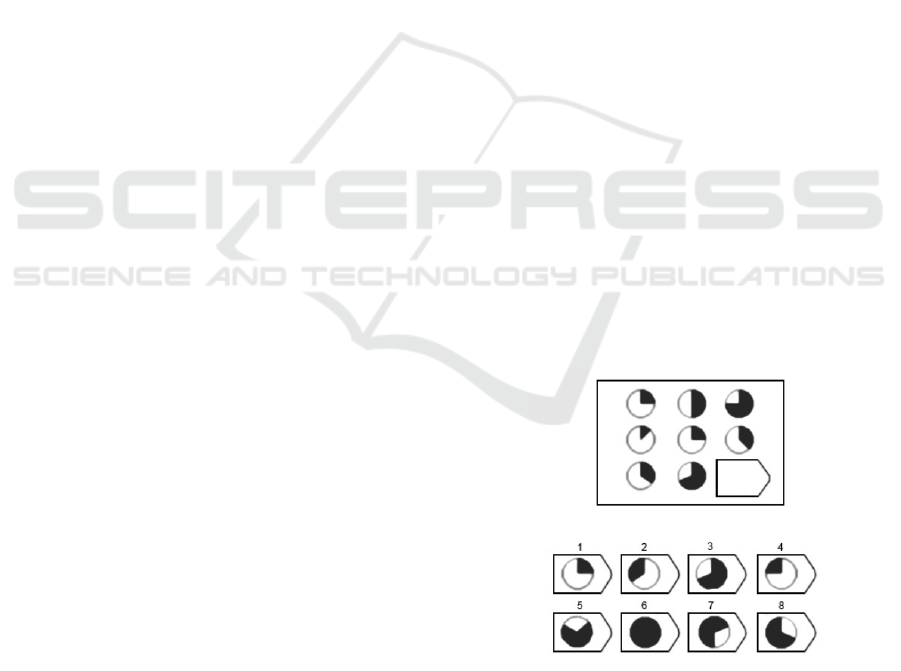
and vertically. For example, Figure 1 depicts a Raven
IQ test, with each circle changing by a certain amount
each time, and the correct answer is 6. Usually, these
tests have six to eight possible answers, of which only
one is correct.
Figure 1: Indicative IQ test.
3.2 Artificial Intelligence
Artificial intelligence (AI) is a field of computer sci-
ence that specializes in computers that mimic human
intelligence (Barr and Feigenbaum, 1981). Machine
ICPRAM 2023 - 12th International Conference on Pattern Recognition Applications and Methods
718

learning arose out of the need for complex Artificial
Intelligence applications for which human was unable
to provide knowledge representation through analysis
and problem-solving. As a result, this role is carried
out by a computer, which, using data provided by the
user, employs various machine learning techniques to
draw his own conclusions from the information pro-
vided.
3.3 Machine Learning Methods
There are numerous traditional Machine Learning
(ML) technologies available that can be used in classi-
fying objects, like K-Nearest Neighbours (KNN), De-
cision Trees, and Random Forest. These models are
part of supervised learning, and they detect and clas-
sify patterns by analyzing labeled data.
3.3.1 K-Nearest Neighbours
One of the best-known techniques for image classifi-
cation is the k-Nearest Neighbors (KNN) algorithm.
One can utilize this algorithm with a limited set of
data, like ours, as it does not ”learn” any function
from the input. In fact, it is based on the distances
between feature vectors, being the pixels of the pho-
tographs in this example. As a result of its simplicity,
its performance can be used as a benchmark for other
models.
3.3.2 Decision Trees
One of the most well-liked tree-structured learning al-
gorithms is the decision tree. The internal nodes stand
in for the feature of a data set, branches for the rules
of the decision, and each leaf node for the result. The
values of the root’s attribute are compared to the val-
ues of the image’s attribute to predict a tag for an im-
age. It moves to the next node based on the compari-
son and follows the matched branch.
3.3.3 Random Forest
The Random Forest Algorithm is founded on the idea
of ensemble learning. It is a classifier that uses sev-
eral decision trees on different subsets of the data set
and improves performance by using either the average
value or the majority vote of the trees (Cutler et al.,
2012).
3.3.4 Artificial Neural Networks
Another method is Artificial Neural Networks (NN),
a machine learning technology, that simulates the hu-
man nervous system. They combine people’s abil-
ity to grasp objects and circumstances with comput-
ers’ ability to quickly conduct operations, handle, and
store enormous volumes of data.
In relation to a human neuron, the one that has a
predetermined activation function receives the data as
weighted input and eventually makes predictions. In
essence, an activation function determines whether or
not to stimulate the cell. If not, new computations
must be made using the threshold, weights, and bi-
ases. A bias is a constant parameter used to modify
the output. The activation function may only in some
circumstances be step, sigmoid, hyperbolic, ramp, or
linear (Dongare et al., 2012).
Convolutional Neural Networks (CNN) are a type
of Deep Neural Network that is linked to the biologi-
cal structure of the brain, specifically, the part respon-
sible for vision perception (Hubel and Wiesel, 1962).
Each image via which CNN is trained is viewed as a
two-dimensional table. Their job is to reduce the pic-
tures to a format that is easier to alter while maintain-
ing the features that are necessary for a solid forecast.
4 METHODOLOGY
In this section, we describe how we created and la-
beled the data as well as how the models were built
for classifying new data.
4.1 Data Set Creation
There have been suggested few well-known data sets
that are similar to Raven IQ test matrices, like D-set
and G-set (Ma
´
ndziuk and
˙
Zychowski, 2019), PGM
(Barrett et al., 2018a) and RAVEN (Zhang et al.,
2019) amongst others. These data sets offer a variety
of tests, that only include the possible answers along
with a label for the correct answer. For the scope of
this paper, a new data set with custom-made labels
was created. We employed two distinct methodolo-
gies and tools to find the images that would comprise
the data set. First, we wrote scripts for scraping im-
ages from the internet using tags. Then we used tools
for a more specialized scrape of specific pages. We
obtained approximately 6000 images relevant to IQ
test questions using these methods. After removing
the duplicates and making the appropriate selection,
1500 images remained to be processed.
4.2 Labelling Methodology
Following the data collection, the next step was to la-
bel them, since the model would have to learn to dif-
ferentiate the IQ tests based on the patterns they in-
Classifying Intelligence Tests Patterns Using Machine Learning Methods
719
cluded. The way a test is created can help classify
it, based on aspects like the relation between the ele-
ments of each test (e.g. progression pattern), the ob-
jects (e.g. their shape) and the attributes (e.g. num-
ber) (Barrett et al., 2018b). There are also reviews on
how to solve various types of puzzles, problems, and
riddles. (Gardner, 2005) , (Hern
´
andez-Orallo et al.,
2016). All these can be noted as a baseline for our
label proposition.
The labels proposed are related to the pattern, how
it is changing, and the objects from which it consists.
These are the core elements that change the difficulty
and complexity of such IQ tests. The presence of
more objects and how these are related has an impact
on the time one needs to find and decipher the pattern
as a whole. In more detail, there are four main labels:
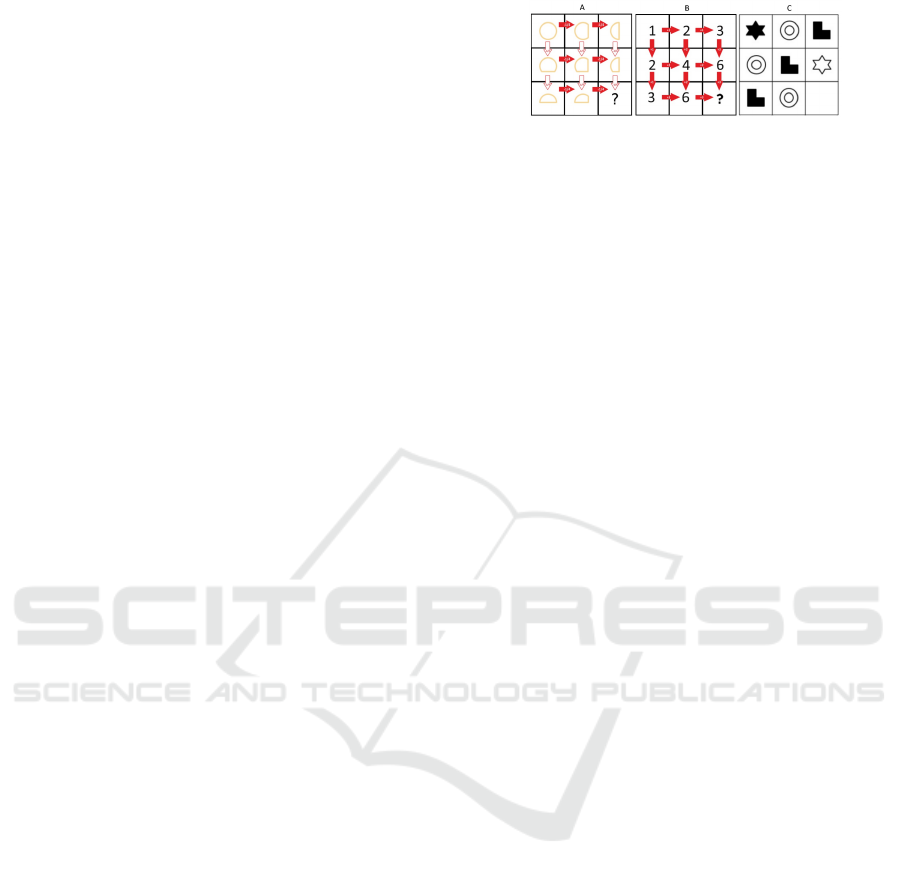
• Pattern Orientation: The structure and the axis on
which the pattern is shown. Specifically, whether
it is constructed horizontally, vertically, or both.
As we can observe in Figure 2, the pattern exists
on both axes in all the tests.
• Process: The change of each process of the pattern
as an action. That is, whether it stays the same
or changes from shape to shape. The operation
is variable in Figure 2(A) because the quantity is
deducted from the right side of the figure on the
horizontal axis, while on the vertical axis from the
bottom side. On the other hand, we can see in
Figure 2(B) that the operation has the same impact
in all circumstances.
• Process Value: The value of the pattern and
whether it changes. It can be classified as either
variable or constant. Figure 2(A) shows a con-
stant quantity of ¼, but Figure 2(B) shows a vari-
able quantity that might be 1, 2, or 3.
• Pattern Kind: The general way the pattern is at-
tributed to the elements. There are numerous
types of inquiries that can be classified. They
were, however, generalized to the point that each
category represents a collection of subcategories.
– Quantity Change: They include operations be-
tween numbers and shapes, as well as multipli-
cation and subtraction operations.
– Movement: Rotation and simple form move-
ment are some examples.
– Existence: It encompasses not only the basic
existence of shapes or numbers but also their
combinations. The exact instance is shown in
Figure 2(C).
In Table 1, we can observe all the labels and their
values. These were used to categorize the data set for
the model to classify each IQ test.
Figure 2: Indicative IQ tests with different patterns.
After labeling the data, the next step was to train
our models. We must also note that all of our models
tried to classify the tests based on the Pattern Kind
label.
4.3 Training Results
We used a variety of methods, from traditional ones
(K-Nearest Neighbors, Decision Trees, and Random
Forest) to Neural Networks using the sklearn library
and TensorFlow. We also applied some feature extrac-
tion techniques and the Fourier transformation, which
represents an image as a sum of sinusoidal waves.
Furthermore, we converted images in the form of
a NumPy array to a Keras image array, which is a 4d
tensor with the dimension being the batch size, height,
width, and channels. This gave the ability to easily
manipulate the image tensor with the TensorFlow op-
erations.
Then, we scaled the pixel values of our image ten-
sor from the range [0,255] to [0,1] which helped the
models to learn more effectively.
Finally, the data set was first split into training
(80%) and test (20%) and the test set to a validation
set for the cross-validation process during the training
of the NN.
4.3.1 K-Nearest Neighbors
We run multiple instances of the model, with different
values for k, and we finally used k = 3 for the training,
with a yield of F1 score of 46%, a low score taking
into account it is a simple classifier considering the
probability of randomly guessing the correct class is
13%. Moreover, as shown in Table 2, the metrics with
the Fourier are lower, with an F1 score of 44%.
Nonetheless, there is a fairly good distribution of
predictions in the classes according to Figure 3, which
displays a table that is frequently used to describe the
performance of the model (Confusion Matrix).
4.3.2 Decision Tree
For the training of this model we set the max depth to
15 and the F1 score is 39%, as seen in Table 3 with
both Fourier transform applied or not, which is a quite
low percentage due to decision trees’ proclivity for
overfitting to training data.
ICPRAM 2023 - 12th International Conference on Pattern Recognition Applications and Methods
720
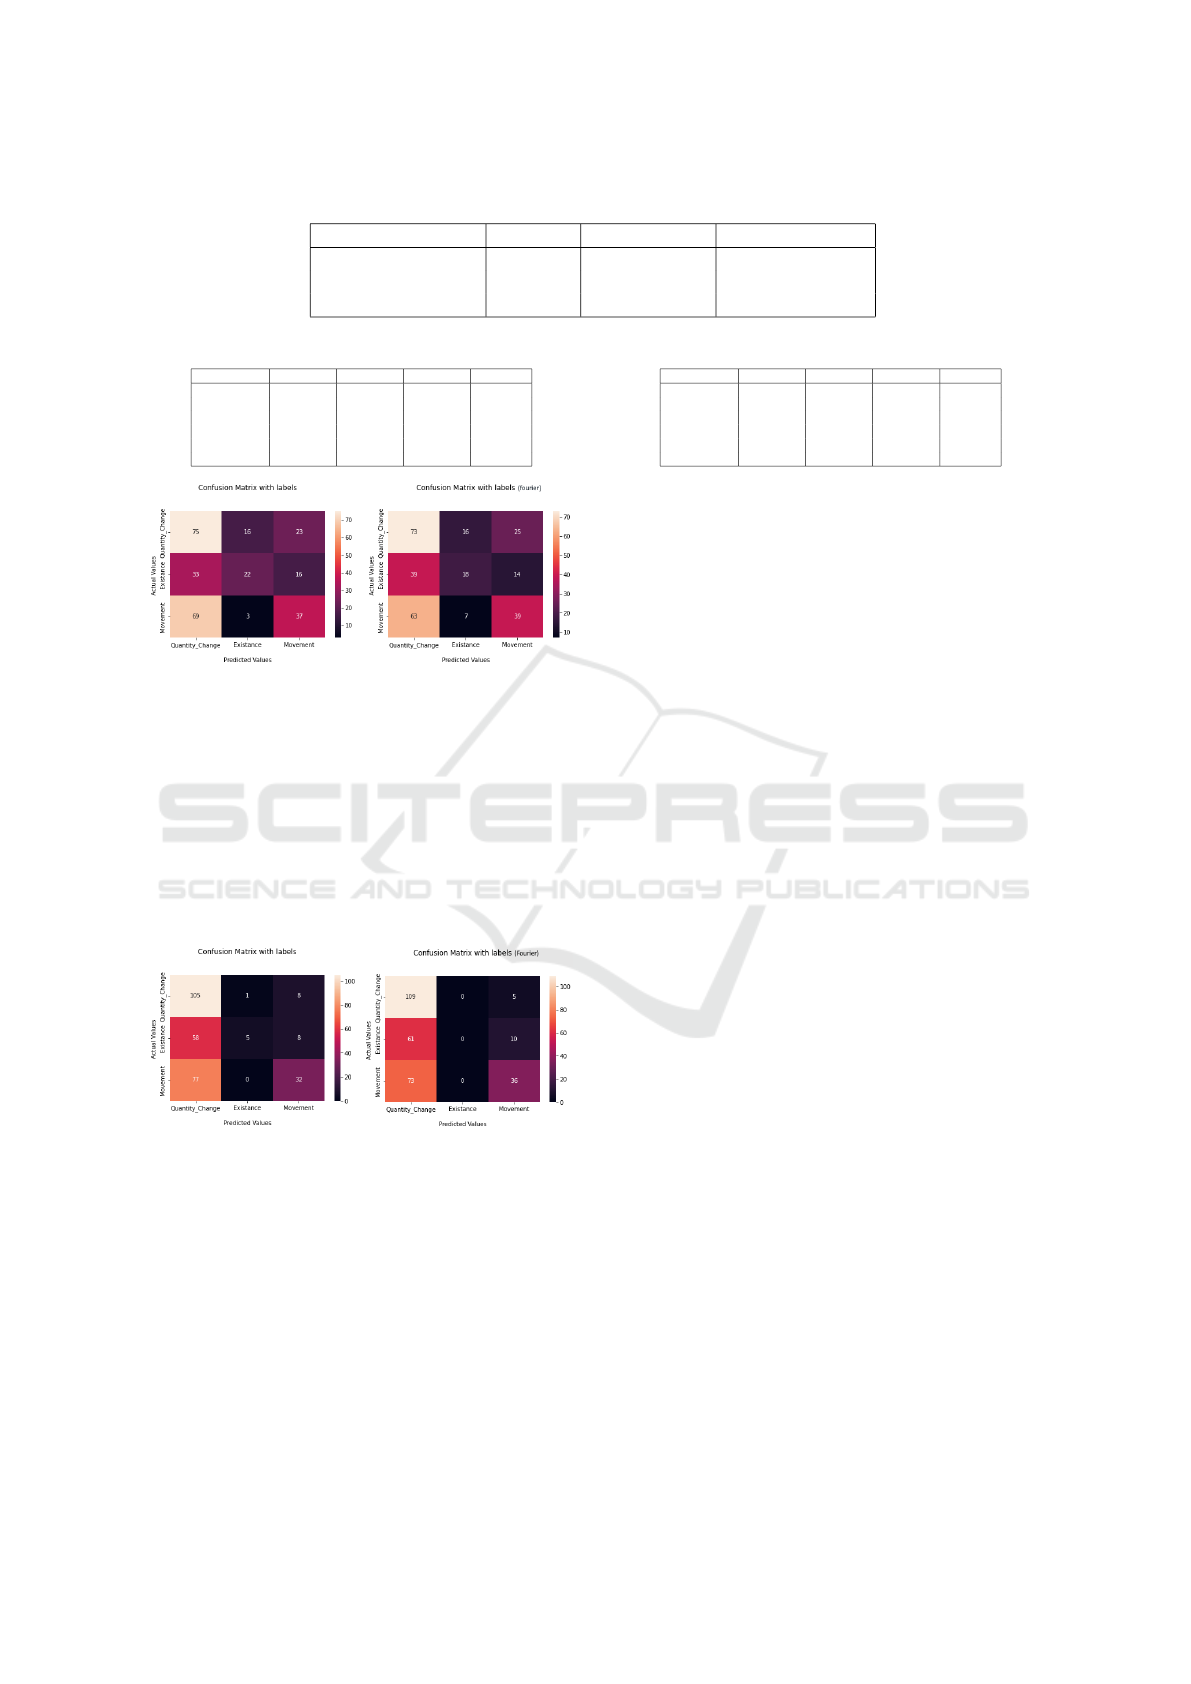
Table 1: Data set labels.
Pattern Orientation Process Process Value Pattern Kind
Horizontal Constant Constant Quantity Change
Vertical Variable Variable Movement
Both Existence
Table 2: Metrics for KNN results (with Fourier).
precision recall f1 score support
class 0 0.42 (0.42) 0.66 (0.64) 0.52 (0.51) 114 (114)
class 1 0.44 (0.44) 0.31 (0.25) 0.39 (0.32) 71 (71)
class 2 0.49 (0.50) 0.34 (0.36) 0.40 (0.42) 109 (109)
accuracy 0.46 (0.44) 294 (294)
macro avg 0.48 (0.45) 0.44 (0.42) 0.44 (0.41) 294 (294)
weighted avg 0.47 (0.45) 46 (0.44) 0.44 (0.41) 294 (294)
Figure 3: Confusion Matrix for KNN results (left simple,
right with Fourier).
4.3.3 Random Forest
For the random forest model we also set the max
depth equal to 15. The model has an F1 score of
48% without the Fourier, and 49% with the Fourier
applied, as depicted in Table 4.
It distributes the most samples in the first, and
most numerous, class, as shown in Figure 4, some-
thing that explains the models results.
Figure 4: Random Forest Confusion Matrix.
4.3.4 Convolutional Neural Networks (CNN)
For our CNN model, we used filters of varying sizes
and convolutional layers. We made two different
models, by changing the number of the convolutional
layers to two or three but with a similar structure,
which follows:
• First convolutional layer: filter size 32 and ReLU
activation function
• First layer of Pool: Max Pooling with a size of
2x2.
Table 3: Metrics for Decision Tree results (with Fourier).
precision recall f1 score support
class 0 0.40 (0.40) 0.39 (0.49) 0.39 (0.44) 114 (114)
class 1 0.32 (0.18) 0.35 (0.17) 0.34 (0.17) 71 (71)
class 2 0.42 (0.53) 0.41 (0.43) 0.42 (0.48) 109 (109)
accuracy 0.39 (0.39) 294 (294)
macro avg 0.38 (0.37) 0.38 (0.36) 0.38 (0.38) 294 (294)
weighted avg 0.39 (0.40) 39 (0.39) 0.39 (0.39) 294 (294)
• Second convolutional layer: filter size 32 and
ReLU activation function (This filter is size 64
when we have a third convolutional layer)
• Max Pooling’s second layer
• Third convolutional layer: filter size 64 and ReLU
activation function (This exists only on the second
model)
• Max Pooling’s second layer (This exists only on
the second model)
• Flatten Layer: convert the data to a one-
dimensional table before continuing to the next
layer
• First fully connected layer (Dense Layer) with an
output size of 64
• Second Dense Layer which has an output size of
three, same as the number of classes we predict
The learning rate, the number of epochs that the
model runs, and the batch size, which is the number of
training data repetitions utilized, were all fine-tuned
during the training procedure of these models.
The accuracy of the first model (two convolutional
layers), was high in many cases and loss was minimal
during the training, but this was not the case in the val-
idation set. As a result, we changed the batch size and
epochs. We notice that when we reduce the number
of epochs the model is able to generalize more effec-
tively. On the other hand, when we reduce the batch
size, the model’s F1 score also decreased. So, when
we altered these two parameters at the same time, the
model became more efficient, and the classification
became more uniform. Regarding the second model,
with three layers of convolutional, we reduced the
learning rate and followed the same methodology as
the first model regarding the batch size and the epoch
parameters. This made our models more efficient.
In Figure 5 we observe the confusion matrix for
the second model. The validation loss is limited to
1.31, and the F1 score is 56%, which is remarkable
considering that the first models had a validation loss
of 1.8 and an F1 score of up to 54%.
Classifying Intelligence Tests Patterns Using Machine Learning Methods
721
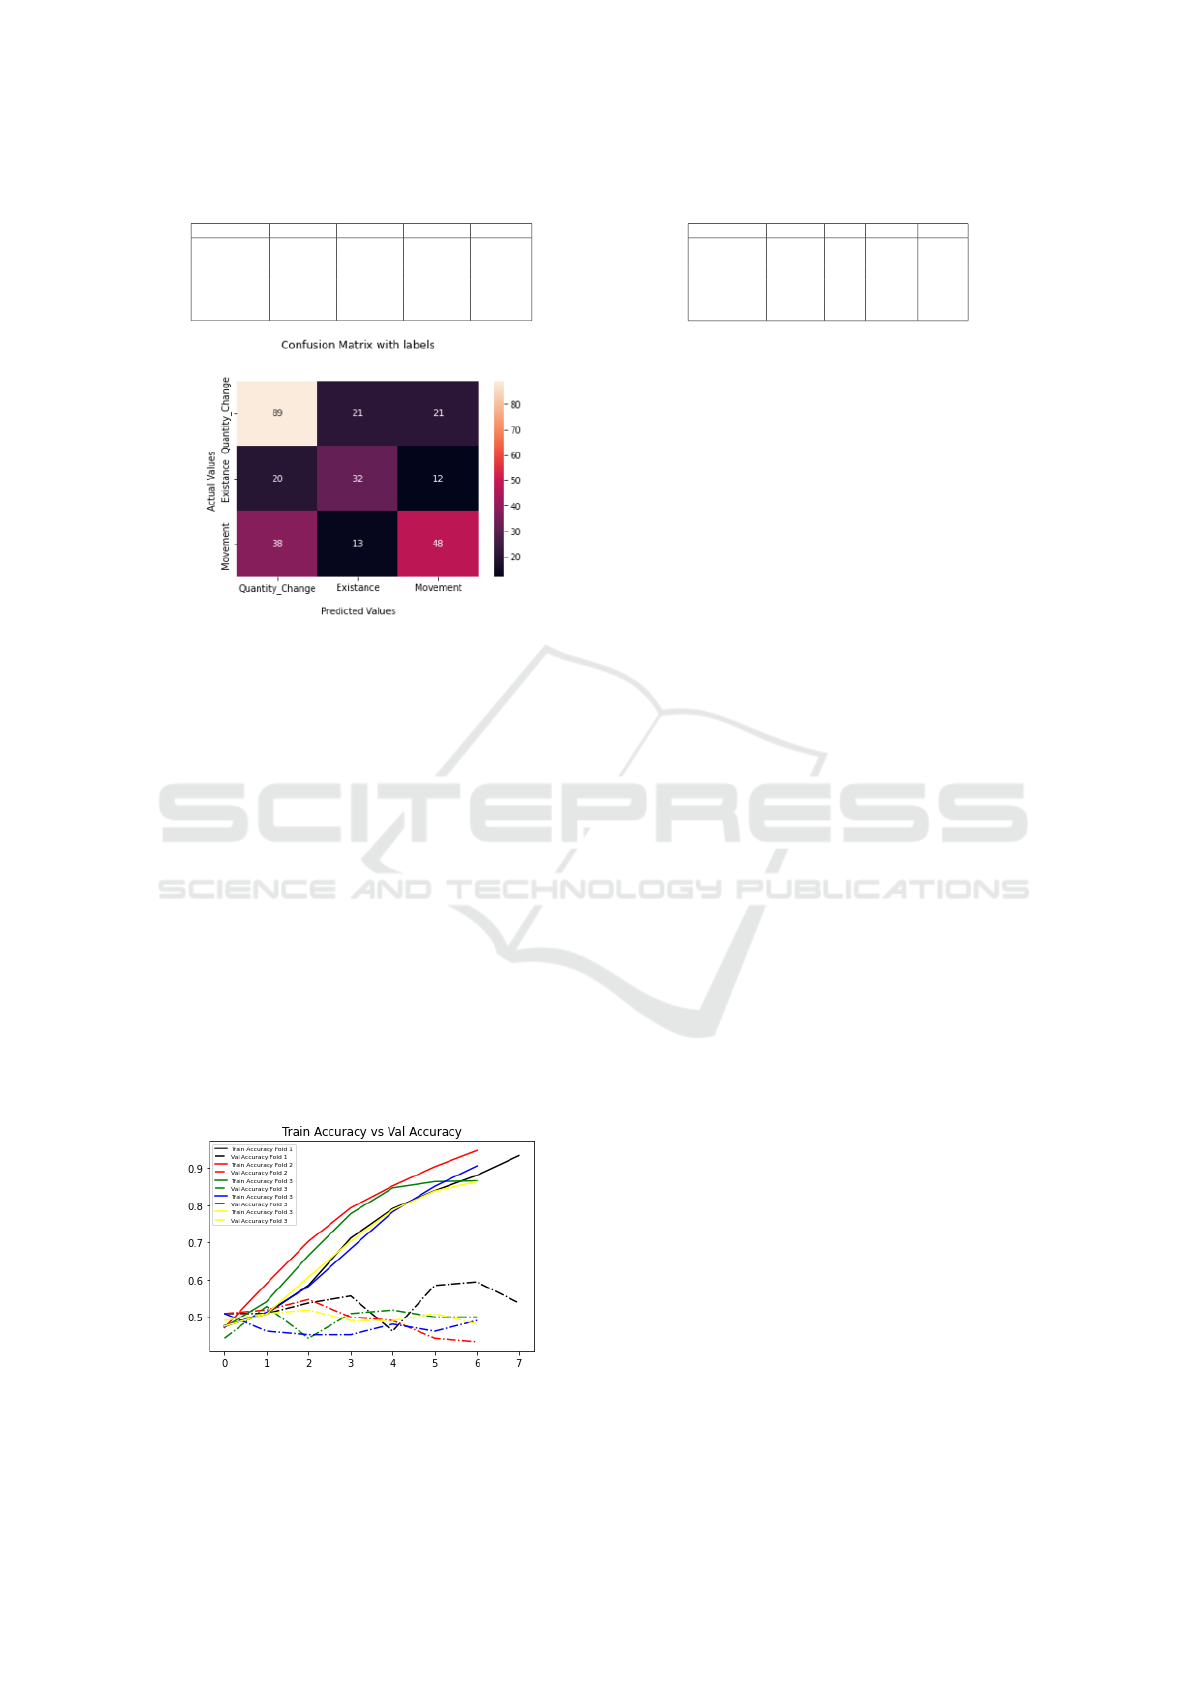
Table 4: Metrics for Random Forest results (with Fourier).
precision recall f1 score support
class 0 0.44 (0.45) 0.92 (0.96) 0.59 (0.61) 114 (114)
class 1 0.83 (0.00) 0.07 (0.00) 0.13 (0.00) 71 (71)
class 2 0.67 (0.71) 0.29 (0.33) 0.41 (0.45) 109 (109)
accuracy 0.48 (0.49) 294 (294)
macro avg 0.65 (0.38) 0.43 (0.43) 0.38 (0.35) 294 (294)
weighted avg 0.62 (0.44) 48 (0.49) 0.41 (0.40) 294 (294)
Figure 5: Confusion Matrix for 3 layers Convolutional Neu-
ral Network model.
Last but not least, we used cross-validation, with 5
folds, 8 epochs, and 8 batch size, to fine tune the best
CNN model. In Table 5, we can see the metrics of the
second model (three convolutional layers), where we
must note that the accuracy is 56%. During the cross-
validation process, we use a validation set for the final
output, and we can see the results of the training in
Figure 6.
5 PERFORMANCE RESULTS
The results of the training and test procedure are pre-
sented and discussed in this section and we can ob-
serve a collective table of all the scores (Table 6).
Both the k-Nearest Neighbors model yielded 47%
and the Random Forests model yielded 47%, while
Decision Trees performed at just 40%. In general, tra-
Figure 6: Train vs Validation Accuracy of Convolutional
Neural Network model with cross validation.
Table 5: Metrics for CNN results.
precision recall f1 score support
class 0 0.54 0.81 0.65 131
class 1 0.51 0.28 0.36 64
class 2 0.63 0.40 0.49 99
accuracy 0.56 294
macro avg 0.56 0.50 0.50 294
weighted avg 0.57 0.56 0.5 294
ditional machine learning models performed poorly in
image classification.
This is expected, because their architecture is pri-
marily designed to accommodate structured data and
they are not well-suited for image classification. Es-
pecially RGB images that have lot of dimensions; for
instance, a 268x268x3 image includes 3 channels for
RGB and 71.824 pixels per channel.
On the other hand, the processing of these many
dimensions is not challenging using CNN. These
models are predominantly employed for image clas-
sification, where they have the advantage of automat-
ically detecting essential traits without the need for
human intervention.
These results show that Raven IQ tests can be
custom labeled and classified, regarding their pattern
type, with a fair efficiency, given the size of our data
set.
6 DISCUSSIONS AND FUTURE
WORK
In this study, we propose a number of Machine Learn-
ing models that learn to classify Raven IQ tests on
custom-made labels based on their pattern types. In
particular, we constructed a data collection containing
pictures of multiple Raven IQ progressive patterns of
various types.
The next step was to build the data set’s labels,
which included not only the pattern’s orientation, but
also the process, its value, and its kind. These identi-
fiers refer to the pattern’s variation in qualities as well
as its changes from one figure to the next.
Following that, we built and trained traditional
machine learning models such as KNN, decision trees
and Random Forest. We also constructed two dif-
ferent Convolutional Neural Networks (CNN) models
that attempt to classify images. All the models were
trained to distinguish the patterns kind.
The results suggest that the CNN technique has
an advantage over traditional models in terms of accu-
racy. This was to be expected, given that these models
are designed for picture identification and feature ex-
traction. We conclude that the CNN models learned
to classify the tests with reasonable accuracy, but they
still struggle to recognize more intricate information.
ICPRAM 2023 - 12th International Conference on Pattern Recognition Applications and Methods
722

Table 6: Collective results of the models.
Model Accuracy (test) Comments
Random Forest 47 % max depth =15
K-Nearest Neighbours 47 % K = 3
K-Nearest Neighbours 46 % K = 1
Decision Tree 40 % max depth =15
CNN (2 Conv) Weighted 52 % Batch Size = 8, Learning Rate 0.0007, Epochs 10
CNN (2 Conv) Weighted 54 % Batch Size = 8, Learning Rate 0.001, Epochs 6
CNN (2 Conv) 50% Batch Size = 4, Learning Rate 0.001, Epochs 10
CNN (2 Conv) 54 % Batch Size = 4, Learning Rate 0.001, Epochs 7
CNN (3 Conv) 57 % Batch Size = 8, Learning Rate 0.0004, Epochs 7
The nature and quantity of the data set’s images
precluded further investigation and more detailed re-
sults. Despite the fact that we have demonstrated that
Neural Network models can indeed identify hidden
patterns with some decent accuracy.
Our solution and proposed labels can be set to be
a way for classifying Raven IQ matrices in a more au-
tomated way. This suggests that models such as Gen-
erative Adversarial Neural Networks (GANs) may be
able to generate new and distinct IQ tests and patterns,
based on such patterns.
The lack of labeled data set with more examples
and pictures is a drawback since it did not allow us
to make our models more efficient. There is also the
limitation that similar data sets may have different
kinds of images or tests format, something that may
be solved by using feature extraction techniques.
Future research will include larger and more ex-
tensive data collection, more detailed labels, and more
complex Neural Network models for classifying IQ
tests and patterns. Finally, using Generative Adver-
sarial Neural Networks, we will be able to test the
hypothesis of developing new IQ tests using cutting-
edge models.
ACKNOWLEDGEMENTS
We would like to thank Kejsi Rrasa for their help, and
support and for reviewing this paper before submit-
ting it.
REFERENCES
MNIST handwritten digit database, Yann LeCun, Corinna
Cortes and Chris Burges.
Barr, A. and Feigenbaum, E. A. (1981). The Handbook
of Artificial Intelligence. HeurisTech Press, Stanford,
CA. Open Library ID: OL4113500M.
Barrett, D., Hill, F., Santoro, A., Morcos, A., and Lillicrap,
T. (2018a). Measuring abstract reasoning in neural
networks. In Dy, J. and Krause, A., editors, Pro-
ceedings of the 35th International Conference on Ma-
chine Learning, volume 80 of Proceedings of Machine
Learning Research, pages 511–520. PMLR.
Barrett, D., Hill, F., Santoro, A., Morcos, A., and Lill-
icrap, T. (2018b). Measuring abstract reasoning in
neural networks. In Proceedings of the 35th Interna-
tional Conference on Machine Learning, pages 511–
520. PMLR. ISSN: 2640-3498.
Bulgarevich, D. S., Tsukamoto, S., Kasuya, T., Demura,
M., and Watanabe, M. (2018). Pattern recognition
with machine learning on optical microscopy images
of typical metallurgical microstructures. Scientific Re-
ports, 8(1):2078.
Cutler, A., Cutler, D. R., and Stevens, J. R. (2012). Random
Forests. In Zhang, C. and Ma, Y., editors, Ensemble
Machine Learning: Methods and Applications, pages
157–175. Springer US, Boston, MA.
Dongare, A. D., Kharde, R. R., and Kachare, A. D. (2012).
Introduction to Artificial Neural Network. 2(1):6.
Gardner, M. (2005). The Colossal Book of Short Puzzles
and Problems. W. W. Norton & Company, New York.
Heim, A. W. (1970). Intelligence and Personality: Their As-
sessment and Relationship. Penguin. Google-Books-
ID: HlEzAAAAMAAJ.
Hern
´
andez-Orallo, J., Mart
´
ınez-Plumed, F., Schmid, U.,
Siebers, M., and Dowe, D. L. (2016). Computer mod-
els solving intelligence test problems: Progress and
implications. Artificial Intelligence, 230:74–107.
Hubel, D. H. and Wiesel, T. N. (1962). Receptive fields,
binocular interaction and functional architecture in
the cat’s visual cortex. The Journal of Physiology,
160(1):106–154.2.
John and Raven, J. (2003). Raven Progressive Matrices. In
McCallum, R. S., editor, Handbook of Nonverbal As-
sessment, pages 223–237. Springer US, Boston, MA.
Krizhevsky, A. (2009). Learning Multiple Layers of Fea-
tures from Tiny Images.
Małki
´
nski, M. and Ma
´
ndziuk, J. (2022). Deep Learning
Methods for Abstract Visual Reasoning: A Survey on
Raven’s Progressive Matrices. arXiv:2201.12382 [cs].
Ma
´
ndziuk, J. and
˙
Zychowski, A. (2019). Deepiq: A human-
inspired ai system for solving iq test problems. pages
1–8.
Stern, W. (1949). The Intelligence Quotient. In Readings
Classifying Intelligence Tests Patterns Using Machine Learning Methods
723

in general psychology, pages 338–341. Prentice-Hall,
Inc, New York, NY, US.
Zhang, C., Gao, F., Jia, B., Zhu, Y., and Zhu, S. (2019).
RAVEN: A dataset for relational and analogical visual
reasoning. CoRR, abs/1903.02741.
ICPRAM 2023 - 12th International Conference on Pattern Recognition Applications and Methods
724
