
Deep Learning Semantic Segmentation Models for Detecting the Tree
Crown Foliage
Danilo Samuel Jodas
1,2 a
, Giuliana Del Nero Velasco
2 b
, Reinaldo Araujo de Lima
2 c
,
Aline Ribeiro Machado
2 d
and Jo
˜
ao Paulo Papa
1 e
1
Department of Computing, S
˜
ao Paulo State University, Bauru, Brazil
2
Institute For Technological Research, University of S
˜
ao Paulo, S
˜
ao Paulo, Brazil
Keywords:
Urban Forest, Tree Surveillance, Tree Crown Segmentation, Machine Learning, Image Processing.
Abstract:
Urban tree monitoring yields significant benefits to the environment and human society. Several aspects are
essential to ensure the good condition of the trees and eventually predict their mortality or the risk of falling. So
far, the most common strategy relies on the tree’s physical measures acquired from fieldwork analysis, which
includes its height, diameter of the trunk, and metrics from the crown for a first glance condition analysis.
The canopy of the tree is essential for predicting the resistance to extreme climatic conditions. However, the
manual process is laborious considering the massive number of trees in the urban environment. Therefore,
computer-aided methods are desirable to provide forestry managers with a rapid estimation of the tree foliage
covering. This paper proposes a deep learning semantic segmentation strategy to detect the tree crown foliage
in images acquired from the street-view perspective. The proposed approach employs several improvements
to the well-known U-Net architecture in order to increase the prediction accuracy and reduce the network
size. Compared to several vegetation indices found in the literature, the proposed model achieved competitive
results considering the overlapping with the reference annotations.
1 INTRODUCTION
Emerging technologies are attracting interest for de-
ployment in sustainable cities and promoting solu-
tions to reduce the effect of climatic changes. In re-
cent years, computer-aided methods have raised at-
tention and massively studied to cope with many tasks
in several application domains. In the context of ur-
ban forest surveillance, there is an urge for innova-
tive methods that support the assessment of green area
conservation and the monitoring of tree health condi-
tions. Addressing the tree health condition requires
the measurement of several physical aspects that sup-
port the appraisal of the structural and biomechanical
analysis for predicting the risk of falling and trunk and
branch breakage in adverse conditions.
Artificial intelligence is nowadays the state of the
art that supports solving many problems in several
a
https://orcid.org/0000-0002-0370-1211
b
https://orcid.org/0000-0002-7316-196X
c
https://orcid.org/0000-0002-0193-2518
d
https://orcid.org/0000-0003-4239-4274
e
https://orcid.org/0000-0002-6494-7514
research topics and domains of application. More
specifically, we can mention the machine learn-
ing models as the standard approach that helped
break down the obstacles to optimizing many ex-
isting legacy processes. In forestry management,
particularly in the urban forest and tree analysis,
the baseline approaches include urban forest qual-
ity (de Lima Ara
´
ujo et al., 2021), tree detection and
segmentation (Jodas et al., 2022b; Lumnitz et al.,
2021), and tree species classification (Liu, 2022;
Cetin and Yastikli, 2022; Jodas et al., 2022a). Most
studies in the literature proposed using remote sens-
ing and aerial pictures either in detection or clas-
sification tasks. However, images from the ground
perspective are raising attention since the advent of
the Google street-view and the advances in handheld
camera technologies that capture images with out-
standing quality. Moreover, the street-view images
provide fine details such as the tree trunk deteriora-
tion, the presence of pathogens, and the total view of
the treetop foliage for structural analysis.
Crown segmentation consists of finding the fo-
liage region of the tree canopy. Along with further
physical measures of the tree, identifying the crown
Jodas, D., Velasco, G., Araujo de Lima, R., Machado, A. and Papa, J.
Deep Learning Semantic Segmentation Models for Detecting the Tree Crown Foliage.
DOI: 10.5220/0011604600003417
In Proceedings of the 18th International Joint Conference on Computer Vision, Imaging and Computer Graphics Theory and Applications (VISIGRAPP 2023) - Volume 4: VISAPP, pages
143-150
ISBN: 978-989-758-634-7; ISSN: 2184-4321
Copyright
c
2023 by SCITEPRESS – Science and Technology Publications, Lda. Under CC license (CC BY-NC-ND 4.0)
143

is essential for analyzing the pressure wielded on the
tree in extreme climatic conditions. Image process-
ing, graph approaches, and vegetation indices have
already been employed to segment the tree canopy
from the aerial perspective (Str
ˆ
ımbu and Str
ˆ
ımbu,
2015; Maschler et al., 2018; Zhou et al., 2020; Mar-
tins et al., 2021; Deluzet et al., 2022; Ho et al., 2022).
However, low lighting conditions may still affect the
proper performance for identifying the tree canopy
when considering traditional image processing meth-
ods. Therefore, more robust procedures are expected
to extract the image features that generalize the seg-
mentation in more complex situations.
In recent years, we have seen the extensive use of
deep learning models in a range of complex applica-
tions. Convolutional Neural Network (CNN) is a deep
learning architecture designed to classify, detect, and
segment objects in images. The latter approach as-
signs a specific class to each pixel of the image, and
it is usually named semantic segmentation in image
analysis. Among the deep learning architectures con-
ceived for semantic segmentation tasks, one can men-
tion the U-Net (Ronneberger et al., 2015) architecture
as the most employed model in several application do-
mains. However, reducing the network size is still
the primary concern in constructing the baseline ar-
chitecture. Moreover, efficient architectures such as
transformers (Khan et al., 2021) and the integration of
attention mechanisms into CNN models (Guo et al.,
2022) have raised interest and attained remarkable re-
sults.
Following the tendency toward developing new
methods for urban forest surveillance, particularly ur-
ban tree analysis, this paper presents an approach for
tree crown segmentation in images captured from the
street-view perspective. The proposed method ex-
tends a previous semantic segmentation architecture
proposed for tree trunk segmentation by integrating
an attention mechanism into the convolutional layers
in order to enhance and stress meaningful regions of
the feature maps (Woo et al., 2018). Moreover, we
propose a novel dataset composed of tree crown im-
ages for image segmentation and benchmarking tasks.
Therefore, the paper provides the following two con-
tributions:
• To propose the use of an attention mechanism in
the convolutional layers of the U-Net architecture
with depthwise convolutions and residual blocks;
• To make available the dataset with images of the
tree crown acquired from the ground-level per-
spective.
The remainder of the paper is structured as fol-
lows: Section 2 describes the proposed model and the
strategy for creating the tree crown masks for the im-
age quality segmentation analysis. Section 3 presents
the dataset and the setup for performing the exper-
iments. Section 4 presents the models’ results and
comparisons with the baseline algorithms. At last,
Section 5 states the research conclusions.
2 PROPOSED APPROACH
This section presents a detailed description of the
model proposed for tree crown segmentation. Further,
we describe the tree crown mask generation for eval-
uating the segmentation quality’s results, which relies
upon the k-Means clustering algorithm and the chro-
maticity color space.
2.1 Semantic Segmentation Model
The proposed method employs the semantic segmen-
tation model reported in our previous work (Jodas
et al., 2021). The first step involves producing a
grayscale image in which the tree foliage region re-
ceives a high grayscale intensity color. For this pur-
pose, we used three variations of the U-Net archi-
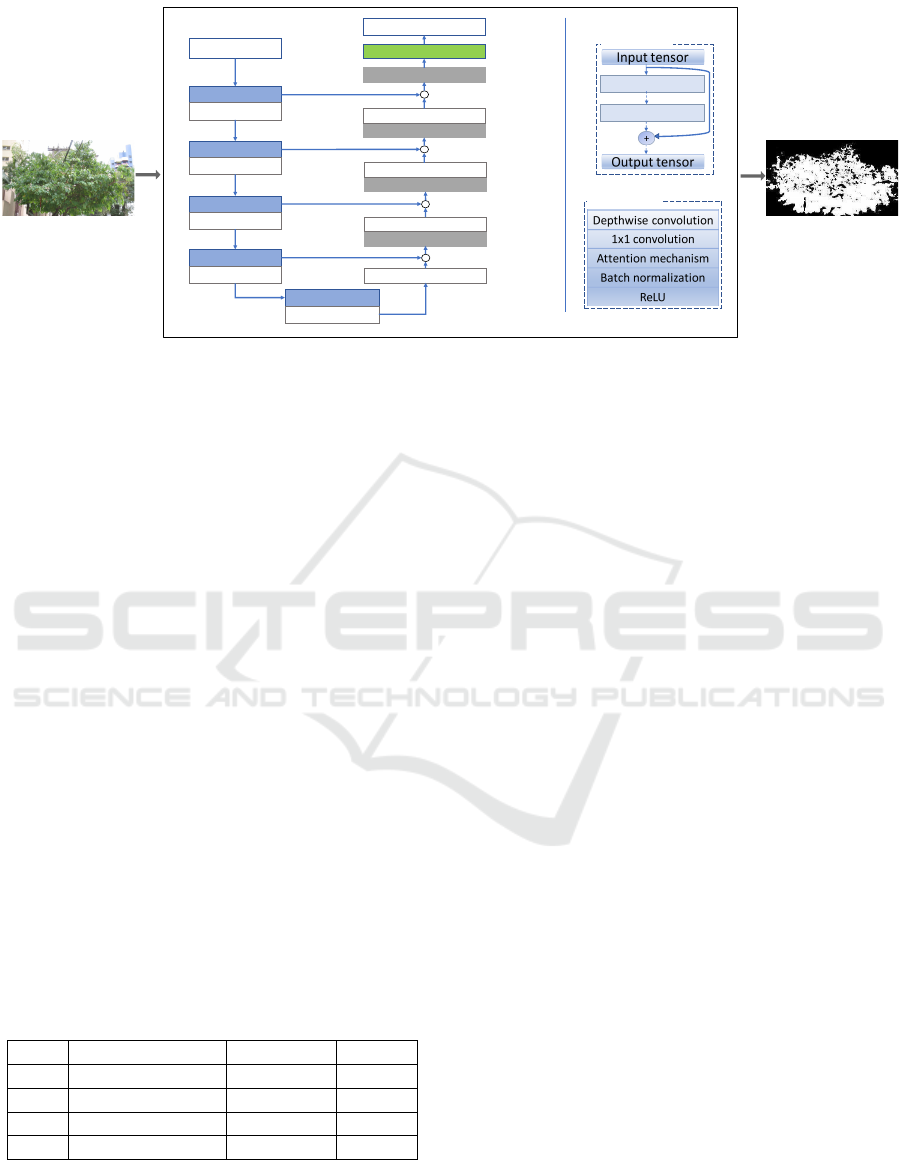
tecture. The pipeline of the crown segmentation ap-
proach is shown in Figure 1. The convolutional block
(Conv. 2D block) performs the feature extraction us-
ing two depthwise blocks. The depthwise block in-
cludes two sequences of depthwise convolution, a 1x1
convolution, an attention mechanism, batch normal-
ization, and the Rectified Linear Unit (ReLU) acti-
vation. We also employed a residual connection be-
tween the input tensor and the output of the second
depthwise block to cope with the gradient vanishing
problem and increase the model’s effectiveness.
Similar to our previous study, the proposed ap-
proach relies on the U-Net deep-learning architecture
to identify the pixels of the tree crown foliage. In the
context of semantic segmentation, the U-Net model
achieved remarkable performance in various image
analysis tasks. Managing the architecture size is also
a research topic for reducing the number of network
parameters and saving memory space to deploy the
model. In this sense, depthwise convolutions (Chol-
let, 2017) arise to cope with the model’s complexity
by using a two-step approach for convolutional oper-
ations. Standard convolutions are the baseline of the
original U-Net architecture. As a result, the network
parameters increase even for a small number of layers.
Therefore, the proposed segmentation approach re-
places the standard convolutions with depthwise con-
volutions on each convolutional layer of the encoding
and the decoding paths.
VISAPP 2023 - 18th International Conference on Computer Vision Theory and Applications
144
Input image
Conv. 2D block
Max Pooling
Conv. 2D block
Max Pooling
Conv. 2D block
Max Pooling
Conv. 2D block
Max Pooling
Conv. 2D block
Dropout
Conv. 2D Transpose
Depthwise block
Conv. 2D Transpose
Depthwise block
Conv. 2D Transpose
Depthwise block
Conv. 2D Transpose
Depthwise block
Single 2D conv.
Output mask
(224,224,3)
(112,112,64)
(56,56,128)
(28,28,256)
(14,14,512)
(14,14,1024)
(28,28,512)
(56,56,256)
(112,112,128)
(224,224,64)
(224,224,1)
Depthwise convolution
1x1 convolution
Batch normalization
ReLU
Depthwise block
Input tensor
Output tensor
Depthwise block
Depthwise block
+
Conv. 2D block
Attention mechanism
2x
.
.
.
.
Figure 1: The proposed approach for the tree crown segmentation.
Convolutional Block Attention Module
(CBAM) (Woo et al., 2018) is an attention mecha-
nism designed for spatial and channel enhancement
through convolutional sequences that produce a
weighted vector with the elements to be stressed in
the feature map. CBAM is made up of two different
modules: the spatial attention module (SAM) and the
channel attention module (CAM). Spatial attention
seeks to find the aspects inside the feature map that
are essential to learning and give more importance.
The method uses the point-wise convolution over a
2-channel input tensor derived from the max pooling
and the average pooling applied to the feature map.
Conversely, the channel attention module produces
an output tensor with the channels considered the
most important to learn and improve from the input
feature map. The final result stands for a refined
feature map comprising the enhanced features in a
spatial and channel fashion.
The proposed method includes the attention mech-
anism CBAM in each convolutional layer of the en-
coder and decoder paths to achieve a better segmen-
tation result for our previous U-Net architecture with
depthwise convolutions and residual blocks. Table 1
presents the setup of the four distinct U-Net models
proposed to segment the region of the treetop foliage.
Table 1: Proposed U-Net variants.
ID Depthwise block Res. block CBAM
UN
1
UN
2
X
UN
3
X X
UN
4
X X X
The first model (UN
1
in Table 1) stands for the
baseline U-Net architecture as proposed by Ron-
neberger et al. (2015). The second version (UN
2
in
Table 1) is based on the study of Gadosey et al.
(2020), which proposed using depthwise convolutions
in each layer of the encoder and decoder paths. The
third model (UN
3
in Table 1) follows the same archi-
tecture proposed in Jodas et al. (2021), which includes
a residual connection between the input tensor and the
feature maps resulting from convolutional operations
(see the Conv. 2D block in Figure 1). Finally, UN
4
incorporates the attention mechanism after the depth-
wise and the point-wise convolutions (see the depth-
wise block in Figure 1).
Since the output of each model relies on the sig-
moid activation function, the segmentation results are
further refined to yield the binary image with the final
treetop foliage mask. Let I be the output image the
semantic segmentation models provide, where I(x, y)
stands for the grayscale intensity ranging from 0 to
1 at the (x, y) coordinates. The binary image is pro-
duced according to the following equation:
I(x, y) =
(
1, if I(x, y) ≥ t
0, otherwise
(1)
where t = 0.5 is the threshold value.
2.2 Segmentation Quality Evaluation
Regarding the image segmentation quality assess-
ment, the proposed methodology used a k-means
clustering-based approach to producing binary masks
where the white color represents the treetop fo-
liage (Xu and Wunsch, 2005). This automatic pro-
cedure has been employed to avoid the laborious and
time-consuming task of the fully manual delineation
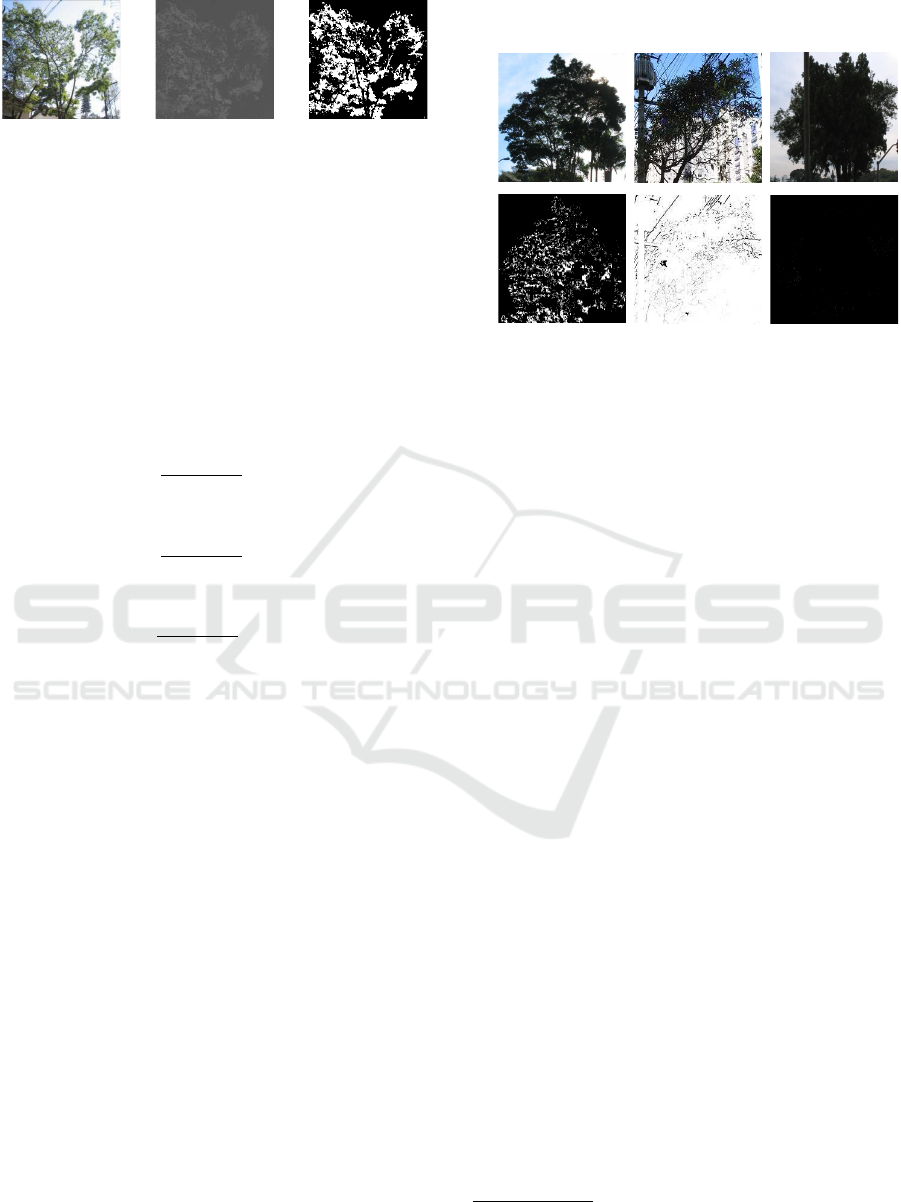
in the images. Figure 2 depicts the process for gener-
ating the binary image.
The proposed approach consists of grouping the
image pixels associated with the g channel of the nor-
Deep Learning Semantic Segmentation Models for Detecting the Tree Crown Foliage
145
(a) (b) (c)
Figure 2: Illustration of the process to produce the binary
mask of the tree crown foliage using the k-means clustering
algorithm: a) input image; b) g channel of the normalized
RGB space; c) binary mask of the tree crown foliage de-
picted in white.
malized Red-Green-Blue (RGB) space, often called
rg chromaticity model (Loesdau et al., 2017). Chro-
maticity is the quality of the color information defined
by the image’s hue and saturation components. The
rg chromaticity model, or normalized RGB space, is
determined using the colors’ proportions in the RGB
color space according to the following equations:
r =
R
R + G + B
,
g =
G
R + G + B
, and
b =
B
R + G + B
(2)
As defined by Equation 2, r, g, and b are scaled
between 0 and 1 according to the balance of the
RGB colors in the image. Vegetation regions pro-
duce higher values for g and low values for the r and
b components of the rg chromaticity space. Treetop
regions are primarily formed by green color intensi-
ties in the normalized RGB color space. In this sense,
increasing the value of g is the expected behavior in
the regions of the treetop foliage. At the same time,
the intensity values of the other chromatic features,
i.e., the r and b components, are reduced in the same
treetop region. Therefore, the proposed approach es-
tablishes two groups of grayscale intensity for the k-
means clustering algorithm (k = 2): the first group is
composed of the tree crown color intensity; the sec-
ond group stands for pixels of the background ele-
ments - buildings and electrical wiring, for example.
Mask generation may still be impacted by lighting
changes, buildings, and other structures with treetop-
like colors. Moreover, due to the random centers’
initialization, k-means may also show different re-
sults after repeated executions. In this sense, all
masks were visually inspected to assess the quality
of the binary images produced by the clustering al-
gorithm. In total, 152 masks considered inadequate
for the tree crown representation were identified and
removed from the image set (Figure 3).
I
II
Figure 3: Images removed due to sketchy crown mask rep-
resentation provided by the clustering algorithm: I) input
images and II) their respective binary masks.
3 METHODOLOGY
This section presents the description of the proposed
dataset and the experimental setup for all experi-
ments.
3.1 Dataset
We used a set of images made up of clippings from the
tree canopy region, whose boundary relies on man-
ual annotations outlined in our previous work (Jodas
et al., 2022b). The original dataset initially comprised
1,325 images. After removing 152 images with inade-
quate representations of the binary masks, the experi-
ments included 1,173 images containing only the area
associated with the treetop (please, refer to the work
of Jodas et al. (2022b) to check the process of the
bounding boxes delineation). The image set is pub-
licly available at the GitHub repository
1
3.2 Experimental Setup
The above-described U-Net architectures have been
designed in Python 3.6 using Tensorflow 2.3.0. Since
no pre-trained weights are provided to fit the proposed
customized architectures, the models were trained
from scratch without using any transfer learning pro-
cedure. The tests were performed using an Nvidia
©
Titan XP GPU with 12 GB of RAM deployed on
a computer equipped with an Intel
©
Xeon processor
and 128 GB of RAM running the Ubuntu 16.04 Linux
operational system.
1
http://github.com/recogna-
lab/datasets/tree/master/TreeCrown
VISAPP 2023 - 18th International Conference on Computer Vision Theory and Applications
146
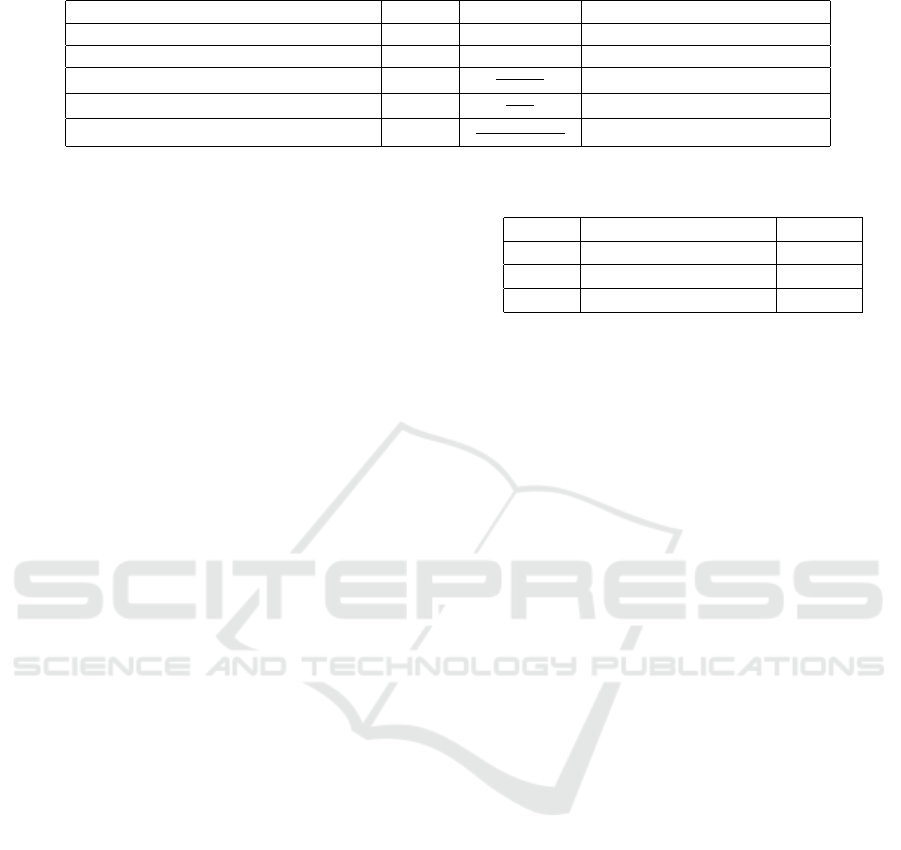
Table 2: Vegetation indices used for comparison.
Name Initials Equation Reference
Excessive Green ExG 2g − r − b Woebbecke et al. (1995)
Excessive Green-Red ExGR ExG − ExR
⋆
Aureliano Netto et al. (2018)
Visual Atmospheric Resistance Index VARI
G−R
G+R−B
Eng et al. (2019)
Normalized Difference Index NDI
G−R
G+R
P
´
erez et al. (2000)
Green Leaf Index GLI
(G−R)+(G−B)
G+R+G+B
Louhaichi et al. (2001)
⋆
ExR=Excess Red, whose equation is 1.4r − g
The image set was split into five blocks for initial
evaluation using the cross-validation method in differ-
ent training and test sets at first glance. Subsequently,
all images were divided into training, validation, and
testing using a proportion of 75%, 15%, and 15%, re-
spectively, to evaluate the models’ effectiveness after
refining the segmentation results.
To evaluate the accuracy of the proposed method-
ology, we compared the results obtained by the pro-
posed segmentation model with five vegetation in-
dices developed specifically for RGB images (Ta-
ble 2). Firstly, vegetation indices seek to highlight
vegetation regions in the input image. Subsequently,
the Otsu threshold generates a binary image from
each vegetation index’s output. The comparative
analysis also considered the SegNet architecture pro-
posed by Badrinarayanan et al. (2017) to assess the
proposed model performance with a widely used ar-
chitecture for image segmentation.
In addition to the binary-cross entropy loss, we
also used two variants of the Dice loss function as
presented in Table 3. Dice loss (Sudre et al., 2017)
was conceived to handle the class imbalance problem
in image segmentation tasks, where the background
pixels are usually more prevalent and easy to classify
than the foreground pixels. However, Dice loss has a
non-convex nature which may lead it to fail in achiev-
ing optimal results (Xin and Sun, 2021; Gamal et al.,
2021). In this sense, the Log-Cosh Dice loss (Jadon,
2020) was proposed to avoid the non-convex nature of
the baseline Dice loss function. The Log-Cosh Dice
conveys the same notion of the Log-Cosh loss used in
regression tasks. It follows a smooth, convex curve
with a continuous and limited range between [-1,1] at
the first-order differentiation. This version of the Dice
loss function is defined as follows:
L = log(cosh(dice
l
)), (3)
where dice
l
is the value provided by the baseline Dice
loss function.
We set 1,000 epochs for training the models with
an early stop criterium to avoid overfitting and extra
computational cost. The early stopping completes the
network’s training after 20 consecutive epochs with
no decrease in the validation loss. Moreover, the
Table 3: Loss functions used in each experiment.
Loss Method
Exp. 1 Log Cosh Dice Loss Adam
Exp. 2 Dice Loss Adam
Exp. 3 Binary Cross-entropy Adam
learning rate was set to 0.0001, and the Adaptive Mo-
mentum Estimation (Adam) (Kingma and Ba, 2014)
was used to optimize the process for the network’s
learning. Finally, the dropout rate of the last encoder’s
convolution layer was set to 0.3.
Finally, the quantitative analysis considered the
Intersection over Union (IoU), Precision, Recall, F1-
score, and Dice coefficient for evaluating the models’
effectiveness.
4 EXPERIMENTAL RESULTS
For a first glance analysis, Table 4 shows the aver-
age Dice coefficients obtained from the five splits of
the cross-validation procedure. The proposed model
shows competitive results compared to the baseline
architectures. The Log Cosh Dice loss function pro-
vided the most accurate result since it attained the
highest average Dice and the lowest standard devi-
ation for the proposed model. Further, the highest
average Dice coefficient obtained from experiments
1 and 3 confirms the efficacy of adding the attention
mechanism to each convolutional block of the U-Net
architecture with residual blocks (UN
4
).
Table 5 shows the average values for the Dice co-
efficient and Intersection over Union obtained from
each experiment in the test set after refining the seg-
mentation results. Notice the superior values ob-
tained by the modified U-Net architecture with at-
tention mechanism (UN
4
) against the U-Net (UN
1
)
and the SegNet architectures. Further, the obtained
results are similar to those provided by the cross-
validation procedure and presented in Table 4. Con-
sidering the three variants of the U-Net architecture,
the proposed model (UN
4
) showed the best average
values when trained with the Log Cosh Dice loss
function (experiment 1), reaching 0.8426±0.0687
and 0.7337±0.0973 of Dice coefficient and Intersec-
Deep Learning Semantic Segmentation Models for Detecting the Tree Crown Foliage
147
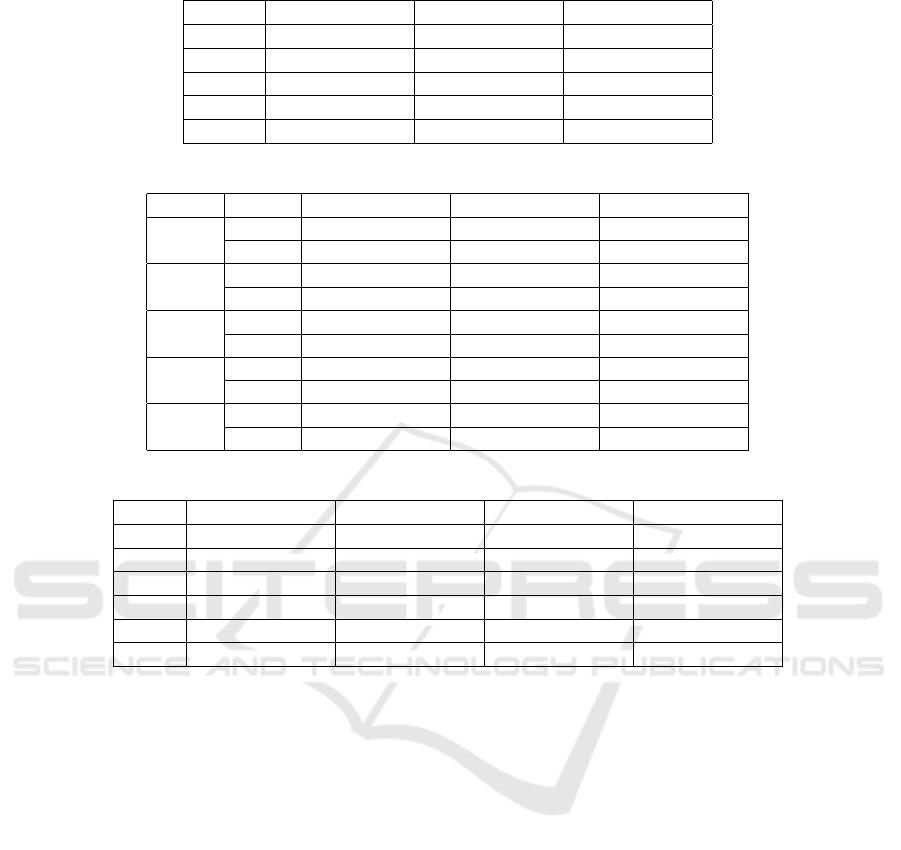
Table 4: Average values for the Dice coefficient obtained from the 5-fold cross-validation.
Exp. 1 Exp. 2 Exp. 3
UN
1
0.8291±0.0112 0.8302±0.0085 0.8220±0.0227
UN
2
0.8124±0.0159 0.8243±0.0090 0.8222±0.0083
UN
3
0.8189±0.0173 0.8238±0.0062 0.8151±0.0233
UN
4
0.8291±0.0085 0.8189±0.0365 0.8289±0.0142
SegNet 0.6249±0.0441 0.6258±0.0461 0.6331±0.0531
Table 5: Average scores obtained after refining the segmentation results.
Metric Exp. 1 Exp. 2 Exp. 3
UN
1
Dice 0.8325±0.0752 0.8250±0.0873 0.8314±0.0784
IoU 0.7197±0.1036 0.7107±0.1151 0.7186±0.1062
UN
2
Dice 0.8096±0.0769 0.8250±0.0771 0.8198±0.0923
IoU 0.6866±0.1005 0.7091±0.1057 0.7042±0.1223
UN
3
Dice 0.8269±0.0674 0.8307±0.0744 0.8126±0.0858
IoU 0.7102±0.0932 0.7171±0.1039 0.6927±0.1153
UN
4
Dice 0.8426±0.0687 0.8323±0.0683 0.8373±0.0693
IoU 0.7337±0.0973 0.7183±0.0947 0.7259±0.0964
Segnet
Dice 0.8062±0.0812 0.8030±0.0782 0.8109±0.0820
IoU 0.6825±0.1061 0.6775±0.1021 0.6895±0.1091
Table 6: Average values attained by the vegetation indices and the best-performing semantic segmentation model.
Precision Recall F1-Score IoU
ExG 0.8706±0.0939 0.7867±0.1032 0.8206±0.0846 0.7036±0.1104
ExGR 0.7792±0.1809 0.8110±0.1067 0.7795±0.1372 0.6558±0.1544
VARI 0.5213±0.2830 0.4575±0.2993 0.4714±0.2833 0.3522±0.2387
NDI 0.5782±0.2395 0.7062±0.2286 0.6111±0.2121 0.4707±0.2035
GLI 0.8561±0.0956 0.8113±0.1066 0.8267±0.0867 0.7129±0.1132
UN
4
0.8127±0.1126 0.8878±0.0596 0.8426±0.0687 0.7337±0.0973
tion over Union, respectively. Moreover, it is worth
mentioning the significant difference against the av-
erage values obtained by the baseline U-Net archi-
tecture (UN
1
), which attained 0.8325±0.0752 and
0.7197±0.1036 of Dice coefficient and Intersection
over Union, respectively. Similar results are also per-
ceptible in experiments 2 and 3, where the proposed
model presented the best accurate results compared to
all the tested variations.
For comparative analysis, Table 6 presents the
average metrics obtained from the vegetation in-
dices presented in Table 2. Compared to the base-
line indices, the Green Leaf Index was the best-
performing method considering the average F1 Score
and Intersection over Union (0.8561±0.0956 and
0.7129±0.1132, respectively). Despite the best pre-
cision compared to UN
4
, one can notice the highest
recall and Intersection over Union attained by the pro-
posed model (0.8878±0.0596 and 0.7337±0.0973,
respectively).
Figure 4 shows segmentation results obtained af-
ter applying the Green Leaf Index and the most
accurate U-Net semantic segmentation models on
the crown images depicted in Figure 3. The best-
performing models are those that received the highest
average F1-Score and Intersection over Union from
the images of the test set, i.e., the baseline U-Net
architecture (UN
1
) and the proposed variant (UN
4
)
from experiment 1. Figure 4c depicts the output from
UN
4
, whose segmentation results cover a significant
part of the tree canopy, even in low lighting condi-
tions.
Finally, Table 7 presents the computational cost
required to predict the images of the test set. More-
over, it shows the network size of each semantic seg-
mentation model. Notice the highest number of pa-
rameters provided by UN
1
and SegNet. Since there
are two blocks for the depthwise convolutions, as well
as the inclusion of residual connections and the at-
tention mechanism in each convolutional block, the
number of parameters increased for the proposed ar-
chitecture, which also reveals an extra time for seg-
mentation. However, UN
4
has 40% of the total base-
line U-net parameters and about 47% of the SegNet
size.
VISAPP 2023 - 18th International Conference on Computer Vision Theory and Applications
148
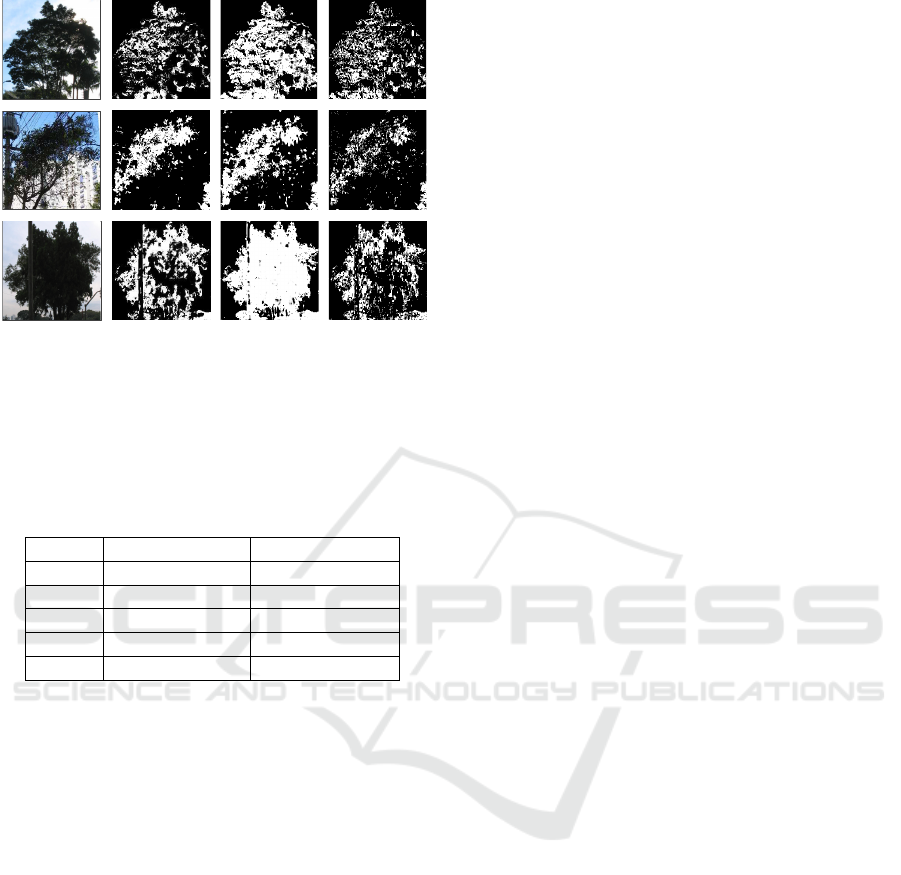
(a)
(b) (c)
(d)
Figure 4: Segmentation results obtained by the best-
performing methods from experiment 1: a) Original image;
b) Segmentation results obtained by UN
1
; c) Segmentation
results obtained by UN
4
; d) Segmentation results obtained
by the Green Leaf Index.
Table 7: Average values for the computational cost and
the number of parameters of each semantic segmentation
model.
# of parameters Average time
UN
1
34,536,897 2.5211±0.0735
UN
2
9,517,919 2.3697±0.0966
UN
3
12,403,679 3.1357±0.1233
UN
4
13,975,139 4.1805±0.4758
Segnet 29,458,949 1.9711±0.1505
5 CONCLUSIONS
As part of the efforts toward contributing to novel ur-
ban tree management research, this study proposed
a CNN-based method for tree crown segmentation
in images acquired from the street-view perspective.
The approach relied upon integrating an attention
mechanism into the convolutional layers of a previous
U-Net architecture employed for tree trunk segmen-
tation. The proposed variant attained the best average
scores against five baseline semantic segmentation ar-
chitectures. Moreover, the network’s parameters were
significantly reduced while achieving competitive re-
sults with the baseline U-Net.
For future studies, we propose increasing the num-
ber of images to improve the model’s accuracy. More-
over, we also intend to consider further comparisons
with fieldwork measures and integrate the proposed
model into a computer-aided method which might as-
sist and expedite the process of the tree structural
analysis.
ACKNOWLEDGEMENTS
The authors are grateful to FAPESP grants
#2013/07375-0, #2014/12236-1, #2019/07665-4,
and #2019/18287-0, and CNPq grant 308529/2021-9.
REFERENCES
Aureliano Netto, A. F., Nogueira Martins, R., Aquino de
Souza, G. S., Ara
´
ujo, G. D. M., Hatum de Almeida,
S. L., and Agnolette Capelini, V. (2018). Segmenta-
tion of RGB Images Using Different Vegetation In-
dices and Thresholding Methods. Nativa, 6(4):389.
Badrinarayanan, V., Kendall, A., and Cipolla, R. (2017).
Segnet: A deep convolutional encoder-decoder ar-
chitecture for image segmentation. IEEE Transac-
tions on Pattern Analysis and Machine Intelligence,
39(12):2481–2495.
Cetin, Z. and Yastikli, N. (2022). The Use of Ma-
chine Learning Algorithms in Urban Tree Species
Classification. ISPRS International Journal of Geo-
Information, 11(4):226.
Chollet, F. (2017). Xception: Deep learning with depthwise
separable convolutions. In Proceedings of the IEEE
conference on computer vision and pattern recogni-
tion, pages 1251–1258.
de Lima Ara
´
ujo, H. C., Martins, F. S., Cortese, T. T. P.,
and Locosselli, G. M. (2021). Artificial intelligence in
urban forestry—A systematic review. Urban Forestry
& Urban Greening, 66:127410.
Deluzet, M., Erudel, T., Briottet, X., Sheeren, D., and Fabre,
S. (2022). Individual Tree Crown Delineation Method
Based on Multi-Criteria Graph Using Geometric and
Spectral Information: Application to Several Temper-
ate Forest Sites. Remote Sensing, 14(5):1083.
Eng, L. S., Ismail, R., Hashim, W., and Baharum, A.
(2019). The use of VARI, GLI, and VIgreen formulas
in detecting vegetation in aerial images. International
Journal of Technology, 10(7):1385–1394.
Gadosey, P. K., Li, Y., Agyekum, E. A., Zhang, T., Liu,
Z., Yamak, P. T., and Essaf, F. (2020). SD-UNET:
Stripping down U-net for segmentation of biomedical
images on platforms with low computational budgets.
Diagnostics, 10(2).
Gamal, A., Bedda, K., Ashraf, N., Ayman, S., AbdAllah,
M., and Rushdi, M. A. (2021). Brain Tumor Seg-
mentation using 3D U-Net with Hyperparameter Op-
timization. In 2021 3rd Novel Intelligent and Leading
Emerging Sciences Conference (NILES), pages 269–
272.
Guo, M.-H., Xu, T.-X., Liu, J.-J., Liu, Z.-N., Jiang, P.-T.,
Mu, T.-J., Zhang, S.-H., Martin, R. R., Cheng, M.-M.,
and Hu, S.-M. (2022). Attention mechanisms in com-
puter vision: A survey. Computational Visual Media,
pages 1–38.
Ho, B., Kocer, B. B., and Kovac, M. (2022). Vision based
crown loss estimation for individual trees with remote
Deep Learning Semantic Segmentation Models for Detecting the Tree Crown Foliage
149

aerial robots. ISPRS Journal of Photogrammetry and
Remote Sensing, 188(October 2021):75–88.
Jadon, S. (2020). A survey of loss functions for semantic
segmentation. In 2020 IEEE Conference on Compu-
tational Intelligence in Bioinformatics and Computa-
tional Biology (CIBCB), pages 1–7. IEEE.
Jodas, D. S., Brazolin, S., Yojo, T., De Lima, R. A., Velasco,
G. D. N., Machado, A. R., and Papa, J. P. (2021). A
Deep Learning-based Approach for Tree Trunk Seg-
mentation. In 2021 34th SIBGRAPI Conference on
Graphics, Patterns and Images (SIBGRAPI), pages
370–377. IEEE.
Jodas, D. S., Passos, L. A., Velasco, G. D. N., Longo, M.
H. C., Machado, A. R., and Papa, J. P. (2022a). Multi-
class Oversampling via Optimum-Path Forest for Tree
Species Classification from Street-view Perspectives.
In To appear in 35th Conference on Graphics, Pat-
terns and Images (SIBGRAPI), pages 1–6. IEEE.
Jodas, D. S., Yojo, T., Brazolin, S., Velasco, G. D. N., and
Papa, J. P. (2022b). Detection of Trees on Street-View
Images Using a Convolutional Neural Network. Inter-
national Journal of Neural Systems, 32(01):2150042.
Khan, S., Naseer, M., Hayat, M., Zamir, S. W., Khan, F. S.,
and Shah, M. (2021). Transformers in vision: A sur-
vey. ACM Computing Surveys (CSUR).
Kingma, D. P. and Ba, J. (2014). Adam: A
method for stochastic optimization. arXiv preprint
arXiv:1412.6980.
Liu, H. (2022). Classification of urban tree species us-
ing multi-features derived from four-season RedEdge-
MX data. Computers and Electronics in Agriculture,
194:106794.
Loesdau, M., Chabrier, S., and Gabillon, A. (2017). Chro-
matic Indices in the Normalized rgb Color Space.
In 2017 International Conference on Digital Image
Computing: Techniques and Applications (DICTA),
pages 1–8.
Louhaichi, M., Borman, M. M., and Johnson, D. E. (2001).
Spatially located platform and aerial photography for
documentation of grazing impacts on wheat. Geocarto
International, 16(1):65–70.
Lumnitz, S., Devisscher, T., Mayaud, J. R., Radic, V.,
Coops, N. C., and Griess, V. C. (2021). Mapping trees
along urban street networks with deep learning and
street-level imagery. ISPRS Journal of Photogramme-
try and Remote Sensing, 175:144–157.
Martins, J., Nogueira, K., Zamboni, P., de Oliveira, P. T. S.,
Gonc¸alves, W. N., dos Santos, J. A., and Marcato, J.
(2021). Segmentation of Tree Canopies in Urban En-
vironments Using Dilated Convolutional Neural Net-
work. In 2021 IEEE International Geoscience and Re-
mote Sensing Symposium IGARSS, pages 6932–6935.
IEEE.
Maschler, J., Atzberger, C., and Immitzer, M. (2018). In-
dividual tree crown segmentation and classification of
13 tree species using airborne hyperspectral data. Re-
mote Sensing, 10(8):1218.
P
´
erez, A. J., L
´
opez, F., Benlloch, J. V., and Christensen,
S. (2000). Colour and shape analysis techniques for
weed detection in cereal fields. Computers and Elec-
tronics in Agriculture, 25(3):197–212.
Ronneberger, O., Fischer, P., and Brox, T. (2015). U-net:
Convolutional networks for biomedical image seg-
mentation. In International Conference on Medical
image computing and computer-assisted intervention,
pages 234–241. Springer.
Str
ˆ
ımbu, V. F. and Str
ˆ
ımbu, B. M. (2015). A graph-based
segmentation algorithm for tree crown extraction us-
ing airborne LiDAR data. ISPRS Journal of Pho-
togrammetry and Remote Sensing, 104:30–43.
Sudre, C. H., Li, W., Vercauteren, T., Ourselin, S., and
Jorge Cardoso, M. (2017). Generalised Dice Overlap
as a Deep Learning Loss Function for Highly Unbal-
anced Segmentations. In Deep learning in Medical
Image Analysis and Multimodal Learning for Clinical
Decision Support, pages 240–248. Springer.
Woebbecke, D. M., Meyer, G. E., Von Bargen, K., and
Mortensen, D. A. (1995). Color indices for weed iden-
tification under various soil, residue, and lighting con-
ditions. Transactions of the American Society of Agri-
cultural Engineers, 38(1):259–269.
Woo, S., Park, J., Lee, J.-Y., and Kweon, I. S. (2018).
CBAM: Convolutional Block Attention Module. In
Proceedings of the European Conference on Com-
puter Vision (ECCV), pages 3–19.
Xin, J. and Sun, G. (2021). Learn from Each Other: Com-
parison and Fusion for Medical Segmentation Loss. In
2021 7th International Conference on Computer and
Communications (ICCC), pages 662–666.
Xu, R. and Wunsch, D. (2005). Survey of clustering al-
gorithms. IEEE Transactions on Neural Networks,
16(3):645–678.
Zhou, Y., Wang, L., Jiang, K., Xue, L., An, F., Chen, B.,
and Yun, T. (2020). Individual tree crown segmenta-
tion based on aerial image using superpixel and topo-
logical features. Journal of Applied Remote Sensing,
14(2):022210.
VISAPP 2023 - 18th International Conference on Computer Vision Theory and Applications
150
