
Multi-Wavelength High-Resolution Fourier Ptychographic Microscopy
Using a Hemispherical LED Array
Mahdieh Gholami Mayani
1 a
, Nazabat Hussain
1
, Kim Robert Tekseth
2
, Dag Werner Breiby
1,2
and Muhammad Nadeem Akram
1
1
Department of Microsystems, University of South-Eastern Norway (USN), Norway
2
Department of Physics, Norwegian University of Science and Technology (NTNU), Norway
Keywords:
Fourier Ptychographic Microscopy, High Resolution, High Synthetic Numerical Aperture, Dome LED Array.
Abstract:
Fourier Ptychographic microscopy has been proven to both increase the resolution of optical microscopes and
retrieve the phase of objects using angular-varied illumination while maintaining a wide field-of-view. This
work focuses on an improvement in the achieved half-pitch resolution, experimentally from 274 nm to 217 nm,
by decreasing the operating wavelength from 630 nm to 470 nm. A high synthesized numerical aperture of
1.1 is obtained using 217 LEDs on a dome illuminator where the light is collected by a 10x/ 0.28NA objective
lens. The experimental results closely match the theoretical prediction. As practical examples, two cartilage
samples are analyzed and quantitatively imaged in this study.
1 INTRODUCTION
Providing wide field-of-view (FOV) and high reso-
lution (HR) microscopy images is required for the
statistical analysis of a huge number of biological
cells simultaneously (Rimon and Schuldiner, 2011).
Conventional microscopes suffer from a trade-off be-
tween spatial resolution and FOV. To tackle this prob-
lem, many efforts have been made such as mechani-
cal scanning (Mico et al., 2006), and synthetic aper-
ture scanning (Tippie et al., 2011). Fourier Ptycho-
graphic Microscopy (FPM) as a powerful imaging
technique starts with capturing low resolution (LR)
images where an array of light-emitting diode (LED)
provides angular-varying partially coherent illumina-
tion (assumed as a coherent source) on the sample and
a sequence of LR images are captured by a digital
camera (Zheng et al., 2013), and (Zheng, 2016). The
light coming from the sample is collected using a low
numerical aperture (NA) objective lens which bene-
fits from an inherent wide FOV. FPM then stitches the
LR images together in Fourier space to achieve a high
resolution (HR) image.
Optical aberrations, short depth of field, and no
phase information from the sample of interest are
shortcomings of current microscopes. FPM as a
promising method can retrieve the unknown phase
a
https://orcid.org/0000-0002-4301-5734
of the imaged complex sample and digitally correct
the existing aberration of the optical system. Two
main parameters are involved to increase the micro-
scopic resolved power and recovery efficiency: the
operating wavelength λ and the NA. The FPM synthe-
sized NA is described as NA
synth
= NA
illum
+ NA
ob j
where NA
ob j
is the fixed NA of the objective lens
and NA
illum
is the illumination NA. Using a planar
LED board for illumination effectively limits NA
illum
to less than about 0.5. Indeed, by increasing the inci-
dent angle, the signal-to-noise (SNR) ratio decreases
and the dark field images contain more noise (Phillips
et al., 2015). As such, a planar x − y LED board
with constant spacing between LEDs is not the op-
timum choice (Zheng et al., 2013). To break the
mentioned constraints of commercially available pla-
nar LED boards, the dome geometry has been sug-
gested which allows for sufficient SNR and higher
NA with fewer LEDs, contributing to faster image ac-
quisition and post-processing. Dome (Phillips et al.,
2015), (Pan et al., 2018) and quasi-dome shaped
LED array (Phillips et al., 2017), (Eckert et al.,
2018), (Mayani et al., 2022b) configurations have
been used. LEDs installed in a dome have much lower
power falloff for off-axis LEDs as compared to planar
board (Pan et al., 2018).
In the present study, a home-built hemispheri-
cal LED dome with 9 rings and 217 LEDs, yield-
Mayani, M., Hussain, N., Tekseth, K., Breiby, D. and Akram, M.
Multi-Wavelength High-Resolution Fourier Ptychographic Microscopy Using a Hemispherical LED Array.
DOI: 10.5220/0011594100003408
In Proceedings of the 11th International Conference on Photonics, Optics and Laser Technology (PHOTOPTICS 2023), pages 17-20
ISBN: 978-989-758-632-3; ISSN: 2184-4364
Copyright
c
2023 by SCITEPRESS – Science and Technology Publications, Lda. Under CC license (CC BY-NC-ND 4.0)
17
ing NA
illum
= 0.82, has been made and integrated
with FPM. We investigated three different illuminat-
ing wavelengths in the visible spectrum for FPM re-
covery of a USAF 1951 target, and then highly re-
solved images of two cartilage samples were obtained
with the high NA
synth
. This paper is organized as fol-
lows: Section 2 is devoted to reviewing the theoretical
background of FPM. In section 3, the experimental
results are presented and quantitatively compared. Fi-
nally, the conclusion and suggestions for future work
are provided.
2 FPM THEORETICAL
BACKGROUND
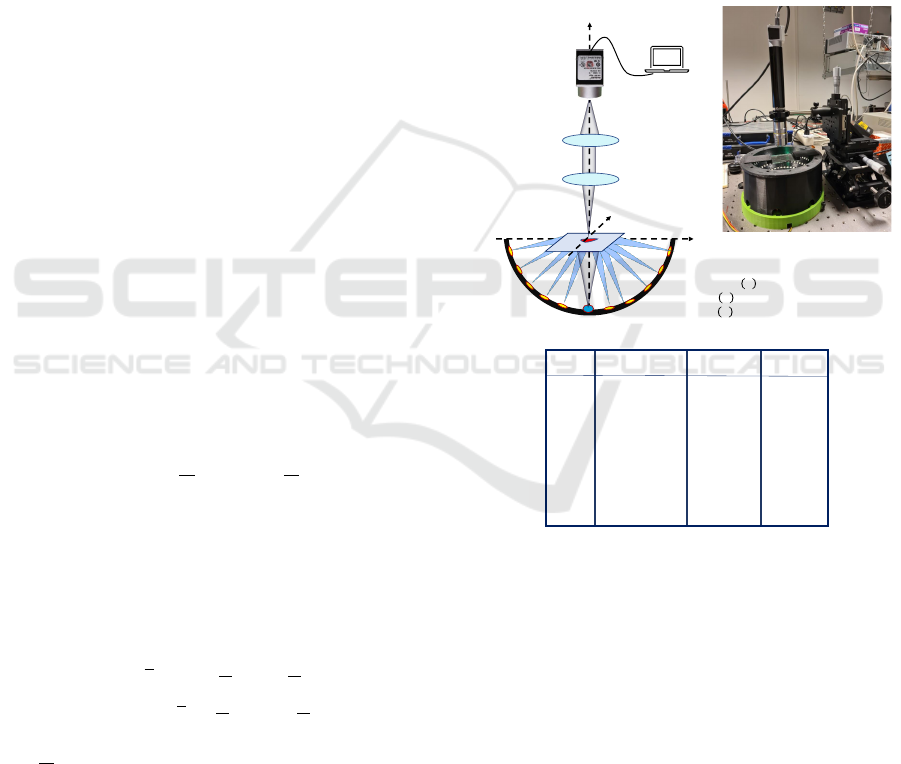
A schematic diagram of our FPM setup with a dome-
shaped LED array is given in Fig.1 (Mayani et al.,
2022b). The dome has been made of polymer us-
ing a 3D printing process and is controlled by a pro-
gramable Arduino board. The LEDs operate with
central wavelength λ (different for red, green, and
blue light) and they are implemented in specific po-
sitions, described by the polar angle θ and azimuthal
angle φ of the spherical coordinate system. Each LED
illumination is assumed to be quasi-monochromatic
and spatially coherent. According to Fourier optics
(Goodman, 2017), illuminating a sample from dif-
ferent angles leads to a shift in the object spatial
frequency spectrum and thereby extends the transfer
function beyond the cut-off frequency of the objec-
tive lens. The incident plane wave propagated from
the n
th
LED interacting with the thin specimen and
having the transmission matrix
¯
O(x,y) can be mod-
eled as
¯
O(x,y)exp( jx
2π
λ
sin(θ
x
), jy
2π
λ
sin(θ
y
)). Here,
k
n
is the oblique illumination from the corresponding
LED and θ
x
and θ
y
are defined as incident angles with
respect to to the x and y axes, respectively (Mayani
et al., 2022a). The optical system with a limited cut-
off frequency can be modeled with a pupil function
P(k
x
,k
y
), in the spatial domain. The imaging can be
described as
I =
FFT
−1
P(k
x
,k
y
)FFT
O(x,y) exp( jx
2π
λ
sin(θ
x
), jy
2π
λ
sin(θ
y
))
2
=
FFT
−1
P(K
x
,K
y
) O(k
x
−
2π
λ
sin(θ
x
),k
y
−
2π
λ
sin(θ
y
))
2
(1)
wherein I represents the captured LR intensity image,
and O(k
x
,k
y
) describes the object spatial spectrum.
To satisfy the Nyquist criterion and avoid aliasing
artifacts, the maximum frequency in the calculated
spectrum is selected to be less than 1/(2δ
x
) (Konda,
2018) where δ
x
is the spatial resolution. It is impor-
tant to keep the pixel size of the LR matrix image be-
low λ/(2 NA
ob j
) and similarly, for the HR matrix im-
age below λ/(4 NA
synth
), thus avoiding possible out-
of-band spurious signals. Accordingly, the maximum
spatial frequency is given by f
max,synth
= NA
synth
/λ.
Here, LEDs can be selected for their operating wave-
length λ. To have an accurate FPM convergence,
the object spectrum overlap between adjacent rings
should be higher than 50% (Liu et al., 2016). LEDs
must therefore be densely positioned in the central
rings of the dome design, while they can be more
sparsely spaced toward the outer rings. This arrange-
ment leads to the necessity of fewer LED numbers as
compared to the planar LED boards and in addition, a
higher SNR is achieved for the dark-field images cap-
tured at larger illumination angles.
PC
Camera
Tube Lens
Objective Lens
Sample
Dome LED array
z
y
x
𝑧 = −𝑟 cos 𝜃
𝑦 = 𝑟 sin 𝜃 sin(𝜑)
𝑥 = 𝑟 sin 𝜃 cos(𝜑)
LEDs/Ring
#Ring
(𝜃
0
)/Ring
1
2
3
4
5
6
7
8
9
1
6
12
18
24
30
36
42
48
0
6
12
18
25
32
40
50
62
NA
𝑖𝑙𝑙𝑢𝑚
0
0.092
0.183
0.273
0.375
0.473
0.579
0.670
0.823
Figure 1: Schematic of the FPM setup. The LED sequences
and NA
synth
of each ring are listed in the provided table.
3 EXPERIMENTAL
DEMONSTRATION: RESULTS
AND COMPARISON
In this section, FPM is demonstrated with LR ex-
perimental images of a USAF 1951 test target (from
Ready Optics), providing a standard resolution mea-
surement. In this experiment, a 10x/ 0.28NA objec-
tive lens collected the light coming from the sample
and a digital camera (Basler acA5472-17um, 5496 ×
3672 pixels count) with 2.4 µm pixel size captured
PHOTOPTICS 2023 - 11th International Conference on Photonics, Optics and Laser Technology
18
the LR intensity images. To illuminate the sample, a
home-built dome LED array was used wherein each
LED (provided by NeoPixel) can work in the visi-
ble spectrum with the central wavelength λ ranging
from 630 nm for the red light to 470 nm for blue
light. According to the half-pitch resolution, defined
as λ/(2 NA
synth
), the resolution is expected to increase
when decreasing the illuminating wavelength. FPM
setup reached a high NA
synth
= 1.1 using the dome-
shaped LED array. To reconstruct a HR image, a cen-
tral patch of 512 × 512 pixels was selected on the
LR images and the HR up-scaling ratio was set to 4.
The theoretical half-pitch resolution is expected to in-
crease from 283 nm to 211 nm when the illumination
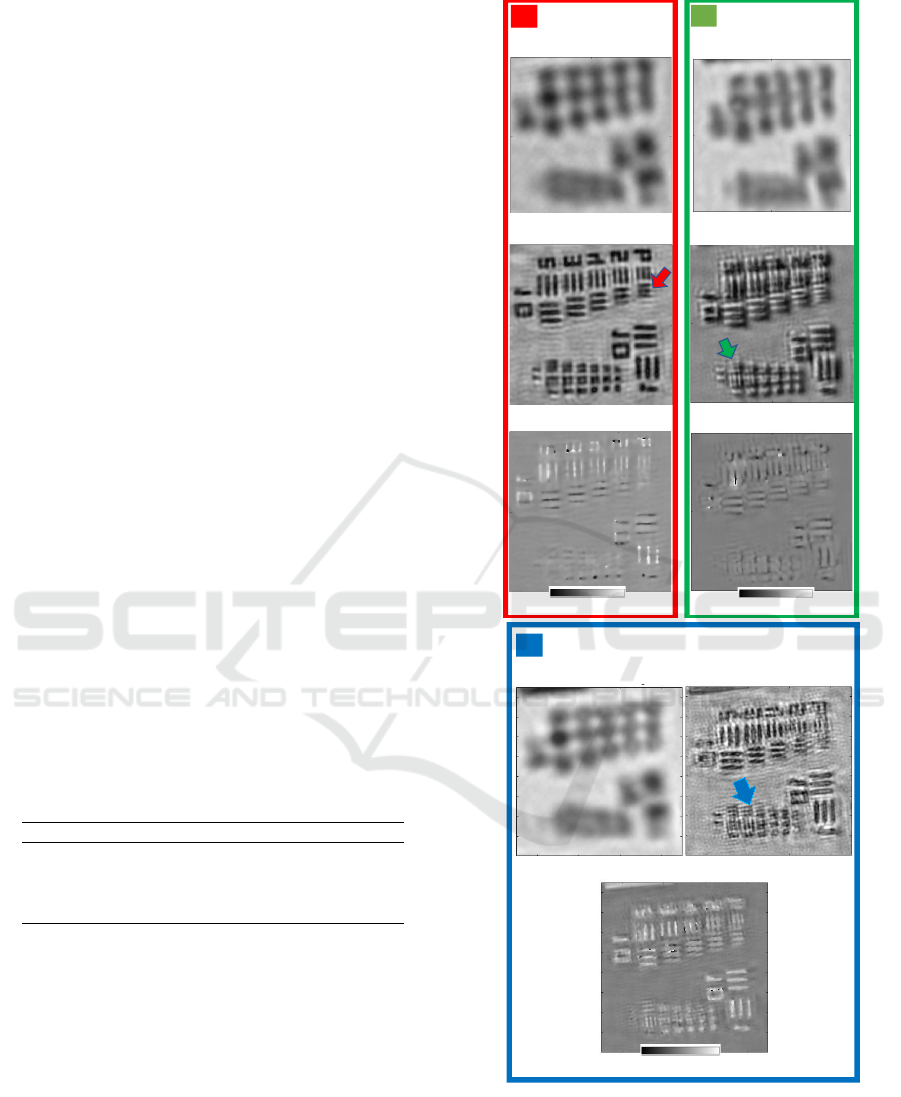
wavelength is changed from 630 nm to 470 nm. Fig. 2
shows a comparison between the recovered FPM HR
complex-valued images. The cut-off frequency of the
optical system is obtained slightly above the USAF
target, group 10 element 6 with the standard resolu-
tion of 274 nm for the red color, and group 11 ele-
ment 1 with the resolution of 244 nm for the green.
For blue light, group 11 element 2 was successfully
resolved, illustrating the resolution of 217 nm. The
results are summarized in Table 1 and the recovered
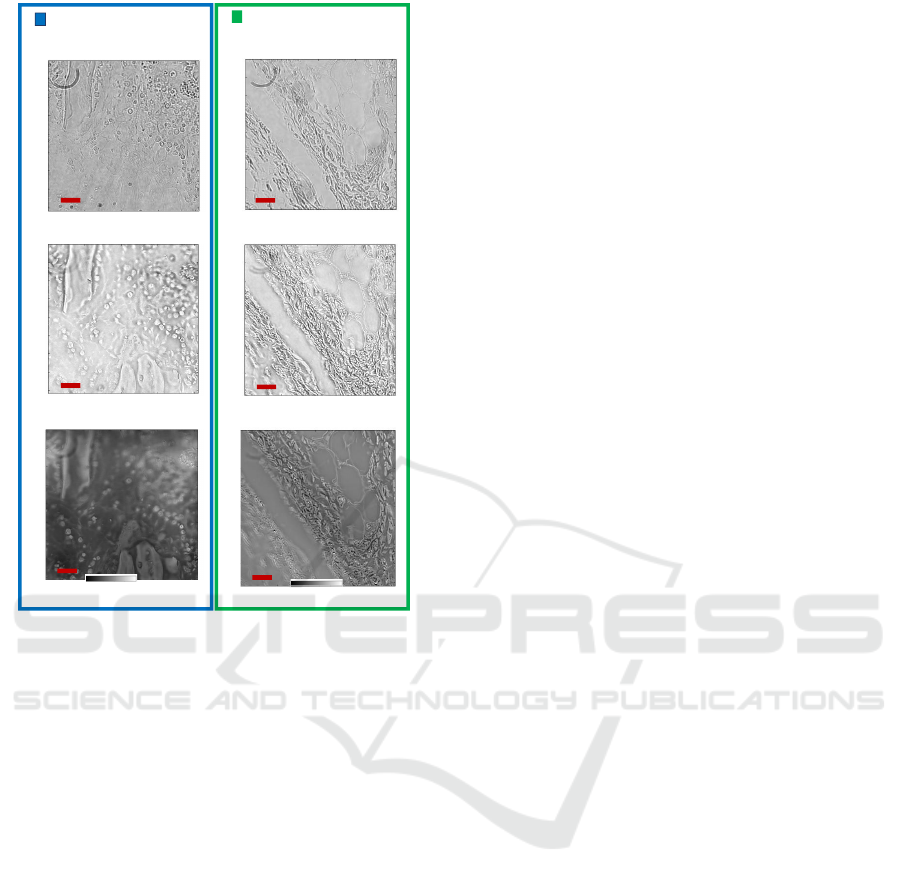
HR images are shown in Fig. 2. To practically demon-
strate the performance of our FPM, two histological
cartilage samples were studied, presented in Fig. 3. It
is shown that high frequency details are clearly visible
in the recovered images under the achieved NA
synth
of
1.1. FPM in this study is based on transmission mode;
however, the imaging technique can be extended to
reflection mode.
Table 1: Comparison between theoretical and experimental
resolution with three different operating wavelengths in the
visible spectrum.
λ
illumination
Theoretical res Experimental res
630 nm 283 nm 274 nm
530 nm 238 nm 244 nm
470 nm 211 nm 217 nm
4 CONCLUSIONS
In this paper, Fourier ptychographic microscopy
imaging has been utilized to recover high-resolution
images from a number of low-resolution images
which correspond to angular-varied LED illumina-
tion. A home-built dome-shaped LED array was used
to illuminate the sample, giving a synthetic numeri-
cal aperture (NA
synth
) of 1.1. Three experiments have
been carried out on the USAF test target and a com-
parison between results was demonstrated. There is
an improvement in the resolution of the recovered
λ = 530 nm
λ = 630 nm
LR Image
Recovered Amplitude
Recovered Phase (rad)
LR Image
Recovered Amplitude
Recovered Phase (rad)
-𝜋 +𝜋0
-𝜋 +𝜋0
λ = 430 nm
LR Image
Recovered Amplitude
Recovered Phase (rad)
-𝜋 +𝜋0
Figure 2: FPM recovery for the USAF amplitude test target:
Recovered amplitude, and phase images corresponding to
the red, green, and blue light illuminations. The resolved
USAF elements are indicated by colored arrows.
images from 274 nm to 217 nm when the illuminat-
ing light is changed from wavelength 630 nm to 470
Multi-Wavelength High-Resolution Fourier Ptychographic Microscopy Using a Hemispherical LED Array
19
Low Resolution Image
Recovered Amplitude
Recovered Phase (rad)
λ = 530
nm
λ = 430
nm
Low Resolution Image
Recovered Amplitude
Recovered Phase (rad)
-𝜋
+𝜋
0
-𝜋/3
+𝜋
0
30 µm
30 µm
30 µm
30 µm
30 µm
30 µm
Figure 3: FPM amplitude and phase images of the cartilage
samples obtained with the green and blue LEDs.
nm. There is a good agreement between the measure-
ment and predicted theoretical values. Furthermore,
two histological cartilage samples were examined as
a practical example, showing a very fine details under
the achieved high NA
synth
by dome LED illuminator.
ACKNOWLEDGEMENTS
This work was supported by the Research Coun-
cil of Norway through NANO2021 (project number
272248), and FRIPRO (project number 275182).
REFERENCES
Eckert, R., Phillips, Z. F., and Waller, L. (2018). Efficient
illumination angle self-calibration in fourier ptychog-
raphy. Appl. Opt., 57(19):5434–5442.
Goodman, J. W. (2017). Introduction to Fourier optics.
W.H. Freeman Macmillan Learning, New York, fourth
edition. edition.
Konda, P. C. (2018). Multi-Aperture Fourier Ptychographic
Microscopy: development of a high-speed gigapixel
coherent computational microscope. PhD disserta-
tion, University of Glasgow.
Liu, Q., Kuang, C., Fang, Y., Xiu, P., Li, Y., Wen, R., and
Liu, X. (2016). Effect of spatial spectrum overlap on
fourier ptychographic microscopy. Journal of Innova-
tive Optical Health Sciences, 10.
Mayani, M. G., Breiby, D. W., and Akram, M. N.
(2022a). Polarization-sensitive Fourier ptychography
microscopy using dome-shaped LED illuminator. In
Georges, M. P., Popescu, G., and Verrier, N., editors,
Unconventional Optical Imaging III, volume 12136,
pages 31 – 34. International Society for Optics and
Photonics, SPIE.
Mayani, M. G., Hussain, N., Breiby, D. W., and Akram,
M. N. (Aug 2022b). Improved resolution fourier pty-
chography scheme using oil-filled dome-shaped LED
array. Electronics Letters, n/a(n/a).
Mico, V., Zalevsky, Z., Garc
´
ıa-Mart
´
ınez, P., and Garc
´
ıa, J.
(2006). Synthetic aperture superresolution with mul-
tiple off-axis holograms. Journal of the Optical Soci-
ety of America. A, Optics, image science, and vision,
23:3162.
Pan, A., Zhang, Y., Wen, K., Zhou, M., Min, J., Lei, M.,
and Yao, B. (2018). Subwavelength resolution fourier
ptychography with hemispherical digital condensers.
Opt. Express, 26(18):23119–23131.
Phillips, Z. F., D’Ambrosio, M. V., Tian, L., Rulison,
J. J., Patel, H. S., Sadras, N., Gande, A. V., Switz,
N. A., Fletcher, D. A., and Waller, L. (2015). Multi-
contrast imaging and digital refocusing on a mobile
microscope with a domed led array. PLOS ONE,
10:e0124938.
Phillips, Z. F., Eckert, R., and Waller, L. (2017). Quasi-
Dome: A Self-Calibrated High-NA LED Illuminator
for Fourier Ptychography. Imaging and Applied Op-
tics 2017, page IW4E.5.
Rimon, N. and Schuldiner, M. (2011). Getting the whole
picture: combining throughput with content in mi-
croscopy. Journal of Cell Science, 124(22):3743–
3751.
Tippie, A. E., Kumar, A., and Fienup, J. R. (2011). High-
resolution synthetic-aperture digital holography with
digital phase and pupil correction. Opt. Express,
19(13):12027–12038.
Zheng, G. (2016). Fourier Ptychographic Imaging. 2053-
2571. Morgan and Claypool Publishers.
Zheng, G., Horstmeyer, R., and Yang, C. (2013).
Wide-field, high-resolution Fourier ptychographic mi-
croscopy. Nature Photonics 2013 7:9, 7(9):739–745.
PHOTOPTICS 2023 - 11th International Conference on Photonics, Optics and Laser Technology
20
