
Effects of the Automation Level on Gaze Behavior: A Full Flight
Simulator Campaign with Professional Airline Pilots
M. Mercier
1
, O. Lefrançois
1
, N. Matton
2
and M. Causse
1
1
ISAE-SUPAERO, Toulouse, France
2
ENAC, Toulouse, France
Keywords: Aviation, Eye-Tracking, Automation Complacency, Out-of-the-Loop.
Abstract: High level of automation is associated with higher flying performances, lower workload, but also with a
decreased time spent on important primary flight parameters.
1 INTRODUCTION
Automation in modern cockpits contributed to
improvements in flight safety by reducing pilot
workload, fatigue, or increasing situation awareness
(Lee & Seppelt, 2012). Yet, whereas lack of
automation was problematic in the beginnings of
aviation, growing role of automation now raises new
challenges with experts pointing at risks associated
with an over-reliance of pilots on automatisms. The
first risk associated with use of automatisms is the
loss of situation awareness associated with pilots
being « out-of-the-loop » (Endsley & al., 1995) or
unable to effectively monitor or question automated
systems when required (Mumaw & al., 2001 ;
Parasuraman & al., 1993). Second, when flying with
high levels of automation, pilots may be prone to
over-confidence (Antonovich, 2008) or automation
complacency (Parasuraman & al., 2010) that can
result in an improper monitoring of flight instruments
that would further challenge pilot abilities to take-
over in case of automation failure (Nikolic & Starter,
2007). Improper monitoring has been involved in
80% of major aircraft accidents in the US between
1978-1990 (NTSB, 1994). At last, and in the long run,
over-relying on automatisms may also induce loss of
manual flying skills (Haslbeck & Zhang, 2017). The
objectives of this study were to analyze airline pilots’
gaze behavior when using different levels of
automation. We hypothesized that gaze behavior
would be influenced by the level of automation and
pilot’s role (pilot-flying or pilot-monitoring); that a
low level of automation would be associated to lower
performances, increased workload and an increased
time spent on primary flight parameters; and that
these effects would be more important for pilot-
flying.
2 METHODOLOGY AND
RESULTS
2.1 Participants
Twenty A320 qualified pilots including 10 Captains
and 10 First Officers were recruited to take part in the
experiment. All were males, with a mean age of 42
years for Captains and of 29 years for First Officers,
and with a flight experience of respectively 11500
flying hours (SD = 1300 flying hours) and 3500 flying
hours (SD = 340 flying hours). All were volunteers,
unaware of the purpose of the study, and randomly
assigned to another pilot. The experiment was
approved by the Air France local committee as well
as by the CERNI (Ethics Committee of the University
of Toulouse, France, IRB00011835-2020-03-03-
210).
2.2 Task
All pilots performed three flights, from take-off to
landing (with an Instrument Landing System, ILS) at
Toulouse airport (LFBO, runway 32R), alternatively
as pilot-flying (PF, i.e., the pilot actually flying the
aircraft) and pilot-monitoring (PM). Weather
conditions were standard instrument flying
conditions, with a visibility higher than 550m and a
96
Mercier, M., Lefrançois, O., Matton, N. and Causse, M.
Effects of the Automation Level on Gaze Behavior: A Full Flight Simulator Campaign with Professional Airline Pilots.
DOI: 10.5220/0012127500003622
In Proceedings of the 1st International Conference on Cognitive Aircraft Systems (ICCAS 2022), pages 96-100
ISBN: 978-989-758-657-6
Copyright
c
2023 by SCITEPRESS – Science and Technology Publications, Lda. Under CC license (CC BY-NC-ND 4.0)
15 knots crosswind. The levels of automation
consisted of two systems: Flight Directors (FD) and
Autothrust (A/T). Both are Airbus flight guidance
systems that are designed to assist the pilot in
respectively controlling flight path by providing
attitude guidance and aircraft speed by automatically
adjusting engines thrust.
For each approach, pilots were instructed to
perform the approach in manual flying (i.e., with
autopilot disengaged) but with different levels of
automation. The three following levels of automation
were used:
- Full use of automation: FD ON & A/T ON
- Partial use of automation: FD ON & A/T
OFF
- No use of automation: FD OFF & A/T
OFF
2.3 Apparatus
Experiments were conducted in a certified A320
Thomson full-flight simulator used for flight crew
training. Flight performances data were recorded
during the approach including speed and path
deviation. Gaze data were recorded using two head
mounted Pertech eye-trackers, and five areas-of-
interest (AOI) have been considered: window,
attitude, speed, engine parameters and path deviation
that aggregates heading, lateral deviation scale and
vertical deviation scale. Three basic gaze metrics
were used to characterize pilot’s gaze behavior: the
percent time on AOI, the mean glance duration, and
the glance rate, that respectively reflect pilot’s
attention distribution over the two different AOIs,
effectiveness in information acquisition processes
when visiting that AOI, and frequency of visit of that
AOI (Haslbeck & Zhang, 2017). Subjective
measurements of perceived workload were
performed on each level of automation with the
NASA-TLX Task Load Index (Hart and Staveland,
1988).
3 RESULTS
3.1 Workload and Flight Performance
As expected, a reduction in the level of automation
was associated with a decrease in flight
performances and an increase in subjective pilot
mental workload.
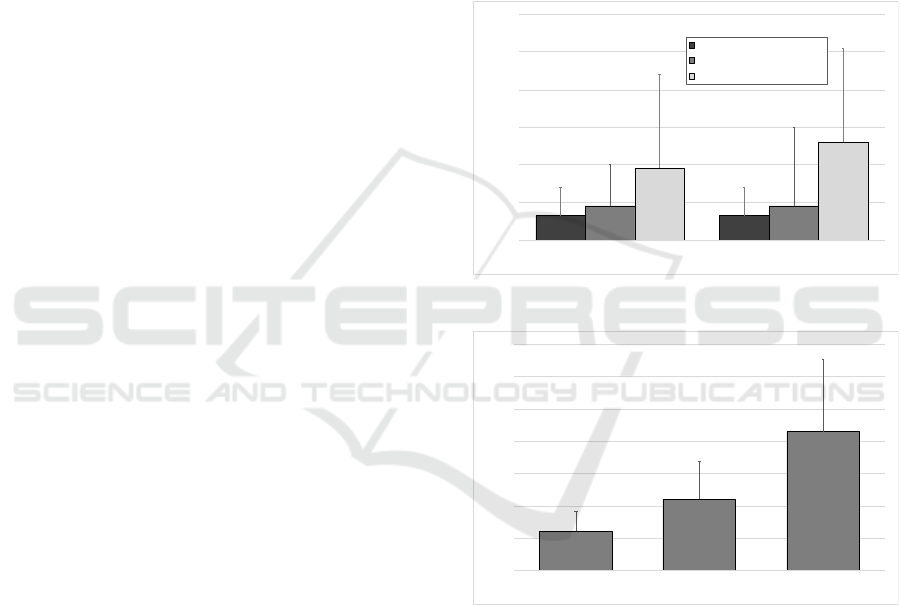
A decrease in performances was indeed observed
in the no-use-of-automation condition (Figure 1),
with significantly higher path deviations when pilots
did not rely on autothrust nor flight directors. In this
condition, 5 pilots out of 20 had to go-around due to
being unstabilized during the approach. An increase
in subjective workload was also observed with each
reduction in level of automation (Figure 2), with a
higher subjective workload in the no-use-of-
automation condition (M = 85.9, SD = 4.5) than in the
partial-use-of-automation condition (M = 44,
SD = 23) (t(8) = 5.66, p < .001), and a higher
subjective workload in the partial-use-of-automation
than in the full-use-of-automation condition (M = 24,
SD = 13) (t(8) = 5.71, p < .001).
Figure 1: Path Deviations per level of automation.
Figure 2: NASA-TLX Score per level of automation.
3.2 Influence of the Level of
Automation on PF and PM
3.2.1 Basic Gaze-Based Metrics
One way (Automation) repeated measures ANOVA
were performed on each AOI for percent time on
AOI, mean glance duration, and glance rate (Figure
3) to compare PF and PM gaze behavior over the three
full-use-of-automation, partial-use-of-automation
and no-use-of-automation conditions.
0,00
0,20
0,40
0,60
0,80
1,00
1,20
Lateral Path Deviation Vertical Path Deviation
MEAN TRAJECTORY DEVIATION
Full use of automation (FD & AT)
Partial use of automation (FD Only)
No use of automation
0
20
40
60
80
100
120
140
Full use of automation
(FD & AT)
Partial use of automation
(FD Only)
No use of automation
NASA-TLX SCORE
Effects of the Automation Level on Gaze Behavior: A Full Flight Simulator Campaign with Professional Airline Pilots
97
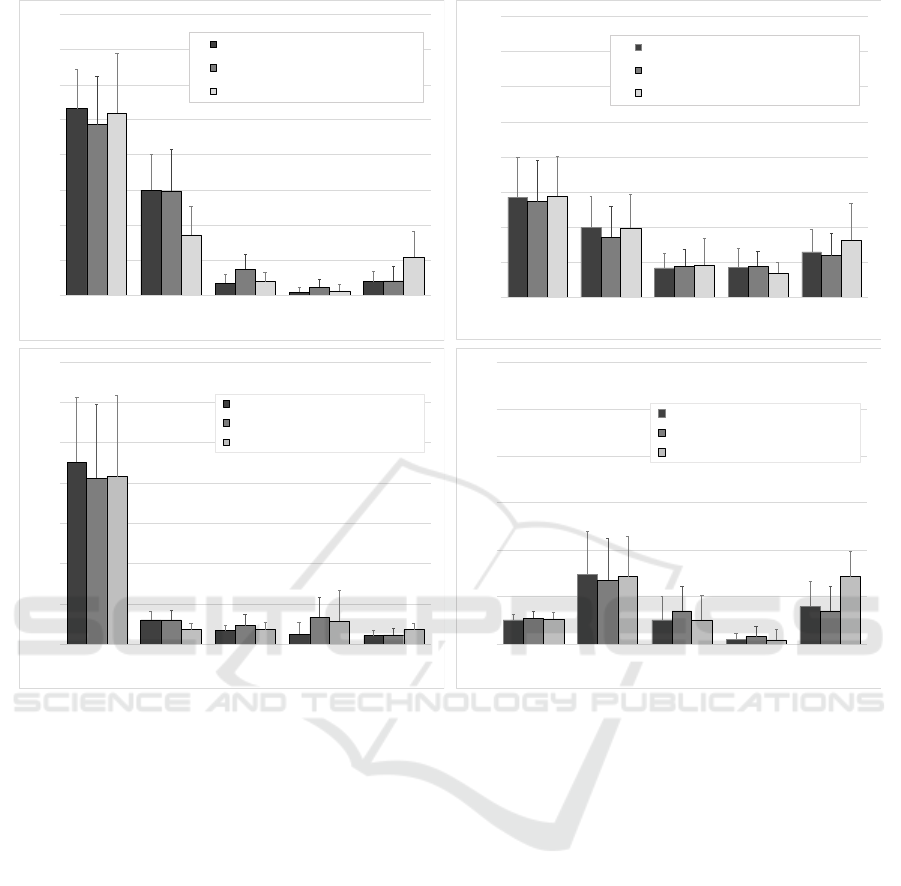
Figure 3: Basic Gaze Metrics per AOI and per level of automation: Percent time on AOIs for PF (top-left) and PM (top-right),
Mean Glance Duration on AOIs for PF (bottom-left) and Glance Rate for AOIs for PF (bottom-right).
A main effect of Automation was observed for PF
on percent time spent on attitude (F(2,38) = 14.7,
p < .001), speed (F(2,38) = 12.2, p < .001), engine
parameters (F(2,38) = 5.45, p = .008), path deviation
(F(2,38) = 12.5, p < .001) ; on attitude
(F(2,38) = 14.7, p < .001), engine parameters
(F(2,38) = 3.34, p < .046), and path deviation
(F(2,38) = 6.09, p = .005) mean glance duration ; and
on engine parameters (F(2,38) = 3.6, p < .037) and
path deviation glance rate (F(2,38) = 5.99, p = .005).
There was no main effect of the level of automation
on any of the PM basic gaze metrics, with PM gaze
behavior being stable throughout the three levels of
automation conditions. Post-hoc comparisons of
Automation on PF basic gaze metrics are hereafter
presented, with only significant main effects
presented in this section (p < .05).
When compared to the full-use-of-automation
condition, the partial-use-of-automation condition
was associated with a significant increase in percent
time spent on speed (t(19) = 4.51, p < .001) and
engine parameters (t(19) = 2.94, p = .022) ; with a
significant increase in engine parameters mean glance
duration (t(19) = 3.28, p = .011) ; and with a
significant increase in engine parameters glance rate
(t(19) = 2.82, p = .028).
When compared to the partial-use-of-automation
condition, the no-use-of-automation condition was
associated with a significant reduction in percent time
spent on attitude (t(19) = 4.15, p = .002) and speed
(t(19) = 3.30, p = .010) and a significant increase in
percent time spent on path deviation (t(19) = 3.27,
p = .011) ; with a significant reduction in attitude
mean glance duration (t(19) = 4.15, p = .002) and a
significant increase in path deviation mean glance
duration ((t(19) = 3.71, p = .004) ; and with a
significant increase in glance rate on engine
parameters (t(19) = 2.78, p = .030) and path deviation
(t(19) = 2.57, p = .047).
When compared to the full-use-of-automation
condition, the no-use-of-automation was associated
with a significant reduction in percent time spent on
0%
10%
20%
30%
40%
50%
60%
70%
80%
Window Attitude Speed Engines Path deviation
PERCENT TIME ON AOI (%)
PF - Full use of automation (FD & AT)
PF - Partial use of aut omation (FD On ly)
PF - No use of automation
0%
10%
20%
30%
40%
50%
60%
70%
80%
Window Attitude Speed Engines Path deviation
PERCENT TIME ON AOI (%)
PM - Full use of automation (FD & AT)
PM - Partial use of automation (FD Only)
PM - No use of automation
0,00
0,50
1,00
1,50
2,00
2,50
3,00
3,50
Window Attitude Speed Engines Path deviation
MEAN GLANCE DURATION (S)
PF - Full use of automation (FD & AT)
PF - Partial use of automation (FD Only)
PF - No use of automation
0,0
0,5
1,0
1,5
2,0
2,5
3,0
Window Attitude Speed Engines Path deviation
GLANCE RATE (HZ)
PF - Full use of automation (FD & AT)
PF - Partial use of automation (FD Only)
PF - No use of automation
ICCAS 2022 - International Conference on Cognitive Aircraft Systems
98
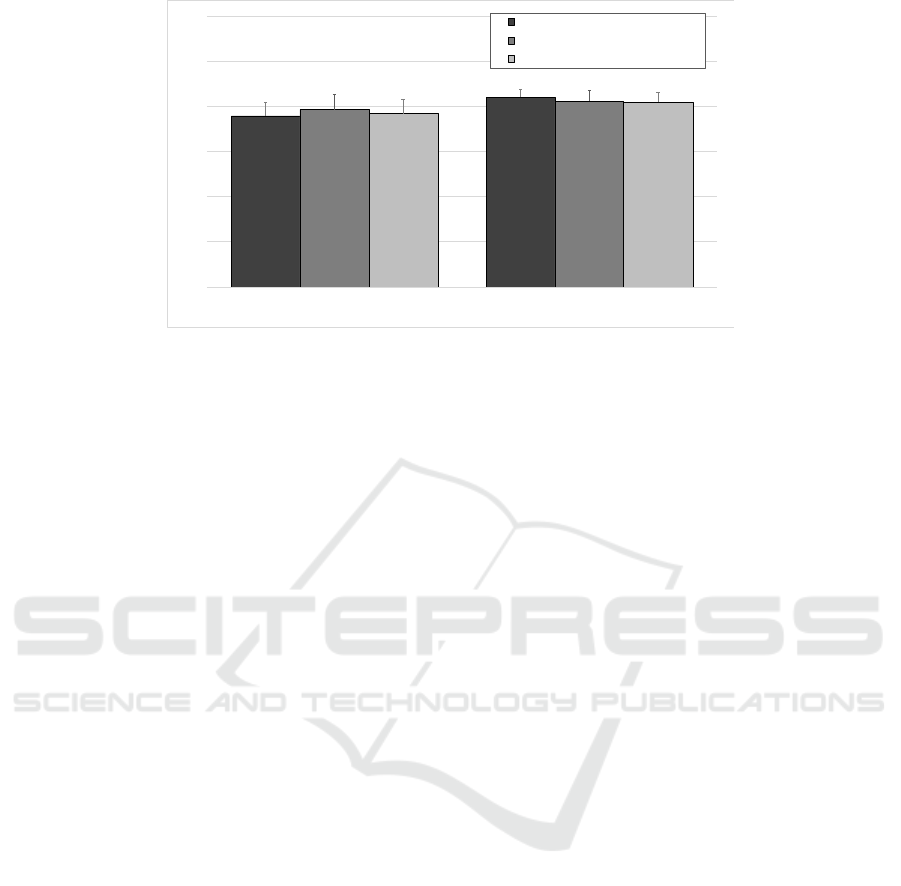
Figure 4: Static Gaze Entropy as a function of pilot’s role and level of automation.
attitude (t(19) = 4,34, p = .001), with a significant
increase in percent time spent on path deviation
(t(19) = 4.60, p < .001) ; with a significant reduction
in attitude mean glance duration (t(19) = 4.34,
p < .001) ; and with a significant increase in glance
rate on engine parameters (t(19) = 3.70, p = .004) and
path deviation (t(19) = 2.76, p = .032).
3.2.2 Gaze Spatial Distribution
We used Static Gaze Entropy (Figure 4) as a measure
of gaze spatial distribution over the different AOIs
and performed a two way (Role x Automation)
repeated measures ANOVA. We found a significant
main effect of pilot’s role (F(1,38) = 17,7, p < .001)
with pilots exhibiting a more distributed gaze
allocation when flying as PM (M = 2,06 bits,
SD = 0,11) than when flying as PF (M = 1,93 bits,
SD = 0,16) (t(89,67) = 6.04, p < .001). We found no
significant main effect of Automation on Static Gaze
Entropy (F(1,76) = 0.75, p = .48). A significant
interaction between Automation and Role
(F(2,76) = 3.17, p = .047) was found.
4 DISCUSSION
In this study, we hypothesized that basic gaze metrics
would be influenced by the level of automation and
by pilots’ role as pilot-flying or pilot-monitoring.
Effect of automation on gaze behavior was
significant for PFs which is consistent with the fact
that the PF is the one actually flying the aircraft.
Higher levels of automation were associated with a
lower perceived workload and better flight path
performances thus emphasizing some beneficial
impacts of automation. The reallocation of gaze
attention to attitude and flight guidance observed in
the highest levels of automation was however at the
expense of a more direct monitoring of the flight
parameters (speed, engines and path deviation) these
automatisms control. Although this shift in attention
is a logical consequence of flying with automation, as
the pilot delegates speed and path deviation to
respectively Flight Directors and Autothrust, it may
reflect a change of reference in pilot’s mental modes
and representations from flight parameters when
flying without automation to flight guidance and
automatisms when flying with automation. Such a
change could make pilots more vulnerable to losses
of situation awareness when flying with automation
or unable to regain situation awareness when facing
unreliable or inconsistent flight guidance. Whether
that behavior is training-induced, training-reversible,
task-induced or a consequence of a lower workload
or automation complacency is open to question and
would justify further eye-tracking based research
work.
We observed that PM gaze behavior in terms of
basic gaze metrics was generally more spatially
distributed over the different AOIs than PFs’.
Interestingly, PM gaze behavior was stable across the
different levels of automation with PMs therefore
maintaining a higher level of direct monitoring of
primary flight parameters in the highest levels of
automation. Whether this reveals different PF & PM
mental modes representations, a lack of adaptation to
PF workload, or an absence of need of adaptation, is
open to question and points out the relevance for
further study of pilot- monitoring gaze behavior. At
last, the present study focused on basic gaze metrics
that rely on time-averaged data and therefore
neglected the information available in the sequence of
instrument scanning (Lounis, 2021) thus emphasizing
the need for further analysis of the impact of pilot’s
role and automation on scanpaths.
0,00
0,50
1,00
1,50
2,00
2,50
3,00
Pilot-Flying Pilot-Monitoring
STATIC GAZE ENTROPY (BITS)
Full use of automation (FD & AT)
Partial use of automation (FD Only)
No use of automation
Effects of the Automation Level on Gaze Behavior: A Full Flight Simulator Campaign with Professional Airline Pilots
99

REFERENCES
Antonovich, B. (2008). The flight crew and automation.
Journal of Aviation/Aerospace Education & Research,
17(3), 3.
Ebbatson, M., 2009. The Loss of Manual Flying Skills in
Pilots of Highly Automated
Airliners (PhD Thesis). Cranfield University, Cranfield.
Endsley, M. R., & Kiris, E. O. (1995). The out-of-the-loop
performance problem and level of control in
automation. Human Factors, 37(2), 381–394.
Hart, S. G., & Staveland, L. E. (1988). Development of
NASA-TLX (Task Load Index): Results of empirical
and theoretical research. In P. A. Hancock & N.
Meshkati (Eds.), Human mental workload (pp. 139–
183). North-Holland.
Haslbeck, A., Zhang, B., 2017. I spy with my little eye:
analysis of airline pilots’ gaze patterns in a manual
instrument flight scenario. Appl. Ergon. 63, 62–71.
Lee, J. D., & Seppelt, B. D. (2012). Human factors and
ergonomics in automation design. In G. Salvendy
Editor, Human factors and ergonomics (Fourth ed., pp.
1615-1642). Hoboken, New Jersey: John Wiley &
Sons.
Lefrançois O., Matton N., Causse M., Improving Airline
Pilots’ Visual Scanning and Manual Flight
Performance through Training on Skilled Eye Gaze
Strategies. Safety 2021,7,70.
Lounis C, Peysakhovich V, Causse M (2021) Visual
scanning strategies in the cockpit are modulated by
pilots’ expertise: A flight simulator study. PLoS ONE
16(2): e0247061.
Mumaw, R. J., Sarter, N., & Wickens, C. D. (2001).
Analysis of pilots’ monitoring and performance on an
automated flight deck. 11th International Symposium
on Aviation Psychology, Columbus, OH, 8.
National Transportation Safety Board. (1994). A review of
flightcrew-involved, major accidents of US air carriers,
1978 through 1990. Safety Study Report No. PB94-
97001.
Nikolic, M. I., & Sarter, N. B. (2007). Flight deck
disturbance management: A simulator study of
diagnosis and recovery from breakdowns in pilot-
automation coordination. Human Factors, 49(4), 553–
563.
Parasuraman, R., Molloy, R., & Singh, I. L. (1993).
Performance consequences of automation
induced’complacency’. The International Journal of
Aviation Psychology, 3(1), 1–23.
Parasuraman, R., & Manzey, D. H. (2010). Complacency
and bias in human use of automation: An attentional
integration. Human Factors, 52(3), 381–410.
ICCAS 2022 - International Conference on Cognitive Aircraft Systems
100
