
Study on Satisfaction with Basic Public Services in Harbin City
Kexin Li
*a
Harbin University of Commerce, Harbin, Heilongjiang, China
Keywords: Public Satisfaction, Basic Public Services, Local Government.
Abstract: The analysis of residents' satisfaction is one of the important indicators of the government's basic public
service supply. In this paper, a questionnaire is selected to collect the satisfaction of residents in Harbin city
about 22 basic public services in 9 aspects, and the factors affecting the satisfaction are analyzed empirically
by factor analysis and multiple linear regression model, based on which countermeasures to improve the
satisfaction of basic public services are proposed, so that the satisfaction of basic public services in Harbin
city can be further improved.
1 INTRODUCTION
As the level of urbanization increases year by year,
China is faced with the problem of insufficient
demand for basic public services and insufficient
supply of basic public services. Basic public services
are the basic guarantee for the well-being of the
masses, with the government as the main supply
body, driving market resource allocation and guiding
public welfare organizations to supplement the
supply. Basic public services are directly related to
the protection and improvement of people's
livelihood, social equity and justice, the overall
development of people and the overall progress of
society.(Zheng 2017) In the 14th Five-Year Plan
Work Report, it is clearly proposed to improve the
national public service system, and it is emphasized
that "we will speed up to make up for the
shortcomings of basic public services, focus on
strengthening the weaknesses of non-basic public
services, and strive to improve the quality and level of
public services". The Report on the Work of the
Twentieth Five-Year Plan points out that we should
focus on solving the urgent problems of the people,
improve the basic public service system, raise the
level of public services, enhance the balance and
accessibility, and solidly promote common
prosperity. This paper analyzes the basic public
services into 9 primary indicators and 22 secondary
indicators based on the National Basic Public Service
a
https://orcid.org/0000-0002-5015-7458
Standards (2021), and empirically analyzes the
factors affecting satisfaction through factor analysis
and multiple linear regression models to find the
factors affecting the public satisfaction with basic
public services in Harbin, and provides a reference
basis for the government to formulate relevant
measures.
2 RESEARCH DESIGN
In order to understand the residents' satisfaction with
the provision of basic public services in Harbin, the
population of the study was therefore chosen to be
Harbin residents, including permanent residents,
temporary residents and suburban permanent
residents in the 18 administrative districts of Harbin.
The survey was conducted by questionnaire method,
and due to the epidemic, all questionnaires were
collected online. 300 questionnaires were collected,
of which 222 were valid, with an effective rate of
74%. The questionnaire design was divided into two
parts, the first part consisted of 4 questions, mainly to
understand the basic situation of the respondents, and
some questions were set to filter invalid
questionnaires, and also to analyze the group
composition of the respondents. The second part, with
22 questions, was designed from 22 aspects in 9
dimensions, mainly to understand the comprehensive
evaluation of the residents' satisfaction with the basic
218
Li, K.
Study on Satisfaction with Basic Public Services in Harbin City.
DOI: 10.5220/0012072400003624
In Proceedings of the 2nd International Conference on Public Management and Big Data Analysis (PMBDA 2022), pages 218-224
ISBN: 978-989-758-658-3
Copyright
c
2023 by SCITEPRESS – Science and Technology Publications, Lda. Under CC license (CC BY-NC-ND 4.0)

public service provision in Harbin, and factor analysis
was used to assess the residents' satisfaction with
basic public services.
Analyzed the factors influencing the satisfaction
of Spanish citizens with public services through factor
analysis and found that the reliability of public service
supply and the convenience of access by users had a
significant impact on the satisfaction of residents with
public services. (Hu2018) Based on this, in order to
understand the factors that affect the satisfaction of
Harbin residents with basic public services, this paper
uses multiple linear regression models for regression
analysis. Factor analysis method refers to extracting
common factors from the set of research variables,
transforming a large number of measured variables
into a number of comprehensive indicators, and
achieving compression into a few variables that are
easy to statistically analyze with minimum
information loss. Multiple linear regression models
refer to models containing multiple mutually
exclusive variables with explanatory power. (Wei
2021) In this paper, in order to reflect the dynamic
influence process of each variable on the dependent
variable public service satisfaction, four regression
analysis models are made by nesting, and then
analyze the degree of influence of each variable on the
dependent variable public service satisfaction.
3 ANALYSIS OF STUDY
RESULTS
3.1 Analysis of Sample Characteristics
The numerical characteristics of the demographic
variables can be seen according to the following
analysis results, which reflect the distribution of the
respondents of this survey. (Cai 2021) Based on the
results of the frequency analysis of each variable, it
can be seen that the distribution basically meets the
requirements of the sample survey. Among the gender
survey results, the proportion of males is 45% and the
proportion of females is 55%. It basically matches
with the actual gender ratio in Harbin, which indicates
that the survey sample is of high quality in terms of
gender ratio. In terms of the age distribution of the
sample, the bulk of the sample covers the youth group
aged 21-40 and the middle-aged group aged 41-60.
Subjects in these two prime age groups think clearly
and have a certain perception of satisfaction with
basic public services. In terms of the education level
of the sample, 28% of the total sample had completed
only basic education. The sample size of the group
with higher education was 127, accounting for 72%
of the total sample size. This is basically consistent
with the average education level announced by
Harbin City, reflecting the randomness and coverage
ability of the questionnaire distribution. The
occupational distribution of the sample shows that
employees account for 41% of the total sample, and
this group has the most exposure to basic public
services, while other occupations have only partial
access to basic public services, so the questionnaire in
this paper is more convincing. Finally, the distribution
of the sample by place of residence shows that more
than 60% of the sample are permanent residents of the
city, so this questionnaire is more accurate in
reflecting the satisfaction of Harbin citizens with
basic public services.
Table 1: Frequency analysis of demographic variables.
Variables Options Options
Gender
Male 45%
Female 55%
Age
Under 20 years old 10%
21-40 years old 68%
41-60years old 17%
61 years old and above 5%
Place of
residence
Resident in the cit
y
61%
Suburban permanent
residence
22%
Temporary residence in the
cit
y
17%
Career
Students 28%
Staff 41%
Retirement 3%
Unemploye
d
8%
Individual / Freelance 21%
Academic
qualificati
ons
High school/junior high
school and below
28%
College 15%
Undergraduate 43%
Master and above 14%
3.2 Reliability and Validity Analysis
3.2.1 Reliability Analysis
Reliability is a method to test the reliability of the
recovered sample of the questionnaire, that is,
repeatedly testing the same object for several times, if
the results obtained each time are consistent, then the
reliability is high, and vice versa, then the reliability
is low, so this method is commonly used in academia
to test the reliability of the questionnaire before
starting the next step of questionnaire analysis. There
Study on Satisfaction with Basic Public Services in Harbin City
219
are many methods of reliability testing, and in this
paper, we choose the Cronbach's alpha coefficient
method to test the reliability of this questionnaire
sample, and the 9 dimensions of the second part of the
questionnaire are analyzed separately by SPSS for
reliability, and the conclusions are shown in Table 2.
The reliability of this questionnaire is above 0.8,
which indicates that the reliability of this survey is
high and can be analyzed in the next step.
Table 2: Results of confidence analysis.
Variable
Cronbach's alpha
coefficient
Satisfaction with early
childhood education
0.838
Satisfaction with learning
and education
0.861
Satisfaction with work 0.837
Satisfaction with medical
care for the sic
k
0.883
Satisfaction with old age
care
0.847
Satisfaction with housing 0.828
Satisfaction with support for
the wea
k
0.840
Satisfaction with military
service
0.824
Satisfaction with cultural
and s
p
orts services
0.845
Overall Reliability
Coefficient
0.887
3.2.2 Validity Analysis
Validity is also known as validity, which is commonly
known as whether the results of the survey achieve the
results that the questionnaire designer wants to
achieve, and there are many methods of validity
analysis. As shown in Table 3, the KMO of this
survey questionnaire is 0.866 over 0.6, and the
Bartlett significance level is 0 less than 0.05, which
means that the validity is very good.
Table 3: KMO and Bartlett's test.
Kaiser-Meyer-Olkin Measure of
Sampling Adequacy
0.866
Bartlett's test of
sphericity
Approximate
chi-square
7601.014
df 231
Significance 0.000
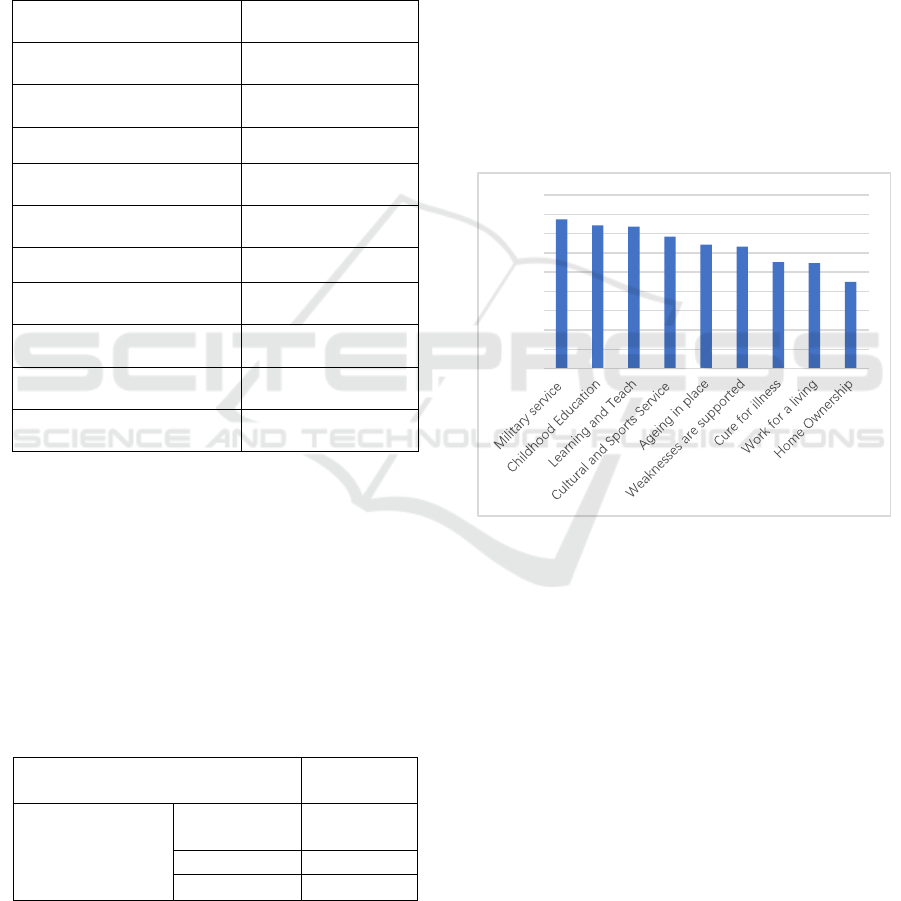
3.3 Satisfaction Analysis
In order to measure the satisfaction of residents with
basic public services, this paper sets five options for
each type of basic public services: "very satisfied",
"relatively satisfied", "generally satisfied", "relatively
dissatisfied" and "very dissatisfied". For each type of
basic public service, five options are set: "very
satisfied", "relatively satisfied", "generally satisfied",
"relatively dissatisfied" and "very dissatisfied", which
are assigned 5, 4, 3, 2 and 1 points respectively. If the
proportion of respondents who chose "very satisfied"
and "relatively satisfied" is taken as the index of
satisfaction with each basic public service, we will
have a column of satisfaction with basic public
services. Then we get a histogram of residents'
satisfaction with basic public services. The highest
satisfaction rate is 77.31% for the military service,
followed by 74.22% for the elderly service, with a
small difference between the two. Among the nine
types of public services, the satisfaction rate of
housing services is significantly smaller, at 44.93%.
Figure 1: Basic public service satisfaction index.
This paper uses factor analysis to calculate the
total score of residents' satisfaction with the above
nine types of basic public services. It is a statistical
analysis method that uses a few factors to describe the
association between many indicators or factors, and a
few less factors to reflect most of the information of
the original data. The mathematical expression of the
factor analysis model is:
Xi = μ + ai
F
+ai
F
+⋯+ai
F
+ε
,
(i=1,2…,p)
where Xi is the observed random variable, Fi is the i-
th public factor, which is an unobservable variable, aij
(j=1, 2, ..., m) is the factor loading, and εi is the special
factor, which is the part that cannot be included by the
first m public factors.
As shown the table4, for the nine basic public
service satisfaction variables, one common factor
with eigenvalues greater than 1 was extracted by
77,31
74,22
73,59
68,33
64,23
63,22
55,21
54,65
44,93
0
10
20
30
40
50
60
70
80
90
PMBDA 2022 - International Conference on Public Management and Big Data Analysis
220

applying the principal component method. Moreover,
this one common factor can explain 69.37% of the
total variance of the 11 variables. Overall, it has a high
degree of concentration and the amount of
information loss is within an acceptable range.
Table 4: Public factor analysis.
Common
factor
Eigenvalue Variance Proportion
Cumulative
variance
F1 6.86159 6.92047 0.6830 0.6937
F2 0.64112 0.05889 0.0583 0.7222
F3 0.58222 0.08087 0.0529 0.7661
F4 0.50135 0.05157 0.0456 0.7807
F5 0.44978 0.0497 0.0409 0.8216
F6 0.40008 0.01097 0.0363 0.8421
F7 0.38911 0.05855 0.0355 0.9233
F8 0.29181 0.03875 0.0365 0.9432
F9 0.27781 0.014 0.0153 1.0000
As shown in the figure below the table, a common
factor extracted using the principal component
method has high factor loading values on all nine
basic public service satisfaction variables. Moreover,
each of the basic public service satisfaction variables
has a more balanced commonality on the common
factor, and there is no significantly low commonality.
Therefore, we saved the scores of the first common
factor and, for comparison, multiplied its value by 100
as the total score of residents' satisfaction with the
nine public services in Harbin, with higher scores
indicating higher satisfaction as the dependent
variable.
Table5: Analysis of dependent variables.
Variables Factor Load Commonalit
y
Childhood
Education
0.8028 0.3555
Learning and
teaching
0.7962 0.366
Medical care
for the sic
k
0.7466 0.4425
Cure for
illness
0.7438 0.4468
Ageing in
p
lace
0.8085 0.3463
Work for a
livin
g
0.7304 0.4665
Weaknesses
are su
pp
orte
d
0.7809 0.3902
Military
service
0.8331 0.3059
Cultural and
Sports Service
0.7914 0.3737
In order to investigate the factors affecting the
satisfaction of basic public services of Harbin
residents, this paper uses a general multiple linear
regression model with the score of satisfaction with
basic public services as the dependent variable, and
the basic variables of gender, age, education,
occupation, and place of residence are statistically
controlled, and the analysis focuses on the
relationship between the sense of access, sense of
fairness, and public policy awareness of Harbin
residents on the dependent variable of satisfaction
with public services. The mathematical expression of
the model is as follows the mathematical expressions
of the model are as follows.
y=b
+b
x
+b
x
+⋯+b
x
+e
In the above equation, y is the dependent variable,
which in this paper is the public service satisfaction
score, b0 is a constant term representing the base level
at which all independent variables are 0 is the
dependent variable, b1, b2, b3, bn are partial
regression coefficients representing the average
change in the dependent variable when the particular
independent variable changes by one unit, given that
the other independent variables take the same value. e
is the sampling error term.
Based on the above ideas, the results of the
multiple linear regression analysis made by using
Stata 12.0 statistical software are shown in Table 6. In
order to reflect the dynamic influence process of the
respective variables on the dependent variable public
service satisfaction, the author made four regression
analysis models by nesting.
Table 6: Multiple linear regression analysis.
Independent variable
Benchmark
Model
Access
Model
Sense of
fairness model
Cognitive
degree
model
Gender (M=0) 1.995 2.922 4.045 6.239*
(-4.904) (-3.806) (-3.653) (-3.614)
Age 0.982*** 0.485*** 0.311** 0.226*
(-0.184) (-0.144) (-0.138) (-0.137)
Study on Satisfaction with Basic Public Services in Harbin City
221

College(below high
school/junior high
school = 0)
-2.819** -1.144 -4.377 -6.59
(-6.018) (-4.671) (-4.489)
(-4.436)
Bachelor's degree or
above
5.849** -0.915 -4.708 -6.76
(-6.992) (-5.43) (-5.219) (-5.153)
Place of residence
(
suburb = 0
)
6.932** -4.368 -0.146 -0.0511
(-4.658) (-3.63) (-3.499) (-3.45)
Staff(student=0) -11.07* -3.457 -3.195 -0.924
(-6.014) (-4.673) (-4.483) (-4.431)
Unemployed/retired -19.08*** -4.275 -4.491 0.0572
(-5.73) (-4.468) (-4.287) (-4.273)
Sense of Access 10.70*** 8.723*** 8.180***
(-0.312) (-0.339) (-0.342)
Sense of fairness 7.976*** 7.098***
(-0.641) (-0.643)
Policy Awareness 2.656***
(-0.367)
Constant term -53.86*** -347.2*** -385.0*** -377.2***
(-12.36) (-12.85) (-12.69) (-12.56)
Case items 1,849 1,849 1,849 1,849
R2 0.070 0.440 0.485 0.500
4 CONCLUSION
The results show that the regression has much higher
explanatory power, with the R2 reflecting the
regression's extraordinary explanatory power
increasing from 0.07 to 0.44. Moreover, the variable
of access to basic public services has a significant
positive effect on satisfaction with basic public
services, specifically, for the same value of other
independent variables, the score of satisfaction with
basic public services will increase by 10.7 points on
average for every 1 point increase in the score of
access to basic public services. Specifically, with the
same values of other independent variables, for every
1-point increase in the basic public service access
score, the basic public service satisfaction score will
increase by 10.7 points on average. This means that
the higher the farmers' sense of access to public
services, the higher their satisfaction with public
services. By adding a new independent variable, sense
of fairness, to the access model, a multiple linear
regression model of sense of fairness is obtained.
model. (Cheng 2022) The results show that the
explanatory power of the equation has improved
significantly, with the R2 of the model increasing
from 0.44 to 0.485. Moreover, there is a significant
positive relationship between perception of fairness
and satisfaction with public services, specifically, for
residents of Harbin City, every 1-point increase in
perception of fairness score will increase their
satisfaction with basic public services by 7.976 points
on average. This indicates that the higher the sense of
equity in basic public services, the higher the
satisfaction with public services. (Ruan 2020) A
multiple linear regression model of policy awareness
was obtained by adding a new independent variable,
public service policy awareness, to the model of
perceived fairness. The results showed that the
explanatory power of the equation improved
significantly, with the R2 of the model increasing
from 0.485 to 0.5. Moreover, policy awareness had a
significant positive effect on public service
satisfaction, specifically, for Harbin residents, each
point increase in the awareness of basic public service
policies would increase their public service
satisfaction scores by 2.656 points on average. This
means that the higher the residents' awareness of
public service policies, the higher their satisfaction
with public services.
PMBDA 2022 - International Conference on Public Management and Big Data Analysis
222

5 SUGGESTIONS
5.1 Establishing a Diversified Supply
Mechanism
Although the government department is the largest
supply body of public services, responsible for
coordinating the construction of basic public services
around the world, but basic public services can not be
provided by the government department only, in some
cases the government department also exists
dysfunctional phenomenon, inevitably brings the
problem of inefficient supply, resulting in the
phenomenon of waste of public resources. Therefore,
the government of Harbin should prepare for the
future, create a social environment conducive to the
development and growth of various social
organizations, encourage and support social capital
forces to join the supply of basic public services, and
at the appropriate time to introduce organizational
competition mechanism, in order to promote social
capital to join the supply of public services more
vitality, and thus enhance the efficiency of the supply
of basic public services.(Zhang 2019) At the same
time, social capital should be given moderate
preferences at the policy level, for example, in terms
of capital loans, preferential treatment can be given to
reputable enterprises by lowering loan interest rates
and lowering loan thresholds, so as to better attract
high-quality social capital to various aspects of basic
public goods and services.(Siddiqui 2021)
5.2 Smooth Channels for Expressing
Residents' Interests and Demands
Smooth channels for expressing public opinion can
also help residents to play a supervisory role in the
distribution of basic public service resources, prevent
integrity risks in the distribution process by those who
distribute benefits, and help government departments
to divide the cake of basic public service resources
well and form a reasonable distribution pattern that is
fairly enjoyed by all. (Ren 2022) In the past, people
used to express their opinions by putting their written
letters into opinion boxes, but with the progress of the
times, people have more convenient and efficient
channels to express their opinions, such as through
WeChat and e-mail, and these anonymous ways of
expression can help farmers to express their opinions
freely, which helps to eliminate the differences
between residents and government departments, ease
the conflicts between the government and the people,
and form a harmonious social atmosphere.
5.3 Strengthening Farmers' Policy
Awareness
Residents' awareness of basic public service policies
determines the satisfaction of public services.
Increasing the publicity of residents' basic public
service policies is conducive to enhancing residents'
awareness of the policies.
(Wei 2014) Residents must
know the policy in order to understand it, and then
accept and comply with it. Therefore, government
departments should strengthen the publicity of public
service policies and optimize the way of public
service policy publicity, so that public service policies
can really penetrate into the hearts of the people.
REFERENCES
Cai, Li-Hui & Hao, Yu-Kun. (2021). A study on the
improvement of public service satisfaction under the
indirect management approach of government.
Administrative Forum (03), 30-40.
Cheng, M.W., Li, D.Y. & Yang, W.R.. (2022). Does
"household registration discrimination" exist in urban
basic public services? Journal of Tongji University
(Social Science Edition) (05), 104-114.
Haiyang Ren, Hancong Zhu, Min Wang & Xuelei Zhang.
(2022).Satisfaction Survey of Environmental Basic
Public Services and Study on Influencing Factors in
New-type Urbanization Areas. IOP Conference Series:
Earth and Environmental.
Hu Chenpei, Jiang Wei, Qiang Hengke & Xu Jing. (2018).
Analysis of public service satisfaction and its
heterogeneity in East China - based on fuzzy
comprehensive evaluation method. East China
Economic Management (08),34-40.
Luo Wei & Li Yan. (2021).Basic Public Services, Financial
Competition and Economic Growth of Urban
Agglomeration on Yangtze River Delta Based on Big
Data. Journal of Physics: Conference Series (4).
Ruan Rongping, Zheng Fengtian & Liu Li. (2020). Has the
"new agricultural insurance" improved the satisfaction
of insured farmers with local government? Journal of
Public Administration (03), 100-112+172.
Siddiqui Saniya, Akhtar Mohammad Nadeem, Nejem Jamal
K. & Alnoumasi Mastour Saud. (2021). Evaluating
Public Services Delivery on Promoting Inclusive
Growth for Inhabitants of Industrial Cities in
Developing Countries. CIVIL ENGINEERING
JOURNAL-TEHRAN (2).
Wei Hu. Mei-ling Liu. (2014) Service-oriented
Government, Public Satisfaction, and Opinion Poll. The
Journal of Jiangsu Administration Institute
Zheng JJ. (2017). Gender differences in the mechanisms of
political participation and political communication on
public service satisfaction--an empirical analysis based
on data from 6159 Chinese citizen surveys. Journal of
Study on Satisfaction with Basic Public Services in Harbin City
223

Tsinghua University (Philosophy and Social Science
Edition) (05), 164-171+199.
Zhang, Q. & Zhou, Z.. (2019). Public demands, perceived
equilibrium and public service satisfaction - An analysis
based on relative deprivation theory. Journal of Jianghai
Studies (06), 90-95.
PMBDA 2022 - International Conference on Public Management and Big Data Analysis
224
