
Modeling Optimization Study of Two-Dose Vaccine Distribution
Considering Timeliness
Bei Zhang
a
School of Economics and Management,
Nanjing University of Science and Technology,
Nanjing, China
Keywords: Epidemic Control, Vaccine Distribution, Timeliness.
Abstract: Vaccination is one of the most effective measures for epidemic prevention and control. In this paper, we firstly
construct a vaccine timeliness function based on vaccine effectiveness and completion time. Then we propose
a dynamic two-dose vaccine distribution optimization model base on the age-structure compartment model,
to reduce infection and speed up infection clearance. Comparing with the pro rata strategy and the not
considering timeliness strategy, the results showed that the strategy designed in this paper not only advanced
the clearing time but also reduced the number of infections.
1 INTRODUCTION
Vaccination is one of the most efficient ways to halt
the spread of the COVID-19 outbreak. Most countries
advise 2 rounds of vaccination to avoid COVID-19
pneumonia. But optimizing the distribution of two
doses of the vaccine in the absence of adequate
vaccine production presents an objective and
practical difficulty.
Vaccine distribution needs to be based on the
dynamics of epidemic transmission, and the
compartment model is an effective means to
characterize epidemic transmission (Mukandavire et
al. 2007, Althaus et al. 2014, Glasser et al. 2016, He
et al. 2020).
A compilation of the literature related to vaccine
distribution reveals that most vaccine distribution
studies consider only one-time distribution of one-
dose vaccines, such as Enayati et al. reduced the
effective regeneration number of influenza epidemics
to less than or equal to 1 by a one-time vaccine
distribution (Enayati et al. 2020). Matrajt et al.
proposed an optimal allocation strategy for the
COVID-19 vaccine, and they assumed that people
had been vaccinated according to the optimal
allocation before the experiment (Matrajt et al. 2021).
A small number of studies have also considered two-
a
https://orcid.org/0000-0002-8892-6048
dose vaccine allocation, such as Matrajt et al. who,
based on a previous article, proposed an optimal
allocation strategy with a mixture of one- and two-
dose vaccines (Matrajt et al. 2021). Few other studies
conducted dynamic distribution studies of vaccines in
the spread of the epidemic, such as Han et al.
conducted an optimal distribution study of the new
crown vaccine to obtain a time-varying vaccine
distribution strategy (Han et al. 2021). Chen et al.
studied the COVID-19 vaccine allocation strategy in
New York City and found that the dynamic
distribution strategy outperformed the static
distribution strategy (Chen et al. 2018).
Specifically, Parino et al. conduct a dynamic
distribution study of two-dose vaccine in an Italian
research context (Parino et al. 2021). Further, they
proposed a stochastic optimal vaccine allocation
model to explore the problem of optimal allocation of
two-dose vaccine (Calafiore et al. 2022). Based on
their study, this paper further considers the age
heterogeneity of virus transmission and vaccine
efficacy, and innovatively defines vaccine timeliness
and uses it as the objective function for optimal two-
dose vaccine distribution.
Zhang, B.
Modeling Optimization Study of Two-Dose Vaccine Distribution Considering Timeliness.
DOI: 10.5220/0012071700003624
In Proceedings of the 2nd International Conference on Public Management and Big Data Analysis (PMBDA 2022), pages 179-183
ISBN: 978-989-758-658-3
Copyright
c
2023 by SCITEPRESS – Science and Technology Publications, Lda. Under CC license (CC BY-NC-ND 4.0)
179

2 MODEL FORMULATION
2.1 Parameter and Variable Definitions
The necessary notation for this paper is first defined
as follows to make it easier to articulate the model in
the following section:
K
: the set of age groups,
,kk K∈
k
: any age group that encounters the age group
k
, the age group
k
will encounter this age group and
other age groups
kN
: Number of people in the age group
k
k
ς
: Susceptibility of the age group
k
1k
τ
: Effectiveness of the first dose of vaccine for
the age group
k
2k
τ
: Effectiveness of two full doses of vaccine for
the age group
k
β
: Transmission rate
,kk
C
: Contact rate between age group
k
and age
group
k
δ
: Probability of conversion from latent to
infected
γ
: Probability of conversion of an infected person
to a recovered person
ω
: Interval between the first and second doses
T
: Duration of the experiment,
tT∈
ο
: Number of vaccines distributed per day
()
k
St
: Number of susceptible persons in the age
group
k
at the time
t
1
()
k
Vt
: Number of people in the group
k
who
had received the first dose of vaccine and not the
second dose at the time
t
2
()
k
Vt
: Number of people in the age group
k
who had received the full two doses of vaccine at the
time
t
()
k
Et
: Number of latent cases in the age group
k
at the time
t
()
k
I
t
: Number of infected persons in the age
group
k
at the time
t
()
k
Rt
: Number of recovered persons in the age
group
k
at the time
t
1
()
k
ut
: Number of first vaccine doses assigned to
the age group
k
at the time
t
2
()
k
ut
: Number of second vaccine doses assigned
to the age group
k
at the time
t
2.2 Model Explanation
2.2.1 Timeliness Definition
This study evaluates the vaccination's timeliness in
terms of both vaccine efficiency and completion time.
The total number of infections devotes the efficiency
of the vaccination. The clearing time of infected
persons indicates completion time of the vaccination.
The vaccine effect and completion time functions are
created using the sigmoid function (
1
f( )
1
ax
x
e
−
=
+
). The
precise steps are as follows.
𝐼
=𝐼
(𝑡)
(1)
𝑓
(𝐼
)=
1
1
+
𝑒
(
)
(2)
𝑡
=
⎩
⎪
⎨
⎪
⎧
𝑡
|
𝐼
(𝑡)=0, 𝐼
(𝑇)=0
𝑇,𝐼
(𝑇)>0
(3)
𝑔(𝑡
)=
1
1
+
𝑒
(
)
(4)
𝑀𝑎𝑥 (𝑚𝑓(𝐼
))(𝑛𝑔(𝑡
)) (5)
2.2.2 Vaccine Distribution Model
In this study, the vaccine distribution operation is
added to the age-structured seir model with two new
compartments included to create the SVEIR model,
as illustrated in
Figure 1 below.
S
k
V
1k
V
2k
E
k
I
k
R
k
δ γ
Figure 1: The SVEIR model.
In the SVEIR model, we divide the population
into six categories, namely susceptible (S), first dose
vaccine recipient(V
1
), full dose vaccine recipient(V
2
),
exposed (E), infected (I) and recovered (R).
Susceptible persons (S
k
) are transformed into exposed
persons (E
k
) in part due to contact with infected
persons (
k
I
) and into first dose vaccine recipients
(V
1k
) in part due to first dose vaccination. After at
PMBDA 2022 - International Conference on Public Management and Big Data Analysis
180

least days, the first dose vaccinated persons (V
1k
)
can receive the second dose vaccination and become
full dose vaccinated persons (V
2k
). The total number
of first and second doses of vaccine allocated to each
age group each day will not exceed the supply for that
day ( ). The first dose vaccine recipients (V
1k
) and
the full dose vaccine recipients(V
2k
) are also partially
transformed into exposed persons (E
k
) due to contact
with infected persons
()
k
I
in each age group.
Exposed persons (E
k
) become infected (I
k
) after an
incubation period of . Infected persons (I
k
) are
transformed into recovered persons (R
k
) after a period
of infection.
According to the above description, the dynamic
conversion process between different populations
during the outbreak is as follows:
𝑑𝑆
(𝑡)
𝑑𝑡
=𝑢
(𝑡) 𝑆
(𝑡)𝛽
(𝜍
𝐶
,
𝐼
(𝑡)
𝑁
,
)
(6)
𝑑𝑉
(𝑡)
𝑑𝑡
=𝑢
(𝑡) 𝑢
(𝑡) 𝑉
(𝑡)(1
𝜏
)𝛽
(𝜍
𝐶
,
𝐼
(𝑡)
𝑁
,
)
(7)
𝑑𝑉
(𝑡)
𝑑𝑡
= 𝑢
(𝑡) 𝑉
(𝑡)(1
𝜏
)𝛽
(𝜍
𝐶
,
𝐼
(𝑡)
𝑁
,
)
(8)
𝑑𝐸
(𝑡)
𝑑𝑡
=(𝑆
(𝑡) + 𝑉
(𝑡)(1 𝜏
)+𝑉
(𝑡)(1
𝜏
))𝛽
(𝜍
𝐶
,
𝐼
(𝑡)
𝑁
,
)
𝛿𝐸
(𝑡)
(9)
𝑑𝐼
(𝑡)
𝑑𝑡
=𝛿𝐸
(𝑡) 𝛾𝐼
(𝑡)
(10)
𝑑𝑅
(𝑡)
𝑑𝑡
=𝛾𝐼
(𝑡)
(11)
(𝑢
(𝑡) + 𝑢
(𝑡))𝜊
(12)
0𝑢
(𝑡)𝑆
(𝑡)
(13)
0𝑢
(𝑡 + 𝜔)𝑉
(𝑡)
(14)
𝑆
(𝑡),𝑉
(𝑡),𝑉
(𝑡),𝐸
(𝑡),𝐼
(𝑡),𝑅
(𝑡)0
(15)
3 SOLUTION PROCEDURE
The model described above is a nonlinear
optimization model and solved by the particle swarm
algorithm. The solution process is outlined as follows.
Step 1: Randomly initialize the position vector so
that the sum of elements is equal to the daily vaccine
supply ( ).
Step 2: The positions are brought into the SVEIR
model to calculate the infection situation, and the
objective function value is obtained as the fitness.
Step 3: Compare the fitness values, get the
individual optimal solution and population optimal
solution, and update the position and velocity of the
particles.
Step 4: The algorithm terminates when the
maximum number of iterations or the upper limit of
running time is reached.
4 CASE STUDY
4.1 Parameter Setting
The test population of 100,000 people was divided
into four groups: 0-14, 15-39, 40-64, and 65+. The
parameter settings considering age heterogeneity are
referred to the literature (Al Kaabi et al. 2021, China
2021, Hu et al. 2021), as shown in the following table.
Table 1: Parameter settings considering age heterogeneity.
Age
group
No. Popul
ation
Susce
ptibili
ty
Effectiv
eness of
first
dose
Effectiv
eness of
full dose
0-14 1 17973 0.58 0.2 0.6
15-39 2 32816 1 0.3 0.8
40-64 3 35689 1 0.3 0.8
65+ 4 13522 1.65 0.2 0.6
Assuming an effective reproduction number of
1.5 at the beginning of the outbreak, the resulting
transmission rate was 0.0610 (Diekmann et al. 1990).
The contact rate between age groups was calculated
from literature (Zhang et al. 2019). The transition rate
from exposed to infected was 0.1562 (incubation
period 6.4 days). The probability of recovery was
0.1754 (mean infection period 5.7 days) (Hu et al.
2021). The minimum interval between the first and
second dose was 21 days. The total duration of the
experiment was set at 300 days, with 1500 doses of
vaccine distributed daily and 5 infected individuals in
each age group at the beginning of the experiment.
4.2 Test Result
The algorithm yielded a locally optimal solution after
349 iterations with a cumulative number of infections
of 3338 and 178 days of clearing under a 1-hour
runtime limit.
The distribution of the vaccine is shown in Fig. 2-
3 below. The 65+ age group, which is sensitive to the
virus and has low vaccine efficacy, needs to be
vaccinated as fast as possible until fully covered.
When the outbreak appears to be under control in the
65+ age group, the 65+ age group can postpone
receiving the first dose, which already has high
coverage, and continue receiving vaccinations once
the disease has been contained in other age groups.
Modeling Optimization Study of Two-Dose Vaccine Distribution Considering Timeliness
181
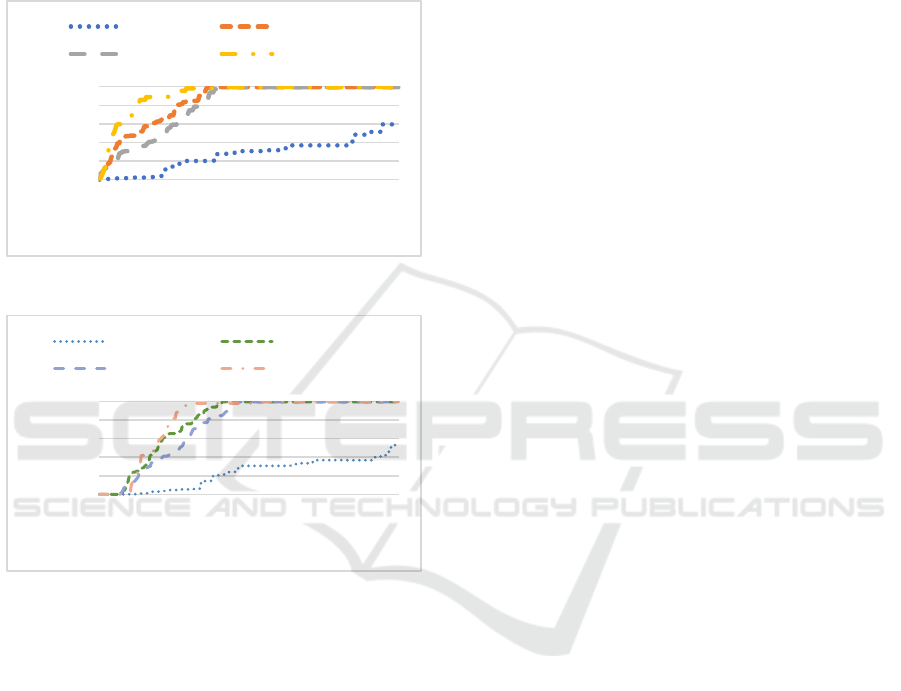
The 15-39 and 40-64 age groups, which have the most
contact with other age groups, also need to be
vaccinated quickly until complete coverage is
achieved. The 0-14 age group basically does not
receive vaccination in the early stage due to its own
low susceptibility to the virus, and a small amount of
vaccination is slowly administered after the epidemic
is controlled in other age groups.
Figure 2: First dose distribution.
Figure 3: Second dose distribution.
5 CONCLUSION
In this paper, a time-efficient objective function is
innovatively defined in the vaccine distribution
problem to reduce infections and achieve early zero
community transmission. We introduce vaccination
operations into an age-structured compartment model
and constructs a dynamic vaccine distribution model
that can be extended to other age heterogeneous
infectious diseases for resource distribution
decisions. Afterwards, we combine particle swarm
algorithm with ideal point method to solve the
location model. Based on data experiments, we
suggest that vaccination of the 65+ age group should
be performed as fast as possible until complete
coverage is achieved. The 15-39 and 40-64 age
groups should be followed by timely and complete
coverage; the 0-14 age group can be vaccinated in
small amounts in the early stages.
This paper also has some shortcomings that could
be a direction for future research. We do not consider
asymptomatic infected people and the effect of
vaccine on reducing the symptoms of infection. We
used the particle swarm algorithm to solve the model,
but the search for a faster and more accurate solution
can be continued.
REFERENCES
Al Kaabi, N. Zhang, Y., et al. (2021). Effect of 2 Inactivated
SARS-CoV-2 Vaccines on Symptomatic COVID-19
Infection in Adults: A Randomized Clinical Trial. J.
JAMA 326(1): 35-45.
Althaus, C. L.Gsteiger, S., et al. (2014). Ebola virus disease
outbreak in Nigeria: lessons to learn. J. PeerJ PrePrints
2: e569v561.
Calafiore, G. C.Parino, F., et al. (2022). Dynamic planning
of a two-dose vaccination campaign with uncertain
supplies. J. European journal of operational research.
Chen, C.Wood, J., et al. (2018). The role of timeliness in
the cost-effectiveness of older adult vaccination: a case
study of pneumococcal conjugate vaccine in Australia.
J. Vaccine 36(10): 1265-1271.
China, N. B. o. S. o. (2021). China Statistical Yearbook
2021, China Statistics Press.
Diekmann, O.Heesterbeek, J. A. P., et al. (1990). On the
definition and the computation of the basic
reproduction ratio R 0 in models for infectious diseases
in heterogeneous populations. J. Journal of
mathematical biology 28(4): 365-382.
Enayati, S.,Özaltın, O. Y. (2020). Optimal influenza
vaccine distribution with equity. J. European Journal of
Operational Research 283(2): 714-725.
Glasser, J. W.Feng, Z., et al. (2016). The effect of
heterogeneity in uptake of the measles, mumps, and
rubella vaccine on the potential for outbreaks of
measles: a modelling study. J. The Lancet Infectious
Diseases 16(5): 599-605.
Han, S.Cai, J., et al. (2021). Time-varying optimization of
COVID-19 vaccine prioritization in the context of
limited vaccination capacity. J. Nature communications
12(1): 1-10.
He, S.Peng, Y., et al. (2020). SEIR modeling of the
COVID-19 and its dynamics. J. Nonlinear dynamics
101(3): 1667-1680.
Hu, S.Wang, W., et al. (2021). Infectivity, susceptibility,
and risk factors associated with SARS-CoV-2
transmission under intensive contact tracing in Hunan,
China. J. Nature communications 12(1): 1-11.
Matrajt, L.Eaton, J., et al. (2021). Vaccine optimization for
COVID-19: Who to vaccinate first? J. Science
Advances 7(6): eabf1374.
0%
20%
40%
60%
80%
100%
1
17
33
49
65
81
97
113
129
145
161
177
193
209
225
241
257
273
289
coverage
days
0-14 first dose 15-39 first dose
40-64 first dose 65+ first dose
0%
20%
40%
60%
80%
100%
1
17
33
49
65
81
97
113
129
145
161
177
193
209
225
241
257
273
289
coverage
days
0-14 second dose 15-39 second dose
40-64 second dose 65+ second dose
PMBDA 2022 - International Conference on Public Management and Big Data Analysis
182

Matrajt, L.Eaton, J., et al. (2021). Optimizing vaccine
allocation for COVID-19 vaccines: critical role of
single-dose vaccination. J. medRxiv.
Mukandavire, Z.,Garira, W. (2007). Age and sex structured
model for assessing the demographic impact of mother-
to-child transmission of HIV/AIDS. J. Bulletin of
mathematical biology 69(6): 2061-2092.
Parino, F.Zino, L., et al. (2021). A model predictive control
approach to optimally devise a two‐dose vaccination
rollout: A case study on COVID‐19 in Italy. J.
International Journal of Robust and Nonlinear Control.
Zhang, J.Klepac, P., et al. (2019). Patterns of human social
contact and contact with animals in Shanghai, China. J.
Scientific reports 9(1): 1-11.
Modeling Optimization Study of Two-Dose Vaccine Distribution Considering Timeliness
183
