
Research on the Influence of Community Service Level and
Management System on Residents' Awareness of Community
Governance
Hongmei Li
College of Science, North China University of Technology, Beijing, 100144, China
Keywords: Questionnaire Survey, Structural Equation Model, Path Analysis, Community Governance, Autonomous
Management.
Abstract: The government plays a leading role in community governance, and the dynamic role of individual residents
can not be underestimated. Residents' participating in community governance is the most micro form of cit-
izens' participating in social affairs. How to guide and organize residents to actively participate in community
governance and effectively improve residents' community governance ability is an important topic in the
grass-roots departments of the government. Firstly, this paper takes 18-65 years old community residents in
Mentougou District of Beijing as the research object, and carries out a questionnaire survey. The question-
naire has three groups of scales, including 13 observable variables. Then, based on the questionnaire survey
data, using the structural equation model, this paper carefully probes into the influence path between the three
latent variables of management system cognition (MC), service level satisfaction (SS) and community gov-
ernance awareness (GA), analyzes the direct effect, indirect effect and total effect between the variables, and
draws a relatively reasonable conclusion. Finally, based on the analysis conclusion, this paper puts forward
relevant policy suggestions for government management departments from the aspects of improving service
level, strengthening autonomous management, introducing incentive mechanism, paying attention to com-
munity education and so on.
1 INTRODUCTION
Community governance is the cornerstone of the
national governance system. Residents' participating
in community governance is the most microscopic
form of citizens' participating in social affairs. In July
2021, the CPC Central Committee and the State
Council issued "Opinions on strengthening the mod-
ernization of grass-roots governance system and
governance capacity", which put forward general
requirements on how to "Jointly build, govern and
share, and build a grass-roots governance community
in which everyone is responsible, conscientious and
enjoyed ", and provided policy and institutional
guarantees for grass-roots community governance.
The level of community service will directly affect
residents' willingness to participate in community
governance, and the degree of improvement of the
management system will also have a different impact
on residents' awareness and degree of participation in
community governance. How to guide and organize
residents to actively participate in community gov-
ernance, and effectively improve residents' commu-
nity governance ability, is an important topic in the
grass-roots government departments. Therefore, in
this paper we first organize a questionnaire survey
with 18-65 years old community residents in Men-
tougou District of Beijing as the research object, and
obtain the research data. Then, based on the survey
data, using structural equation model, we make a
detailed exploration on the influence path of com-
munity management system, service level and resi-
dents' community governance awareness, and draw a
reasonable conclusion. Finally, based on the analysis
conclusion, we put forward relevant policy sugges-
tions for the government management departments,
focusing on improving service level, strengthening
autonomous management, introducing incentive
mechanism, and paying attention to community
education.
172
Li, H.
Research on the Influence of Community Service Level and Management System on Residents’ Awareness of Community Governance.
DOI: 10.5220/0012071600003624
In Proceedings of the 2nd International Conference on Public Management and Big Data Analysis (PMBDA 2022), pages 172-178
ISBN: 978-989-758-658-3
Copyright
c
2023 by SCITEPRESS – Science and Technology Publications, Lda. Under CC license (CC BY-NC-ND 4.0)
2 RESEARCH SCHEME
DESIGNING
In order to obtain relevant micro data, we specially
organize a questionnaire survey. In the scheme, we
define "service level satisfaction"(SS), "management
system cognition"(MC) and "community governance
awareness"(GA) as 3 latent variables. SS is reflected
by 5 observable variables, "entrance service, con-
venience service, publicity service, sanitation and
greening, and public benefit activities". MC is re-
flected by 4 variables, "epidemic prevention man-
agement, safety management, environment man-
agement and autonomous management". And GA is
reflected by 4 variables, that is "governance will-
ingness, social value, self-enhancement and govern-
ance behavior".
Corresponding each latent variable, we design a
set of scales respectively. The scales are unified in the
form of 5-level Likert scale. The options of SS scale
are "very satisfied", "satisfied", "general", "dissatis-
fied" and "very dissatisfied". MC scale options are
"very familiar", "familiar", "general", "unfamiliar",
"very unfamiliar". And GA scale options are "very
agree", "agree", "general", "disagree", "very disa-
gree". The options are assigned uniformly as 5, 4, 3, 2
and 1. The specific items and corresponding variables
are shown in Table 1:
Table 1: Correspondence between questionnaire items and observable variables.
Ite
m
Observable Variable Variable No.
1.Community entrance and household unit access
control management.
Entrance service V01
2.Convenient services such as vegetables distribu-
tion, ex
p
ress deliver
y
, housekee
p
in
g
, etc.
Convenience service V02
3.Health, safety, epidemic prevention and other
p
opular science publicity.
Publicity service V03
4.Community greening and environment sanita-
tion.
Sanitation and greening V04
5.Community public benefit activities such as
s
p
orts, summer holida
y
s, festivals and customs.
Public benefit activities V05
6.Community epidemic prevention and control
mana
g
ement s
y
stem.
Epidemic prevention
mana
g
ement
V06
7.Community fire control, anti-theft and other
safety management systems.
Safety management V07
8.Community garbage classification and public
s
p
ace mana
g
ement s
y
stem.
Environment manage-
ment
V08
9.Administrative measures for voluntary services
of communit
y
residents.
Autonomous manage-
ment
V09
10.I am willing to participate in community gov-
ernance
Governance willing-
ness
V10
11.I think participating in community governance
is the embodiment of serving the society.
Social value V11
12.I think participating in community governance
can promote self-enhancement.
Self-enhancement V12
13.I often volunteer to participate in community
g
overnance activities.
Governance behavior V13
We select five different communities in a mul-
ti-stage random way, and then randomly distribute
questionnaires in each community. Finally, 318 valid
questionnaires are collected.
3 DATA QUALITY TESTING
AND DESCRIBING
First, we use SPSS 25 to test the reliability of the data,
and the results are shown in Table2.
Table 2. Reliability Statistics
Dimension
Cronbach’s
Alpha
N of
Items
Service level satisfac-
tion (SS)
.520 5
Management system
cognition (MC)
.602 4
Community govern-
ance awareness (GA)
.753 4
Overall scale .806 13
Research on the Influence of Community Service Level and Management System on Residents’ Awareness of Community Governance
173
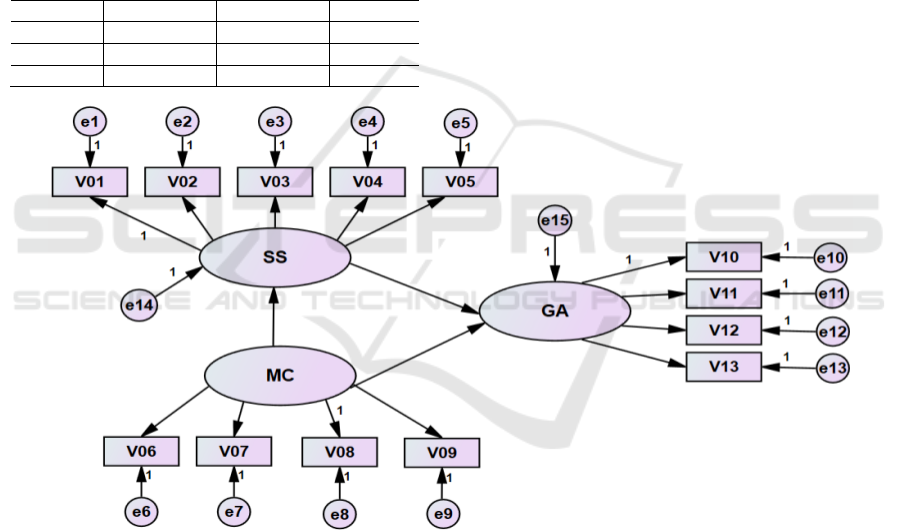
Table 2 shows that the Cronbach's Alpha coeffi-
cients of each group and the overall scale have
reached more than 0.5, indicating that the data have a
high level of reliability. Meanwhile, we conduct
KMO and Bartlett's test on the data. The KMO coef-
ficient is 0.864>0.5, sig.=0.000, which meets the
conditions of factor analysis. And the common fac-
tors are highly consistent with the latent variables of
the preset 3 dimensions, reflecting that the data has
high factor structure validity. Therefore, the scale
design and data quality meet the basic requirements.
In order to explore the relationship between the
latent variables of the 3 dimensions, we first calculate
the correlation matrix according to the average scores
of the 3 groups of variables, as shown in Table 3.
Table 3. Variable correlation matrix
GA MC SS
GA 1
MC 0.514986 1
SS 0.516051 0.547472 1
Table 3 shows that the correlation coefficients
between the 3 groups of variables are above 0.5,
reaching a significant correlation level, and the cor-
relation is positive, indicating that there is an obvious
positive impact between the three. But what is the
specific impact path? Further, we construct the
structural equation model with the help of Amos 22
software.
4 STRUCTURAL EQUATION
MODEL SETTING AND
EVALUATING
According to our initial prediction of the relation-
ships between variables in the questionnaire design,
the hypothetical model is set as shown in Figure 1.
Figure 1: Hypothetical model of structural equation.
By fitting the hypothetical model with the sample
data, the results show that the hypothetical model can
converge and be identified. However, the fitting
between the model and the data is so poor that the
model needs to be further modified. According to the
modified indexes, we find that there is a large co-
variant correlation between the residuals of e1 and e6,
e9 and e13, e5 and e9. Therefore, a two-way con-
nection is established in sequence, and the model is
refitted. In the end, the model shows convergence,
and the overall model fitting test statistics
2
χ
=64.958, p=0.277>0.05, indicating that the modified
model fits the data well. Besides, the variance of each
residual term in the non-standardized model is posi-
tive. In the standardized model, the absolute value of
each standardized path coefficient is not greater than
1, and the symbol is consistent with the theoretical
expectation, indicating that of the modified model is
good-fitting. The modified model and standardized
path coefficients are shown in Figure 2.
PMBDA 2022 - International Conference on Public Management and Big Data Analysis
174
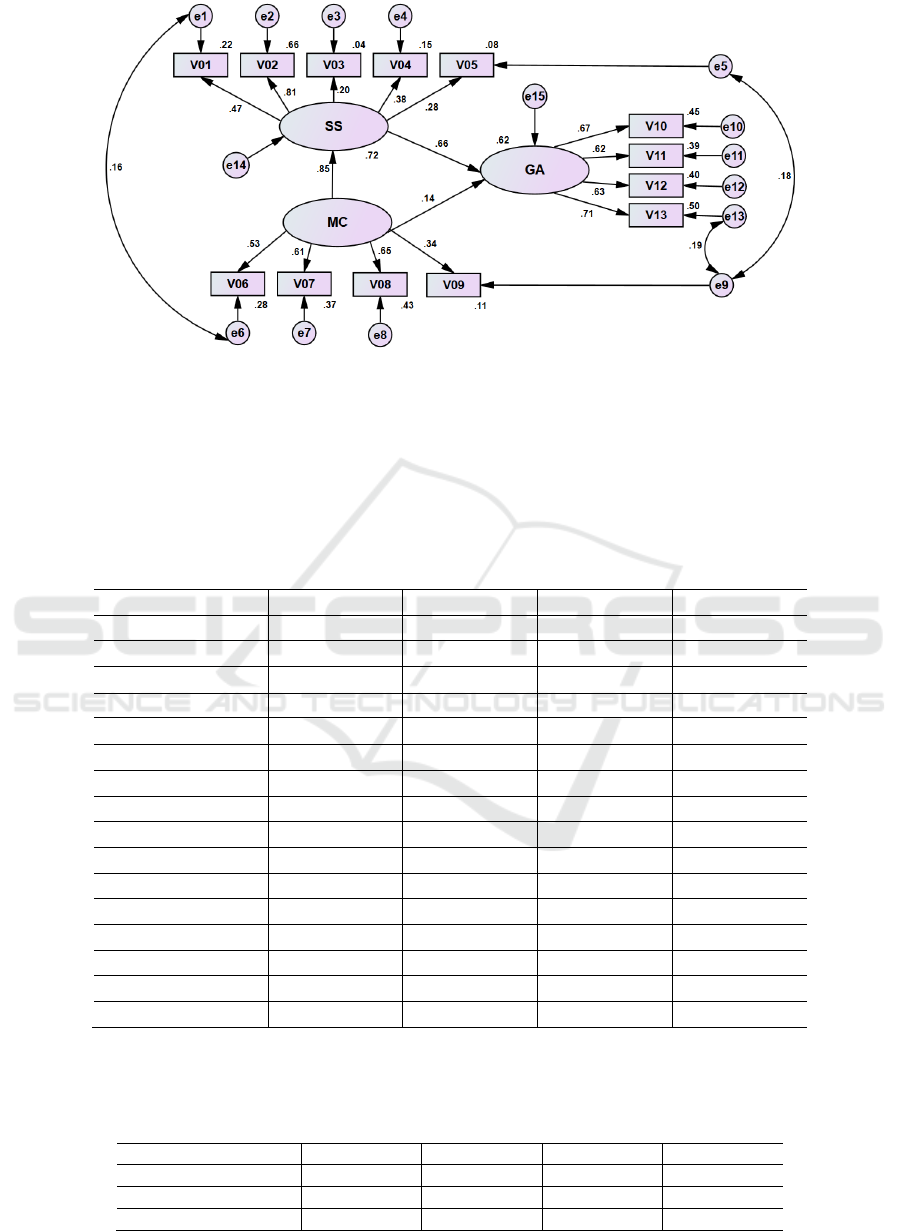
Figure 2: Structural equation modified model and standardized path coefficients.
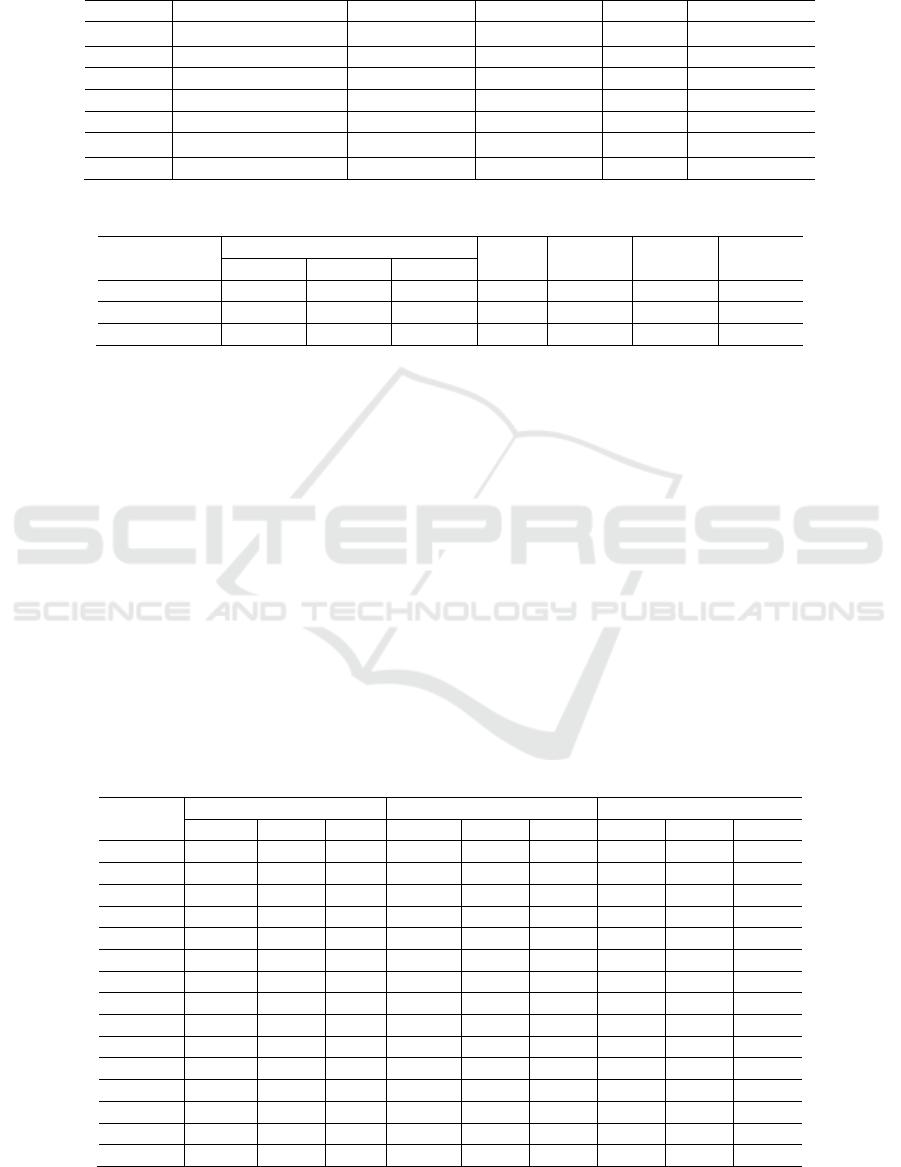
Table 4 shows the non-standardized path coeffi-
cients and significance test. The first column is the
non-standardized direct path coefficient, the second
is the standard error of parameter estimation, and the
third is the test statistic, critical ratio (C.R.). If
C.R.>1.96, it means that the path coefficient is sig-
nificant at the level of 0.05. It can be seen from Table
4 that only the path coefficient of the 3rd group is not
very significant, and each p-value of other coeffi-
cients is less than 0.05, indicating that the path in-
fluence coefficients of the model are generally sig-
nificant.
Table 4: Non standardized regression coefficients and significance tests.
Estimate S.E. C.R. P
SS <--- MC .599 .099 6.029 ***
GA <--- SS .849 .306 2.771 .006
GA <--- MC .126 .205 0.616 .358
V01
<--- SS 1.000 ----- ----- -----
V02
<--- SS 1.784 .242 7.376 ***
V03
<--- SS .401 .133 3.023 .003
V04
<--- SS .846 .163 5.180 ***
V08
<--- MC 1.000 ----- ----- -----
V09
<--- MC .447 .089 5.010 ***
V07
<--- MC .856 .104 8.188 ***
V06
<--- MC .795 .108 7.358 ***
V10
<--- GA 1.000 ----- ----- -----
V11
<--- GA .946 .104 9.069 ***
V12
<--- GA .988 .108 9.135 ***
V13
<--- GA 1.050 .106 9.946 ***
V05 <--- SS .558 .138 4.053 ***
Table 5 shows the covariance and significance
test of the 3 residual groups of e1 and e6, e9 and e13,
e5 and e9, and each of the correlation is significant at
the probability level of 0.05.
Table 5: Residual covariance and significance test.
Estimate S.E. C.R. P
e1 <--> e6 .140 .054 2.581 .010
e5 <--> e9 .156 .050 3.112 .002
e9 <--> e13 .115 .039 2.963 .003
Research on the Influence of Community Service Level and Management System on Residents’ Awareness of Community Governance
175
Further, each fitting index of the modified model
is evaluated, and the output results are shown in
Table 6 and Table 7.
Table 6: Summary of fitting indexes in the modified model (1).
Index Value Critical value Index Value Critical value
CMIN
64.958(p=0.277)
p>0.05 CMIN/DF 1.101 1-3
RMR 0.035 <0.05 RMSEA 0.018 <0.05
GFI 0.970 >0.90 NFI 0.927 >0.90
AGFI 0.954 >0.90 RFI 0.904 >0.90
PGFI 0.629 >0.50 IFI 0.993 >0.90
PNFI 0.702 >0.50
TLI(NNFI)
0.990 >0.90
PCFI 0.751 >0.50 CFI 0.993 >0.90
Table 7: Summary of fitting indexes in the modified model (2).
Model
NCP
ECVI AIC BIC CAIC
NCP LO90 HI90
Default 5.958 .000 29.786 .407 128.958 249.343 281.343
Saturate
d
.000 .000 .000 .574 182.000 524.347 615.347
Independence 817.925 725.303 917.982 2.908 921.925 970.832 983.832
First of all, it can be seen in Table 6 and 7, chi
square and degree of freedom ratio is between 1 and
3(CMIN/DF=1.101), and the fitting index
RMR<0.05, RMSEA<0.05, GFI>0.90, AGFI>0.90,
and PGFI>0.50 all meet the requirement of the critical
standard. Secondly, several fitting degree indexes
such as NFI, RFI, IFI, TLI and CFI are all more than
0.90, and the two reduced fitting degree indexes
PNFI>0.50 and PCFI>0.50. The non-centralized
parameter, NCP value is small enough and its 90%
confidence interval contains 0, which meets the re-
quirement of the critical standard. Thirdly, the values
of the 4 information standards ECVI (expected review
index), AIC (Akaike information criterion), CAIC
(adjusted ACI) and BIC (Bayesian information crite-
rion) are all smaller than those of the saturation and
independent model at the same time. To sum up, the
commonly used fitting indexes meet the requirement
of the critical standard, and it can be judged that the
modified model fits well. We will further conduct
path analysis.
5 PATH ANALYZING OF
STRUCTURAL EQUATION
MODEL
In order to compare path coefficients between dif-
ferent variables, we use standardized path coeffi-
cients. See Figure 2 for specific coefficients. Table 8
shows the comparison of standardized direct, indirect
and total effect coefficients.
Table 8: Standardized direct coefficients, indirect coefficients and total effect coefficients
Variable
Direct effect coefficient Indirect effect coefficient Total effect coefficient
MC SS GA MC SS GA MC SS GA
SS .848 .000 .000 .000 .000 .000 .848 .000 .000
GA .140 .664 .000 .563 .000 .000 .702 .664 .000
V13 .000 .000 .707 .497 .469 .000 .497 .469 .707
V11 .000 .000 .630 .443 .418 .000 .443 .418 .630
V12 .000 .000 .624 .439 .414 .000 .439 .414 .624
V10 .000 .000 .670 .471 .445 .000 .471 .445 .670
V06 .528 .000 .000 .000 .000 .000 .528 .000 .000
V07 .611 .000 .000 .000 .000 .000 .611 .000 .000
V09 .337 .000 .000 .000 .000 .000 .337 .000 .000
V08 .652 .000 .000 .000 .000 .000 .652 .000 .000
V05 .000 .279 .000 .237 .000 .000 .237 .279 .000
V04 .000 .384 .000 .326 .000 .000 .326 .384 .000
V03 .000 .119 .000 .169 .000 .000 .169 .119 .000
V02 .000 .810 .000 .687 .000 .000 .687 .810 .000
V01 .000 .472 .000 .401 .000 .000 .401 .472 .000
PMBDA 2022 - International Conference on Public Management and Big Data Analysis
176

It can be seen from Figure 2 and Table 8 that
among the 5 observable variables of the latent varia-
ble "service level satisfaction"(SS), the most influ-
ential is "convenience service"(V02), and its direct
path coefficient has reached 0.810, which shows that
whether residents are satisfied with the community
service largely depends on whether the community
provides convenient services such as "vegetable
distribution", "express delivery" and "housekeeping".
The second is "entrance service"(V01), with a coef-
ficient of 0.472, indicating that residents still attach
great importance to entrance management, especially
under the normalization of the epidemic. The third is
"sanitation and greening"(V04), which is an obvious
aspect of community service, with a coefficient of
0.384.
Among the 4 observable variables of "manage-
ment system cognition"(MC), the most influential is
the cognition of "environment management"(V08),
and the direct path coefficient has reached 0.652,
indicating that residents' cognition of community
management is first reflected in whether the man-
agement system of garbage classification and public
space is perfect, which residents can feel every day.
The second is "safety management"(V07), with a
coefficient of 0.611, which also has a high level,
indicating that residents' safety awareness is rela-
tively strong. In addition, under the epidemic, resi-
dents also have a high cognition of the "epidemic
prevention management"(V06), and the coefficient
reaches 0.528.
Among the 4 observable variables of "community
governance awareness"(GA), the direct path coeffi-
cients are all above 0.6. The order is "governance
behavior"(V13), "governance willingness"(V10),
"social value"(V11) and "self-enhancement"(V12),
which shows that residents' good awareness of
community governance is reflected in their subjective
will and objective behavior, and meanwhile there is a
positive value judgment on participating in commu-
nity governance.
In the path relationship between the 3 latent var-
iables, the direct effect coefficient of "management
system cognition"(MC) on "service level satisfac-
tion"(SS) is as high as 0.848, which shows that in the
view of residents, the improvement of community
management system is of decisive significance to
improve service level. The coefficient of "service
level satisfaction"(SS) on "community governance
awareness"(GA) also has a high level, which is 0.664,
and the impact is significant, indicating that the
community service level has a great impact on resi-
dents' willingness to participate in community gov-
ernance.
The direct effect of "management system cogni-
tion"(MC) on "community governance aware-
ness"(GA) is not so high, with a coefficient of 0.140,
and the statistical test is not significant. But through
the intermediary role of "service level satisfac-
tion"(SS), the indirect path coefficient of MC on GA
reaches 0.563, and the sum of the two makes the total
effect coefficient reach 0.702, which has a very ob-
vious impact. This shows that whether the commu-
nity management system is perfect or not have little
impact on Residents' awareness of community gov-
ernance. Only through the intermediary role of
community service level, let people experience the
improvement of service level, can it be deeply rooted
in the hearts of the people and stimulate residents'
awareness of participating in community governance.
6 MAIN CONCLUSIONS AND
POLICY SUGGESTIONS
Based on the above analysis, the main conclusions
are as follows.
(1) Higher community service level has a direct
positive effect on improving residents' participating
in community governance. Convenience service is
the most important aspect that affects the satisfaction
of community service. Whether the convenient ser-
vices in the aspects of "vegetable distribution", "ex-
press delivery" and "housekeeping service" are in
place will directly affect the residents' satisfaction
with the overall service of the community.
(2) The management system has a great direct
effect on the service level, and the perfect manage-
ment system determines the higher service level.
However, the management system has no obvious
direct effect on residents' awareness of participating
in community governance, but has a strong indirect
impact through the intermediary role of service level,
so the total effect is also at a high level. Research
shows that residents' cognition of the environment
management system is the most important aspect to
reflect the community management system. When
the community improves various governance
measures, it is particularly necessary to strengthen the
management of public space environment such as
garbage classification and vehicle parking. At the
same time, residents also have a high cognition of the
institutional requirements of "safety management"
and "epidemic prevention management", which re-
flects that in community governance, safety and
health management are closely related to people's
lives.
Research on the Influence of Community Service Level and Management System on Residents’ Awareness of Community Governance
177

(3) Residents' awareness of community govern-
ance has high path coefficients in the 4 aspects of
"governance behavior", "governance willingness",
"social value" and "self-enhancement". It shows that
to enhance residents' awareness of community gov-
ernance, we need to do a good job in the management
of "people", to be "people-oriented" and from the
perspective of residents.
In view of the above conclusions, we put forward
the following suggestions.
(1) Improve the service level of the community
itself, and expand the items of community autonomy
services. Strengthen publicity, enhance residents'
awareness of participating in community governance,
gather consensus, and strengthen the value concept of
shared governance. For example, by holding a variety
of cultural, sports, entertainment and other group
activities or public welfare activities such as
fund-raising and publicity, residents can be guided to
actively participate, create a good atmosphere of
public order and good customs, enhance community
cohesion, and enhance residents' sense of belonging.
(2) Improve the management mechanism, espe-
cially the community self-government management
system, and promote the institutionalization, stand-
ardization and procedure of residents' participating in
community governance. Provide better policy and
institutional guarantees for residents' participating in
community governance, unblock residents' autono-
mous service channels, stimulate residents' sense of
community ownership and responsibility, encourage
residents to give full play to their own advantages,
establish various forms of group organizations, and
introduce social organizations when necessary, so as
to organize residents to effectively participate in
community governance.
(3) Introduce incentive mechanism and attach
importance to interest drive. Only by linking resi-
dents' participating in community governance with
their own interests can their autonomous behaviors be
sustainable. Residents' participating in community
security, neighborhood rescue, community environ-
ment governance and other autonomous behaviors
can be recognized by publicity or certain material
rewards.
(4) Do a good job in community training and
talent mining. At present, residents' participating in
community governance is mostly limited to low-level
community affairs such as public cultural activities
and voluntary services, while their willingness to
participate in relatively high-level management af-
fairs involving public security, environmental gov-
ernance, greening, political activities and so on is
low. We should strengthen community education and
publicity, organize targeted community training, and
improve residents' autonomous management ability.
At the same time, we should tap all kinds of profes-
sionals in education, law, medical treatment, safety
management and other aspects among residents, and
encourage these residents to effectively participate in
higher-level community governance.
FUND PROJECT
2020 research on the construction of first-class un-
dergraduate major in Statistics (Project No.:
108051360022XN522)
REFERENCES
Jianwei Li, etc. Development achievements, problems and
suggestions of China's community service industry[J].
Economic aspect, 2021 (05),48-60.
Juan Pang. Analysis on Influencing Factors of satisfaction
with new rural community governance[J]. Guangxi
social sciences, 2017 (04), 21-25.
Keqiang Ren. Modern transformation of government led
urban grass-roots governance mode[J]. Nanjing social
sciences, 2021 (03), 64-70.
Qingqing Zhu. Visual analysis of social organizations'
participation in community governance[J]. Social sci-
entist, 2021 (06), 107-111.
Wenhao Zhuo, etc. Model construction of influencing
factors of community participatory governance[J].
Administrative forum, 2020, 27 (06), 116-121.
Yaoyao Shi, Yuping Song. Ideas of community empow-
erment to promote the efficiency of community gov-
ernance[J]. Leadership science, 2021 (06), 19-21.
PMBDA 2022 - International Conference on Public Management and Big Data Analysis
178
