
Research on Fresh Produce Simultaneous Delivery and Pickup
Vehicle Path Optimization
Jun Wan
a
and Jingru Wang
b
School of Marketing Management, Liaoning Technical University, Huludao 125105, China
Keywords: Simultaneous Delivery and Pickup, Ant Colony System Genetic Algorithm, Fresh Produce, Vehicle Path.
Abstract: To address the two-way circulation problem of pickup and delivery of fresh agricultural products arising
from the perishable characteristics of fresh agricultural products, a fresh agricultural products simultaneous
delivery and pickup vehicle path optimization model is constructed with the goal of total cost optimization
based on the start-up cost, transportation cost, carbon emission cost and time penalty cost of vehicles in the
distribution process. To solve the problem that the ant colony algorithm is robust but easy to fall into local
optimum, it is combined with genetic algorithm to improve the global search ability, and the proposed ant
colony genetic algorithm's move probability selection rule, pheromone transfer strategy and crossover
operator are improved to solve the model. The model and algorithm are simulated through examples, and
the experimental results show that the optimized model and hybrid algorithm can propose a cost-optimal
solution that can improve the vehicle loading rate while ensuring customer satisfaction, and can provide a
reference for logistics companies to make vehicle path decisions for fresh produce delivery and pickup.
1 INTRODUCTION
1
Fresh agricultural products have high moisture
content and are affected by temperature and
humidity in the air, and are prone to spoilage and
deterioration during storage (e.g. Zhou, 2022). The
perishable nature of fresh agricultural products
determines that in real life, customers not only have
the demand for delivery, but also the demand for
picking up unsold agricultural products due to the
decline of freshness, so the two-way flow of picking
up and delivering obviously has stricter
requirements for fresh agricultural products cold
chain logistics distribution.
The vehicle routing problem with simultaneous
delivery and pickup (VRPSDP) describing the
characteristic was first proposed by Min (1989),
considering the pickup demand at each customer
point on the basis of fresh agricultural products cold
chain logistics distribution. Sebastian et al (2018)
considered the delivery and pickup distribution path
optimization problem with simultaneous delivery
and pickup and demand divisible in different cases
such as cluster backhaul, mixed route backhaul and
a
https://orcid.org/0000-0001-9609-9460
b
https://orcid.org/0000-0002-2999-9407
backhaul, and proposed lateral loading and dividing
the loading space into separate compartments for
long-haul and backhaul customer shipments.
Henriette et al (2018) developed a simultaneous
delivery and pickup distribution model with time
windows and 3D loading constraints for the
warehouse-to-customer simultaneous delivery and
pickup problem, and solved it using a hybrid
algorithm of adaptive large domain search and
heuristic algorithms. (Li et al., 2021) solved the
distribution path problem for the combination of
enterprise forward logistics distribution and scrap
recycling by using a hybrid optimization algorithm
combining simulated annealing and adaptive
large-scale domain search (SA-ALDS). (Yao et al.,
2019) constructed a single distribution center
urban-rural two-way logistics distribution model
with distribution cost, time window and vehicle
empty rate as the objective functions based on the
assumption that consumer goods and agricultural
products can be transported in a mixed way, and
solved it by genetic algorithm. Most domestic and
foreign scholars have applied the simultaneous
delivery and pickup path problem to material
distribution and packaging or scrap recycling, and
less research has been conducted in the cold chain
logistics of fresh agricultural products. A rare study
Wan, J. and Wang, J.
Research on Fresh Produce Simultaneous Delivery and Pickup Vehicle Path Optimization.
DOI: 10.5220/0012071500003624
In Proceedings of the 2nd International Conference on Public Management and Big Data Analysis (PMBDA 2022), pages 161-171
ISBN: 978-989-758-658-3
Copyright
c
2023 by SCITEPRESS – Science and Technology Publications, Lda. Under CC license (CC BY-NC-ND 4.0)
161

that considered the pickup and delivery operations
of fresh produce proposed two distribution methods:
the pickup and delivery separation service method of
unified pickup followed by unified delivery and the
simultaneous pickup and delivery mode. The results
of the research show that the vehicle space is not
well utilized and the distance traveled by the vehicle
increases in the pickup and delivery separation mode,
while the simultaneous pickup and delivery service
mode can circumvent these problems well (e.g. Ji
and Zhang, 2019).
In terms of vehicle path distribution optimization
algorithms, some scholars have used heuristic
algorithms to solve VRP and achieved good results
(e.g. Haitam and Najat (2021), Puspitasari and
Kurniawan (2021) and Ma et al. (2021)). Other
scholars proposed the genetic ant colony algorithm
(GAA) (e.g. Ding et al., 2003) and ant colony
system genetic algorithm (ACSGA) (e.g. Mao et al.,
2006) to integrate the advantages of ant colony
algorithm and genetic algorithm. The ACSGA
circumvents the inconvenience caused by the
genetic ant colony algorithm that requires multiple
experiments to determine the alternation time of the
algorithm, and has its unique superiority.
Considering that the freshness of fresh agricultural
products will increase the carbon emission of the
cold chain distribution process, in order to comply
with the policy of energy saving and emission
reduction in China and ensure the freshness of
agricultural products, we construct a fresh
agricultural products cold chain logistics
simultaneous delivery and pickup distribution model
considering carbon emission and time window, and
solve the model by using ant colony system genetic
algorithm. The research is done to enrich the
research on fresh agricultural products cold chain
logistics and to provide reference for logistics
companies to carry out simultaneous delivery and
pickup logistics and distribution services for fresh
agricultural products.
2 PROBLEM DESCRIPTION
Due to the high cost of logistics infrastructure
construction, logistics companies are restricted by
costs and will not build multiple distribution centers
(e.g. Fang et al., 2019). According to the circulation
mode of fresh agricultural products with wholesale
market as the distribution center, this paper studies
the problem of single distribution center fresh
agricultural products cold chain logistics with
simultaneous delivery and pickup distribution paths,
where refrigerated vehicles loaded with fresh
agricultural products depart from the distribution
center to each customer demand point for delivery,
while recovering unsold agricultural products at
each node due to decreasing freshness and returning
to the distribution center.
Under the premise of satisfying the customer's
demand for delivery and pickup, how to develop a
vehicle path decision for the distribution center that
minimizes the comprehensive cost consisting of
vehicle fixed cost, transportation cost, carbon
emission cost and time penalty cost under the
constraints of the customer's specified time and
vehicle load is the problem to be solved in this
paper.
3 MODELING
3.1 Model Assumptions
Assumption 1: The location of the distribution
center and each customer's demand node is known,
and the quantity of each customer's delivery and
pickup demand, service time and time window are
known.
Assumption 2: The distribution center has the
same vehicle type, i.e. all agricultural products are
delivered by the same type of vehicle.
Assumption 3: The demand for fresh produce
from each customer is within the maximum full
capacity of the vehicle.
Assumption 4: Each path starts and ends at the
distribution center, and each customer demand node
can only be served by one vehicle.
Assumption 5: The logistics company will pay a
penalty if the vehicle does not deliver the goods
within the time specified by the customer.
Assumption 6: Each kind of fresh produce can be
mixed, i.e., it can be loaded and delivered by the
same refrigerated vehicle.
3.2 Analysis of Known Parameters and
Decision Variables
(1) The known parameters are shown in Table 1.
PMBDA 2022 - International Conference on Public Management and Big Data Analysis
162
Table 1: Description of VRPSDP problem parameters.
Symbols Description
N
collection of distribution centers and customer demand points
N
i
collection of customer demand points, i
∈
{1,2,…,n}
N
0
d
istribution cente
r
K
collection of serviceable vehicles at distribution centers,
K
={1,2,…,m}
f
k
fixed costs for using a distribution vehicle
c vehicle unit transportation cost
D
i
delivery volume of customer point i
P
i
pickup volume of customer point i
Q
refrigerated truck rated capacity
Q
ij
the weight of the cargo carried by the reefer truck travels from customer point i to customer point j , i,
j
∈
N
i
d
ij
d
istance of reefer truck from customer i to customer
j
unit time penalty cost for vehicles arriving at customer i before the earliest time (ET
i
)
unit time penalty cost for vehicles arriving at customer i before the latest time (LT
i
)
S
i
service hours for customer i
v carbon taxes
ω
carbon emission factor
(2) The decision variables are analyzed as
follows.
1 vehicle drives from customer point to customer point
0or else
ijk
kij
x
=
,
,
When vehicle k transports cargo from customer
point i to customer point j, that is, x
ijk
is 1 when the
vehicle passes through path (i, j) and 0 otherwise.
1 the demand of customer is satisfied by vehicle
0 or else
ik
ik
y
=
,
,
When the demand of customer i is satisfied by
vehicle k, y
ik
is 1, otherwise it is 0.
(3) Derivative variables
St
i
denotes the start time of service at customer
point i; T
ij
denotes the time spent by the reefer truck
from customer point i to customer point j; Q
0k
denotes the loading of vehicle k when it departs
from the distribution center; Q
ik
denotes the loading
of vehicle k when it leaves customer i, i ∈{1,2,...,n}.
3.3 Model Building
(1) Vehicle fixed costs (C
1
)
The fixed costs required for vehicle activation
generally include staff salaries, vehicle depreciation
and maintenance costs, etc. As shown in equation
(1).
1
mn
0jk
k
k=1 j=1
f
Cx
=
(1)
In Eq. (1),
1
0jk
x
=
when vehicle k leaves the
distribution center for delivery to node j, otherwise it
is 0.
(2) Vehicle transportation cost (C
2
)
Vehicle transportation cost mainly refers to the
cost of fuel consumption in transit, which is related
to the distance traveled by the vehicle, and can be
expressed as equation (2) according to the research
content of this paper.
2
10 0
mn n
ij ijk
ki j
c
Cdx
== =
=
(2)
(3) Carbon emission cost (C
3
)
Vehicles consuming fuel in the distribution
process will produce CO
2
gas, and distribution
centers need to pay for the environmental pollution
caused by the emission of CO
2
gas. In a study of the
relationship between carbon emissions and climate,
Ottmar (2014) proposed that carbon emissions = fuel
consumption * CO
2
emission factor.
Fuel consumption is usually calculated using the
load estimation method (e.g. Kang et al., 2019). The
maximum vehicle load is Q. The fuel consumption
per unit distance traveled when the vehicle is empty
is
ρ
0
, and the fuel consumption per unit distance
traveled when it is fully loaded is
ρ
*. There is a
certain linear relationship between fuel consumption
and vehicle load, and the fuel consumption per unit
distance traveled when the vehicle is loaded with A
can be expressed by equation (3).
*
0
0
A A
Q
ρρ
ρ
ρ
−
=+()
(3)
The carbon emissions generated during the
distribution process of the vehicle from the
Research on Fresh Produce Simultaneous Delivery and Pickup Vehicle Path Optimization
163

distribution center to each customer point, if the
goods with a cargo capacity of Q
ij
are delivered from
customer point i to customer point j, can be
expressed as:
1
()
ij
ij
Q
d
E
ωρ
=
(4)
The carbon emission cost under the carbon tax
mechanism is expressed as: carbon emission cost =
carbon tax *carbon emission. Let the carbon tax be v,
and the total carbon emission cost C
3
of the vehicle
in the distribution process is:
3
001
()
nnm
ij ijk
ij
ijk
v
Q
Cdx
ωρ
===
=
(5)
(4) Penalty Cost (C
4
)
The customer agrees with the distribution center
on the delivery time when placing an order. If the
vehicle dispatched by the distribution center does
not deliver the goods within the agreed time of the
customer, the customer will pursue the responsibility
according to the right, that is, the distribution center
needs to deliver the corresponding penalty C
4
.
{
}
{
}
41 2
11
,0 ,0
nn
jjjj
jj
max max
CStSt
ET LT
εε
==
=−+−
(6)
In summary, the fresh produce simultaneous
delivery and pickup vehicle path optimization model
constructed in this paper is:
{}
{}
1234
10 0
001
1
1
2
1
()
,0
,0
mn mnn
0jk ij ijk
k
k=1 j=1 k i j
nnm
ij ijk
ij
ijk
n
j
j
j
n
j
j
j
minZ
CC CC
c
f
x
dx
v
Q
dx
max
St
ET
max
St
LT
ωρ
ε
ε
== =
===
=
=
=+++
=+
+
+−
+−
(7)
s.t.
1,
k
ij
iNkK
jN
x
∈∈
=∀∈
(8)
00
1,
kk
ji
jN iN
kK
xx
∈∈
==∀∈
(9)
10,
0
,
nn
k
i
j
ijji
i
k
kK
Q
x
D
==≠
∈
=
(10)
(1)
,
ii
ik i k
iN
QQ
DP
−
∈=−+
(11)
,,
ik
Qi Nk K
Q
≤∈ ∈
(12)
,,
,,
ii i
ij
ii
j
iii
ij
i
SETStLTiN
tS
T
S
t
ET St ET i N
S
T
++ < < ∀∈
=
++ ≤ ∀∈
(13)
Equation (7) is the objective function; constraint
(8) indicates that each customer point can only be
served by one vehicle; constraint (9) indicates that
all refrigerated vehicles depart from the distribution
center and eventually return; constraint (10)
indicates that the loading of a vehicle when it
departs from the distribution center is the sum of the
delivery volume of all customer points on a certain
path; constraint (11) indicates that the loading of a
vehicle when it leaves a certain customer = loading
when it leaves the previous customer point - its own
delivery volume + its own pickup volume; constraint
(12) ensures that the vehicle is not overloaded at any
moment in the distribution service; constraint (13)
indicates that the vehicle delivers and picks up the
goods within the time window of the customer point.
4 DESIGN OF ANT COLONY
SYSTEM GENETIC
ALGORITHM
The ant colony algorithm is more robust and can be
easily combined with other algorithms, but it also
has the disadvantages of long search time and easy
to fall into local optimum (e.g. Chen et al., 2019).
The cold chain distribution process of fresh
agricultural products studied in this paper is
different from the traditional distribution problem of
decreasing vehicle load, in that there is simultaneous
pickup and delivery, and the vehicle load presents
dynamic irregular changes, which requires a higher
global search capability of the algorithm.
The basic
ant colony algorithm cannot meet the research
conditions. In order to improve the global
optimization-seeking ability of the ant colony
algorithm, the ant colony system genetic algorithm
(ACSGA), combining the ant colony system
algorithm with the genetic algorithm, is proposed to
solve the model. The basic idea of the ant colony
system genetic algorithm is to introduce the genetic
algorithm into the iteration of the ant colony
algorithm system, and the solution obtained by the
ant colony system is used as the initial population of
the genetic algorithm, and the genetic algorithm
evolves for the optimal solution by multiple
iterations.
PMBDA 2022 - International Conference on Public Management and Big Data Analysis
164
4.1 Moving Probability Selection Rules
The ant selects the next client point j for transfer
from client point i by a certain probability selection
rule, which is expressed in equation (14).
[ ( )] [ ( )]
()
[ ( )] [ ( )]
0,
k
ij
ij
k
k
u tabu
iu iu
ij
k
tt
j
tabu
t
tt
p
jtabu
αβ
αβ
η
τ
τη
∈
∈
=
∉
,
(14)
In Eq. (14),
τ
ij
(t) denotes the amount of
information on the path from node i to node j at
moment t;
η
ij
(t)=1/d
ij
is the heuristic function;
α
and
β
denote the information heuristic factor and the
expectation heuristic factor, respectively.
4.2 Pheromone Update Strategy
The residual pheromone of each path will diminish
with time, and when k ants have traveled the full
distance, the pheromone on each pathway needs to
be adjusted as follows.
()(1)()
ij
ij ij
tn t
ρ
τ
ττ
+=− +Δ
(15)
1
m
k
ij
ij
k
τ
τ
=
=Δ
Δ
(16)
ρ
denotes the degree of pheromone
τ
ij
(t)
weakening over time,
ρ
∈ (0,1);
k
ij
τ
Δ
denotes the
pheromone left by ant k between client nodes i and j
in this cycle, which is generally calculated using the
Ant-Cycle model.
()
if the th ant in this cycle passes through
or else
,
Δ=
0
k
M
k
L
ij
kij
t
τ
,
(17)
M denotes the total amount of pheromones
produced by the ant k cycles in one turn, and L
k
denotes the cycle route of the kth ant.
4.3 Adaptation Function
The fitness function is a criterion for evaluating the
merit of the solution in the genetic algorithm and is
set according to the study as shown in equation (18).
Z denotes the objective function cost.
1
=f
Z
(18)
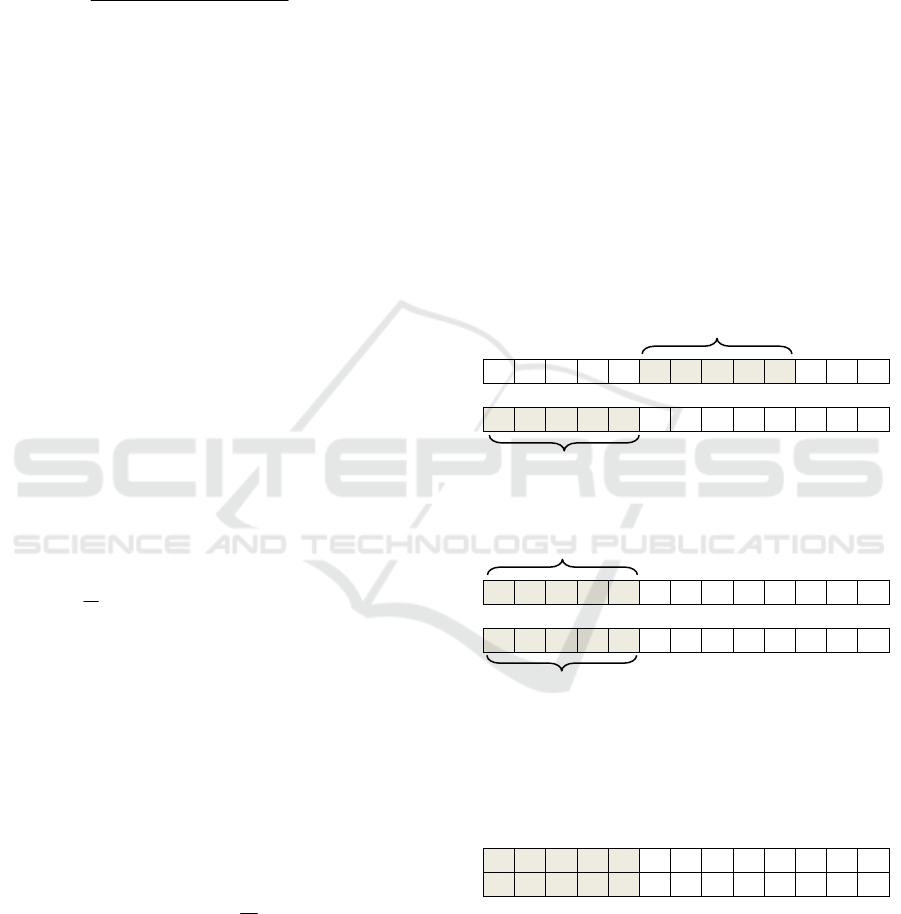
4.4 Crossover Operator Improvement
The crossover operation in the genetic algorithm is
performed by exchanging some genes of two
mutually paired individuals to obtain two new
individuals to improve the algorithm's merit-seeking
ability. Assuming that there are 9 customer nodes, 0
represents the distribution center. This paper adopts
the partial mapping crossover method to improve the
crossover operation. The execution steps are as
follows.
1) Selecting two parent chromosomes and
choosing a complete path at random for each will
result in path 1 and path 2, as shown in Figure 1(a).
2) Precede path 1 and path 2 and remove
duplicate genes, swap the positions of path 1 and
path 2, and get offspring chromosomes 1 and 2, as
shown in Figure 1(b).
3) Perform conflict detection and establish a
mapping relationship between genes of path 1 and
path 2 using the partial crossover method, and map
all genes with conflicts until there is no conflict,
thus forming new offspring chromosomes, as shown
in Figure 1(c).
Paternal chromosome 1
Paternal chromosome 2
0319
7 0 4 2 8 0 6 5 0
0 9 7 5 0 1 2 6 3 0 8 4 0
(a) Randomly selected paths of parental chromosome parts
Offspring chromosome 1
Offspring chromosome 2
0 9 7 5 0 3 1 9 7 0 6 5 0
0 4 2 8 0 1 2 6 3 0 8 4 0
(b) Successive prepending, deleting and swapping
operations on chromosomes
The mapping relationship between the
chromosomal genes generated by paths 1 and 2 is:
9↔4 7↔2 8↔5
Offspring chromosome 1
Offspring chromosome 2
0 9 7 5 0 3 1 4 2 0 6 8 0
0 4 2 8 0 1 7 6 3 0 5 9 0
(c) Partial chromosomal gene mapping crossover
Figure 1: Schematic diagram of chromosome crossover.
4.5 Ant Colony Genetic Algorithm
Process
The hybrid algorithm relies on the global search
ability of the genetic algorithm to determine the
Path 1
Path 2
Path 2
Path 1
Research on Fresh Produce Simultaneous Delivery and Pickup Vehicle Path Optimization
165
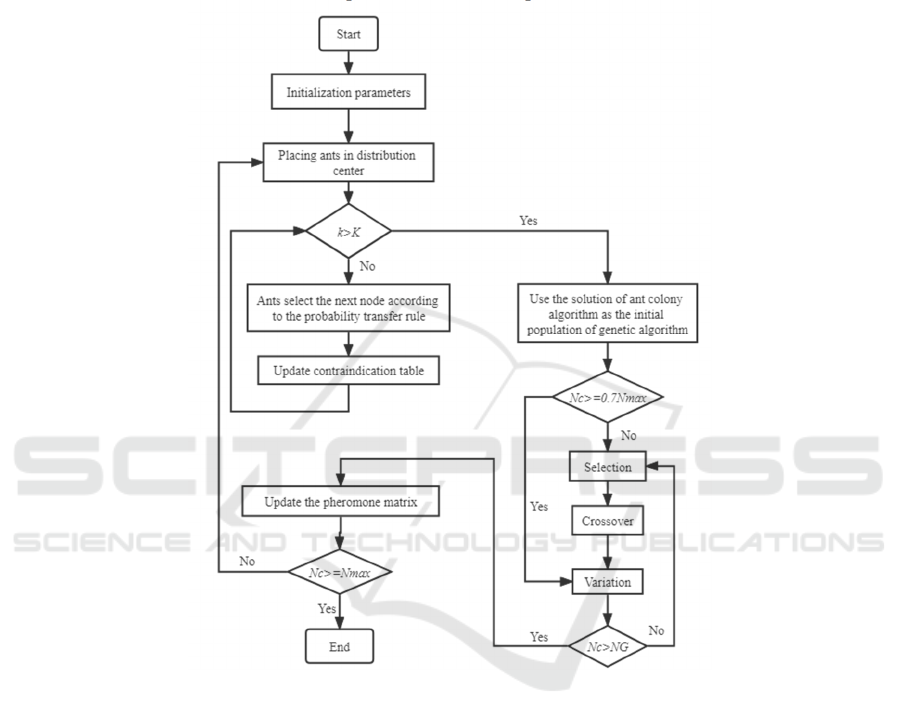
optimal solution range in the early stage of operation,
and mainly relies on the local search ability of the ant
colony algorithm to precisely locate the optimal
solution in the later stage. In order to avoid the
phenomenon of degradation of good individuals
caused by useless iterations of already premature
populations due to the existence of premature
disadvantage of genetic algorithm (e.g. Liang et al.,
2014) the adjustment rule of the number of iterations
is introduced in the hybrid algorithm so that it only
performs mutation operation at the later stage to
improve the convergence speed. The specific
algorithm design flowchart is shown in Figure 2, and
the steps are as follows.
Figure 2: Flow chart of ant colony system genetic algorithm.
Step1: Initialize the parameters, N
c
=0, set the
maximum number of cycles N
max
and the number of
genetic algorithm iterations NG.
Step2: Initialize the ant positions and place K
ants in the distribution center.
Step3: Determine whether a complete path is
formed, if yes, proceed to step 5, if not, proceed to
step 4.
Step4: The ants select the next customer node
according to the movement transfer probability
formula (14) and update the contraindication table.
Step5: The solution obtained from the ant colony
system is used as the initial population of the genetic
algorithm, and then we determine whether
N
c
≥0.7N
max
holds, if it does, proceed to step 7, if it
does not, proceed to step 6.
Step6: The population obtained by the ant colony
algorithm is selected and crossed to generate the
new generation of individuals.
Step7: Perform mutation operation on the
population to generate new generation of
individuals.
Step8: Determine whether the genetic algorithm
reaches the set maximum number of iterations NG,
if yes, proceed to step 9, otherwise return to step 6.
Step9: Update the pheromone matrix according
to the pheromone update strategy formula (15).
Step10: Determine whether the algorithm
reaches the maximum number of cycles N
max
, if yes,
output the optimal solution and end the algorithm, if
not, return to step 2.
PMBDA 2022 - International Conference on Public Management and Big Data Analysis
166
5 SOLVING AND ANALYSIS OF
ALGORITHMS
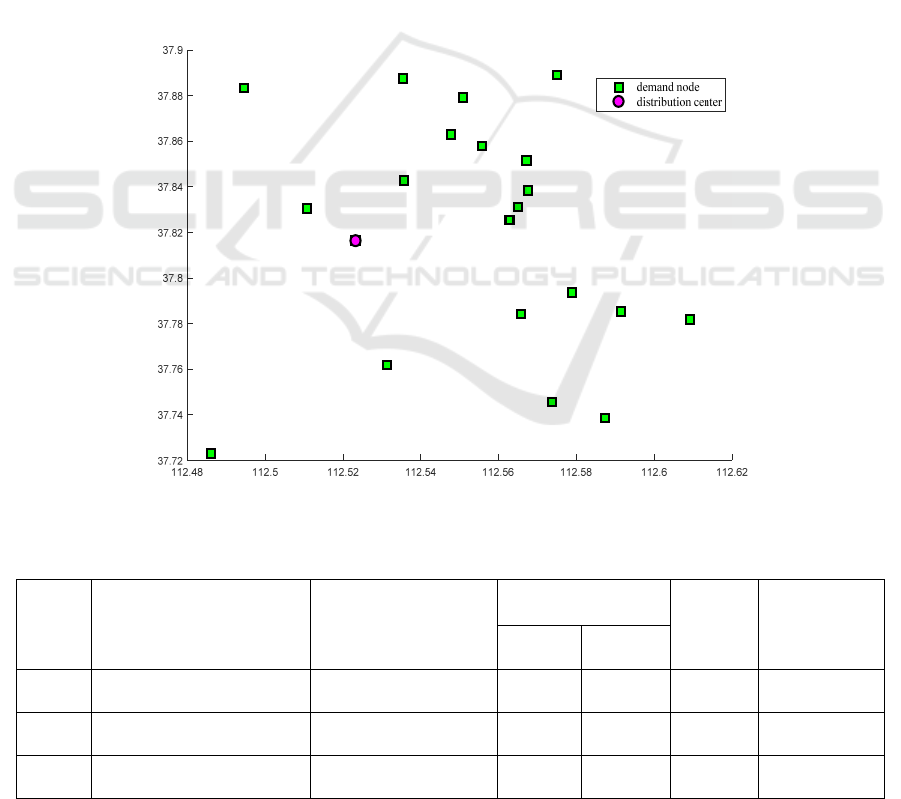
In order to verify the effectiveness of the ant colony
system genetic algorithm, the distribution task of
one day in Taiyuan city R.Q fresh fruit wholesale
distribution center is used as an example for solution
testing. The distribution center is responsible for
supplying the fresh fruit counters of large
supermarkets such as Metropolis, Wal-Mart and
Wang, F.-J Department Store in Taiyuan. 20
supermarkets served by the distribution center are
selected and the coordinate locations are obtained in
the map, as shown in Figure 3.
The refrigerated truck departs from R.Q fresh
fruit distribution center at 6:00 a.m., and delivers the
fruits and vegetables to the customer within the
specified time, and sends some of the customers'
fruits and vegetables that need to be recycled back to
the distribution center for secondary processing due
to the decline in freshness, and the vehicle will be
fined 50 or 100 RMB per hour if it delivers the goods
earlier or later than the specified time. Reefer start-up
cost is 150 yuan, unit transportation cost is 4 yuan
per kilometer, maximum load capacity is 3.7 tons,
fuel consumption is 0.165 and 0.377 liters per
kilometer when empty and full load respectively;
considering the city 7:00 a.m. to 9:00 a.m. for traffic
congestion, the vehicle speed is calculated at 30 km/h
throughout; CO
2
emission factor is 2.63 kg per liter,
carbon tax is 43 yuan per ton. The location of R.Q
fresh fruit wholesale distribution center and each
customer node is known. The customer specified
time window and delivery-pickup requirements are
shown in Table 2, with the number 0 representing the
distribution center and each customer node numbered
1, 2, ...20 in order, and the Matlab R2015b software
is used to solve the algorithm.
Figure 3: Map location of distribution center and each super node.
Table 2: Information table of R.Q Fresh Fruit Wholesale Distribution Center and the demand for each superstore.
Node
number
Node Name Longitude and Latitude
Delivery and pickup
demand(t)
Service
Time /min
Time Window
Delivery
volume
Pickup
volume
0
R.Q Fresh Fruit Wholesale
Distribution Center
112.523320,37.816424
- - - -
1
Wang, F.-J. Department
Store
112.565022,37.831129 1.20 0.24 20 (6:30-8:30)
2
Wal-Mart (Hutchinson
Fashion Mall)
112.562784,37.825208 0.75 0.00 10 (6:30-8:30)
Research on Fresh Produce Simultaneous Delivery and Pickup Vehicle Path Optimization
167
3 Wal-Mart (Taiyuan S. Road) 112.575213,37.888957 0.75 0.16 15 (7:30-10:00)
4 Metropolis (X.D District) 112.565867,37.784022 0.54 0.00 9 (7:20-10:00)
5
Metropolis (K.Z Ten Mile
City)
112.587438,37.738523 0.80 0.00 12 (7:25-9:40)
6
Metropolis (Crescent Moon
International Store)
112.573819,37.745356
1.42 0.40 20
(7:30-8:30)
7
Metropolis (W.C Mall
Store)
112.567605,37.838313
0.65 0.08 16
(6:20-8:00)
8 Metropolis (Z.E Lane) 112.609162,37.781732 0.40 0.00 8 (6:40-7:40)
9 Metropolis (YZ District) 112.547865,37.863072 0.95 0.20 18 (6:30-8:00)
10
Metropolis (T.Y North Road
Store)
112.550985,37.879256 0.65 0.00 10 (6:30-8:30)
11
Metropolis (Connaught
Street)
112.555893,37.857877
0.80 0.15 15
(7:20-8:20)
12
Metropolis (W.C South
Road)
112.591506,37.785145 1.00 0.35 20 (7:00-9:00)
13 Metropolis (Poly Lily Store) 112.494598,37.883346 0.75 0.00 10 (8:10-10:00)
14
Metropolis (W, B.-L.
District)
112.535420,37.887478
0.60 0.00 10
(6:20-8:30)
15 Metropolis (YJ West Road)
112.510691,37.830578
1.25 0.27 20
(7:00-9:00)
16 Metropolis (JY District)
112.486144,37.722930
1.50 0.32 20
(7:00-9:00)
17 Metropolis (Z.D Branch) 112.531407,37.761645 0.86 0.14 15 (7:30-9:00)
18 Metropolis (YSMZ Store) 112.578954,37.793417 0.70 0.00 10 (6:40-8:00)
19
Metropolis (South Inner
Ring West Street)
112.535699,37.842549 0.55 0.00 8 (6:30-9:00)
20 Metropolis J.F South Store
112.567166,37.851265
0.96 0.24 16
(6:00-8:00)
5.1 Analysis of Results
The proposed optimization model is solved
according to the actual arithmetic example and the
ant colony system genetic algorithm. The number of
ants is set as 6, α=1, β=1, ρ=0.8, the total number of
pheromones is 100, and the number of iterations is
100, resulting in the optimal vehicle distribution
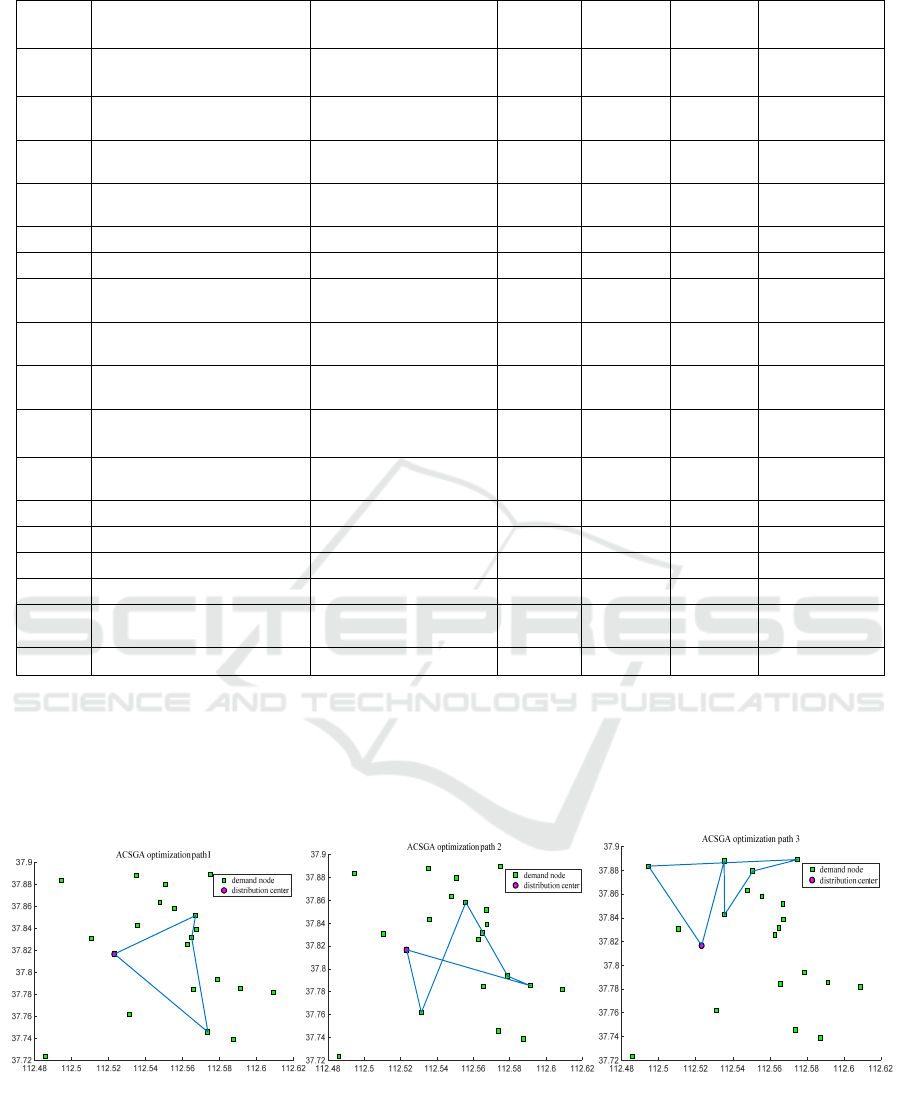
path as shown in Figure 4.
PMBDA 2022 - International Conference on Public Management and Big Data Analysis
168
Figure 4: Ant colony system genetic algorithm vehicle path optimization diagram.
From Figure 4, it can be seen that five
refrigerated trucks are required for distribution using
the ant colony genetic hybrid algorithm to solve the
model. Combined with Table 2 and Figure 3, the
distribution vehicles departed from R.Q fresh fruit
wholesale distribution center, vehicle 1 carried 3.58
tons of fruits and vegetables in order to customers
20, 1, 6 for delivery and pickup service and then
returned to the distribution center; vehicle 2 carried
3.36 tons of fruits and vegetables in order to
customers 12, 18, 11, 17 for delivery and pickup
service and then returned to the distribution center;
vehicle 3 carried 3.3 tons of fruits and vegetables in
order to customers 14, 19, 10, 3, 13 for delivery and
pick-up service and then returned to the distribution
center; vehicle 4 carried 3.34 tons of fruits and
vegetables in order to customers 7, 9, 8, 5, 4 for
delivery and pick-up service and then returned to the
distribution center; vehicle 5 carried 3.5 tons of
fruits and vegetables in order to customers 2, 16, 15
for delivery and pick-up service and then returned to
the distribution center. The total comprehensive cost
was 1422.31 yuan.
5.2 Experimental Comparison
In order to verify the effectiveness of the ant colony
system genetic algorithm, it was solved and
compared with the basic algorithm for the cases
separately, and the total distribution cost and optimal
routes obtained from 10 runs are shown in Table 3.
Table 3: Optimal distribution strategy corresponding to each algorithm.
Algorithm
Optimal distribution
cost (yuan)
Optimal Distribution Path
ACO 1619.76
0➝20➝14➝5➝17➝ 0
0➝2➝1➝0
0➝10➝7➝19➝3➝11➝0
0➝9➝8➝12➝4➝13➝0
0➝16➝15➝0
0➝6➝18➝0
GA 1617.66
0➝20➝1➝6➝0
0➝12➝18➝11➝17➝0
0➝19➝14➝10➝3➝13➝0
0➝7➝9➝8➝5➝4➝0
0➝16➝15➝0
0➝2➝0
ACSGA 1422.31
0➝20➝1➝6➝0
0➝12➝18➝11➝17➝0
0➝14➝19➝10➝3➝13➝0
0➝7➝9➝8➝5➝4➝0
0➝2➝16➝15➝0
Research on Fresh Produce Simultaneous Delivery and Pickup Vehicle Path Optimization
169
As can be seen from Table 3, for the fresh
produce with time window while picking up and
delivering vehicle path optimization problem, both
basic ant colony algorithm and genetic algorithm
need 6 vehicles, and ant colony genetic algorithm
only needs 5 vehicles, from the situation of vehicle
scheduling, ant colony system genetic algorithm can
reasonably allocate vehicles and effectively reduce
the vehicle empty rate; from the comprehensive
optimal cost, the comprehensive cost obtained by
ant colony system genetic algorithm is 1422.31 yuan,
which is nearly 200 yuan less than the basic
algorithm. If based on the same conditions and
number of distribution tasks, using the hybrid
algorithm can save nearly 6000 yuan a month. In
summary, the ant colony system genetic algorithm
designed in this paper is effective in reducing the
vehicle empty rate and the integrated cost.
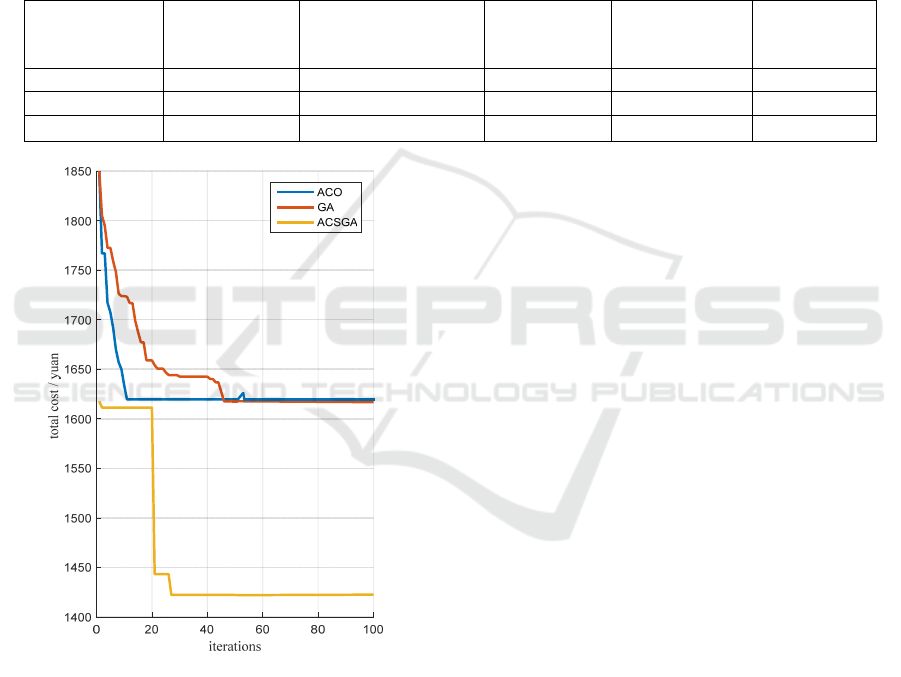
Specifically, the distribution cost components and
convergence curves of each algorithm are shown in
Table 4 and Figure 5.
Table 4: Cost Analysis of Optimal Distribution Solution.
Algorithm
Total
distribution
cost/yuan
Vehicle fixed
cost/yuan
Transportation
cost/yuan
Carbon
emission
cost/yuan
Time penalty
cost/yuan
ACO 1619.75 900 455.27 3.44 261.04
GA 1617.67 900 421.86 3.16 292.65
ACSGA 1422.31 750 427.92 3.37 241.02
Figure 5: Convergence curve.
According to the analysis of distribution cost
composition in Table 4, all the costs of the ant
colony algorithm are higher, and combined with
Figure 5, we can see that the ant colony algorithm is
trapped in the local optimum and difficult to jump
out in the process of finding the best. The carbon
emission cost and transportation cost obtained by the
genetic algorithm are slightly lower than the ant
colony system genetic algorithm, but the local
search ability is weak and the search process is slow
in the late stage of the solution process, the fixed
cost of the vehicle and the time penalty cost are
higher, and the genetic algorithm cannot make full
use of the vehicle space and cannot guarantee
customer satisfaction. The ant colony system genetic
algorithm integrates the advantages of the basic
algorithms, using the global search ability of the
genetic algorithm to lock the optimal solution range
in the early stage of the solution, and using the local
search ability of the ant colony algorithm to find the
optimal solution precisely in the later stage of the
solution. The hybrid algorithm converges faster,
improves the on-time delivery rate while making full
use of the vehicle space, ensures the customer
satisfaction and reduces the comprehensive cost. In
summary, the ant colony system genetic algorithm
designed in this paper can find the optimal solution
faster and ensure customer satisfaction, which is
effective for solving the fresh produce simultaneous
delivery and pickup vehicle path problem.
6 CONCLUSIONS
As the demand for freshness of fresh agricultural
products improves, the short timeliness of fresh
agricultural products determines that important fresh
agricultural products sales entities such as fresh
supermarkets not only have the demand for delivery
but also the demand for recovery of agricultural
products that are not sold in time due to the decline
of freshness. In this paper, we study the optimization
of fresh agricultural products cold chain logistics
PMBDA 2022 - International Conference on Public Management and Big Data Analysis
170

with time windows for simultaneous delivery and
retrieval vehicle paths under the consideration of
energy saving and emission reduction, and construct
an optimization model with the objective function of
minimizing comprehensive cost. In order to improve
the global search capability of the basic ant colony
algorithm, a hybrid ant colony system genetic
algorithm is proposed and the crossover operator is
improved to solve the model. In order to verify the
validity of the model and the algorithm, simulation
experiments are conducted on the actual cases and
the hybrid algorithm is compared with the basic
algorithm. The results show that the constructed
optimization model and the hybrid ant colony
system genetic algorithm can arrive at the lowest
comprehensive cost and the most optimal path,
which can reduce the vehicle empty rate and
improve customer satisfaction at the same time. It is
suitable for solving the problem of simultaneous
delivery and pickup of fresh agricultural products,
and can provide methodological support for logistics
companies to distribute fresh agricultural products,
which has certain practical significance and
reference value.
REFERENCES
Chen, Z., Jiang, Z.-J., Liu, Y., 2019. Research on low
carbon logistics path optimization based on improved
ant colony algorithm for different road sections.
Ecological Economics 35(12):53-59+66.
Ding, J.-S., Chen Z.-Z., Yuan Z.-Z., 2003. Fusion of
genetic algorithm and ant algorithm. Computer
Research and Development 40(9):1351-1356.
Fang, W.-T., Ai, S.-Z., W, Q., Fan, J.-B., 2019. Research
on cold chain logistics distribution path optimization
based on hybrid ant colony algorithm. China
Management Science 27(11):107-115.
Haitam, E., Najat, R., Jaafar, A., 2021. Metaheuristics
methods for The VRP in Home Health Care by
minimizing fuel consumption for environmental gain.
E3S Web of Conferences 234, 94-101.
Henriette, K., Andreas, B., Gerhard, W., 2018. A hybrid
algorithm for the vehicle routing problem with
backhauls, time windows and three-dimensional
loading constraints. OR Spectrum 40(04): 1029-1075.
JI, J.-H., ZHANG, X., 2019. Optimization model and
algorithm for fresh produce distribution path
considering pickup and delivery operations. Journal of
Systems Science 27(01):130-135.
Kang, K., Han, J., Pu, W. et al., 2019. Research on the
optimization of low-carbon distribution path for fresh
agricultural products cold chain logistics. Computer
Engineering and Applications 55(02):259-265.
Li, J., Duan, Y., Hao, L.-Y.et al., 2021. Hybrid
optimization algorithm for solving simultaneous
delivery and pickup vehicle path problems. Computer
Science and Exploration 1-12.
Liang, X., Huang, M., Ning, T., 2014. Modern intelligent
optimization hybrid algorithms and their applications.
Beijing: Electronic Industry Press.
Ma, Y.-F., Li, B.-Y., Yang Y.-F., Feng C.-Y.,
2021.Research on two-level path problem and
algorithm for fresh food delivery under customer
classification. Computer Engineering and
Applications 57(20):287-298.
Mao, N., Gu, J.-H., Tan, Q. et al., 2006. Ant colony
genetic hybrid algorithm. Computer Applications
(07):1692-1693+1696.
MIN H. 1989. The multiple vehicle routing problem with
simultaneous delivery and pick-up points.
Transportation Research Part A: General 23 (5):
377-386.
Ottmar R.-D., 2014.Wildland fire emissions, carbon, and
climate: Modeling fuel consumption. Forest Ecology
& Management, 317(2) 41-50.
Puspitasari, F.- H., Kurniawan, V.-R.-B., 2021. Designing
Optimal Distribution Routes using a Vehicle Routing
Problem (VRP) Model in a Logistics Service Provider.
IOP Conference Series: Materials Science and
Engineering 1071(01):120-131.
Sebastian, R., Andreas, B., Lars, M., 2018. Heuristics for
vehicle routing problems with backhauls, time
windows, and 3D loading constraints. European
Journal of Operational Research 266 (03): 877-894.
Yao, G.-X., Wu, J., Zhu, C.-J.et al., 2019. Research on
urban-rural logistics distribution based on two-way
circulation under fuzzy environment. Business
Economics Research (20):107-109.
Zhou, L.-L., 2022. Expert Forum-Quality Control of
Perishable Fruits and Vegetables. China Fruit and
Vegetable 42(09), 1.
Research on Fresh Produce Simultaneous Delivery and Pickup Vehicle Path Optimization
171
