
Evaluating the Quality of Medical and Health Services by the Method
of Topsis and Linear Interpolation in China
Jiping Zhang
1,* a
, Yuqing Mi
2b
and Haixia Zhang
3c
1
Department of Hospital Infection-Control, Qingdao Jiaozhou Central Hospital, Qingdao, China
2
School of Public Health, Weifang Medical University, Weifang, China
3
Department of Scientific Research and Education, Qingdao Jiaozhou Central Hospital, Qingdao, China
Keywords: Medical Service, TOPSIS Method, Linear Interpolation Method.
Abstract: This study aims to use of TOPSIS method and linear interpolation method to evaluate the work of medical
services in towns and townships, to understand our country in various provinces, cities and towns and
townships, 2016 medical and health services status quo, analysis of regional differences. This study selected
reflected in towns and townships to medical service quality of six indicators, using TOPSIS method and
linear interpolation method in various provinces and cities in the country towns and townships is used to
evaluate medical service quality. Using the SPSS 17.0 software to the ranking results of two methods to do
Spearman correlation analysis and Kruskal Wallis H test.The Spearman correlation analysis and TOPSIS
method and the linear interpolation method, the correlation of evaluation results is higher (r = 0.915, P =
0.000).Two kinds of comprehensive evaluation results sorting, sichuan, henan, guangxi is located in the top
three, shanxi, Inner Mongolia, jilin, after three.Thus this research conclusions: regional differences in towns
and townships throughout the country medical service quality, two kinds of evaluation results is highly
correlation.
1 INTRODUCTION
1
In towns and townships as an important part of the
basic health service system construction, burdened
with a large number of medical and health services,
epidemic prevention, such as maternity care work, in
the protection of peasants health plays an important
role of (Gao 2018). Although grassroots health
workers are accelerating in China, has a certain
regional differences. In towns and townships of our
country is used to evaluate medical service quality is
of great significance to the evaluation result directly
reflect the grassroots medical service level. At
present, the TOPSIS method is limited in systems
engineering solution of multi-objective decision
analysis is a kind of commonly used method, often
used for quality evaluation work of medical
institutions, advantage is that can make full use of
original data information, sorting results intuitive
and reliable (Liu, Chai, Xu, Cai 2018); Linear
a
https://orcid.org/0000-0002-9712-7168
b
https://orcid.org/0000-0002-2923-5618
c
https://orcid.org/0000-0003-2903-2498
interpolation method, according to the average index
of minor sort method is simple, convenient
application, the differences due to different
evaluation method and evaluation results, in order to
ensure objectivity of evaluation results, this study
adopts the TOPSIS method, linear interpolation
method is used to evaluate the national basic
medical service quality, in order to understand our
country in various provinces, cities and towns and
townships, 2016 service present situation and
analyzes the regional differences.
2 DATA AND METHODS
2.1 Source
This research uses the data of national health and
family planning commission, "2017 China statistical
yearbook of health and family planning (National
health and family planning commission 2017).
Zhang, J., Mi, Y. and Zhang, H.
Evaluating the Quality of Medical and Health Services by the Method of Topsis and Linear Interpolation in China.
DOI: 10.5220/0012070500003624
In Proceedings of the 2nd International Conference on Public Management and Big Data Analysis (PMBDA 2022), pages 91-96
ISBN: 978-989-758-658-3
Copyright
c
2023 by SCITEPRESS – Science and Technology Publications, Lda. Under CC license (CC BY-NC-ND 4.0)
91

2.2 Index Selection
Refer to the China statistical yearbook of health and
family planning of towns and townships health
service category, select six representative indicators
of 29 provinces in China in 2016 (the data does not
include Beijing, Shanghai) is used to evaluate the
towns and townships of medical service quality.
Selected indicators are: X1 - sickbed utilization rate
(%), X2 - average (day) of such confinement, X3 -
physicians daily for visits, X4 - physicians daily for
hospital bed, X5 - visits (ten thousand people), X6 -
admissions (ten thousand people).Among them, the
X2 - low average such confinement for optimal
index, the rest for the yields and indicators.
2.3 Comprehensive Evaluation Method
2.3.1 TOPSIS Method
TOPSIS method is based on the normalized after the
original data matrix, calculated to evaluate solutions
and the optimal scheme and the worst, according to
the size of the relative distance evaluation using a
method (Wang, Song, An 2015). list the decision
matrix, namely the original data set: 29 provinces,
six indicators, form a comprehensive evaluation of
the original data table, as shown in table 1.index
with chemokines normalization processing: 100 / (x)
by inverse method yields and index, low optimal
index can be converted to realize with chemokines,
further normalization processing eliminate the
influence of discrete tendency and normalized
matrix values(1):to determine the optimal worst
plan: Z+ = (0.31, 0.28, 0.38, 0.42, 0.52, 0.44), Z- =
(0.05, 0.01, 0.05, 0.01, 0.01, 0.01); D+i, D-i and
proximity Ci: each evaluation objects and the
distance Z+, Z- toD+i, D-i, proximity to Ci, Ci is
close to 1, medical services, the better the
results(2).sorting: according to the Ci value from big
to small order, get medical service level of provinces
and cities, sort the results, as shown in table 2.
=
=
n
i
ij
ij
ij
f
f
z
1
2
'
(1)
=
++
−=
m
j
jiji
ZZD
1
2
)(
,
=
−−
−=
m
j
jiji
ZZD
1
2
)(
,
,,...,1 ni =
DD
D
C
ii
i
i
+−
−
+
=
,
ni
C
i
,...,1,10 =≤≤
(2)
2.3.2 Linear Interpolation Method
Linear interpolation method is essentially actual
value evaluation of each index in the index is the
ratio of the location in the whole distance, finally
according to the evaluated object average minor sort,
(0,1), the bigger value shows that comprehensive
evaluation result more optimal (Li, Wang, Xia,
Zhang, Bai 2015).
Rank: the minimum and maximum parameter
values will be integers, the rest are basically as a
integer. The yields and indicators:(3). For low
optimal indicators: (4).
Calculated the comprehensive rank (5).
The sorting: by RSR values from big to small
order, comprehensive evaluation results by linear
interpolation method, shown in table 4.
X
X
X
X
nR
minmax
min
)1(1
−
−
−+=
(3)
X
X
X
X
R
minmax
max
1n1
−
−
−+= )(
(4)
=
×
=
m
j
ij
i
nm
R
RSR
1
(5)
2.4 Statistical Analysis Methods
SPSS 17.0 software was used to deal with the data
analysis.ɑ = 0.01.
3 RESULTS
3.1 Primary Care Services
Regional differences in towns and townships health
service indicators. Hubei province in towns and
townships sickbed utilization rate is as high as
76.70%, followed by chongqing, xinjiang, Tibet
autonomous region sickbed utilization rate, the
lowest is 28.30%; The highest average such
confinement was in towns and townships, zhejiang
province, is 9.1 days, followed by Shanxi Province
and jiangsu province. Physician burden of daily visits
are highest in Shanghai, followed by the zhejiang
province, tianjin, the lowest is Tibet; Physicians daily
for visits are highest in zhejiang province, the second
is in yunnan province and hainan province.
Physicians, xinjiang province, the highest average
daily take such confinement was followed by
chongqing municipality, sichuan province. In towns
and townships, 2016 visits the most were in henan
province, was hospitalized people most is sichuan
province, as shown in the table 1.
PMBDA 2022 - International Conference on Public Management and Big Data Analysis
92
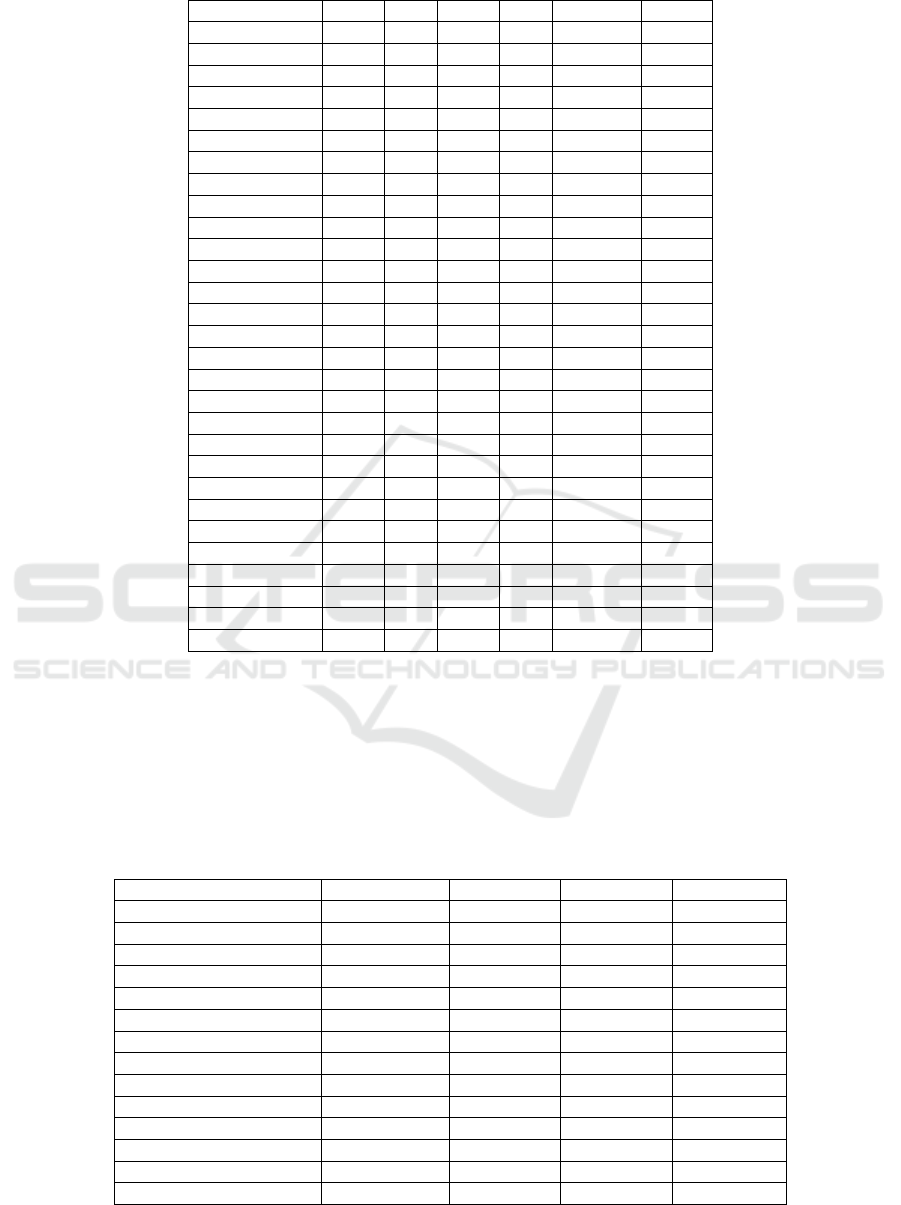
Table 1: Provinces of original index in towns and townships medical services.
Area X1X2X3X4 X5 X6
Tian
j
in 44.00 7.50 11.70 0.80 645.94 7.22
Hebei 58.50 7.20 7.40 1.40 4777.19 168.67
Shanxi 35.10 8.50 6.70 1.10 1603.68 42.65
Inner Mongolia 42.20 6.50 5.50 0.90 1217.01 36.28
Liaoning 44.30 7.60 8.00 1.50 1718.16 55.25
Jilin 28.80 7.50 4.70 0.60 967.24 1.76
Heilon
gj
ian
g
56.60 6.30 4.80 1.45 983.28 66.56
Jian
g
su 63.60 7.60 10.90 1.10 8288.55 163.38
Zhejiang 49.70 9.10 18.00 0.40 9351.85 30.69
Anhui 60.60 6.60 8.80 1.40 4576.62 157.95
Fu
j
ian 49.50 6.10 11.00 1.40 2702.97 82.14
Jian
g
xi 68.70 5.40 8.90 2.20 3228.70 201.88
Shandon
g
60.70 7.30 7.50 1.50 7331.87 273.53
Henan 62.20 7.20 12.50 1.70 11218.47 287.33
Hubei 76.70 7.00 8.10 1.80 5755.85 258.67
Hunan 70.50 6.00 4.60 1.80 4046.01 373.03
Guan
g
don
g
55.20 5.30 8.70 1.00 6690.25 194.48
Guan
g
xi 63.30 5.20 12.00 2.20 5132.05 252.32
Hainan 33.30 6.50 16.50 0.60 1149.72 7.72
Chongqing 74.10 6.70 7.60 2.80 2002.69 153.74
Sichuan 70.70 6.30 11.50 2.50 9372.06 443.28
Guizhou 44.90 4.90 8.70 1.40 2661.97 119.63
Yunnan 53.40 5.80 17.80 2.10 5087.92 140.96
Xizan
g
28.30 5.00 13.40 0.60 413.63 3.70
Shaanxi 46.60 7.30 9.00 1.60 2202.58 75.43
Gansu 60.00 6.40 8.90 1.50 2006.48 67.76
Qinghai 55.10 5.50 6.10 1.20 258.76 11.49
Nin
g
xia 49.10 6.60 13.70 0.60 670.59 4.88
Xin
j
ian
g
74.00 6.10 12.90 2.80 2170.96 101.67
3.2 TOPSIS Method to Comprehensive
Evaluation Results
We Used TOPSIS comprehensive evaluation method
of 29 provinces, cities and towns and townships of
six measures of service. The results are shown in
table 2, the medical service level in the top three,
guangxi, henan, sichuan, after three, respectively,
shanxi, jilin, Inner Mongolia.3.3. Status quo of
incentive satisfaction of urban community nurses in
Shandong Province. evaluation results.
Table 2: Based on TOPSIS method of job evaluation in towns and townships of medical services.
Area D+ D- Ci The sorting
Sichuan 0.151 0.666 0.8151 1
Henan 0.249 0.573 0.6970 2
Guan
g
xi 0.340 0.435 0.5618 3
Shandon
g
0.350 0.436 0.5549 4
Hunan 0.394 0.477 0.5480 5
Hubei 0.365 0.421 0.5357 6
Jiangsu 0.408 0.399 0.4940 7
Yunnan 0.418 0.403 0.4908 8
Guan
g
don
g
0.422 0.359 0.4598 9
Jian
g
xi 0.440 0.365 0.4530 10
Zhejiang 0.546 0.431 0.4410 11
Xinjiang 0.516 0.378 0.4232 12
Chongqing 0.511 0.370 0.4202 13
Hebei 0.469 0.298 0.3887 14
Evaluating the Quality of Medical and Health Services by the Method of Topsis and Linear Interpolation in China
93
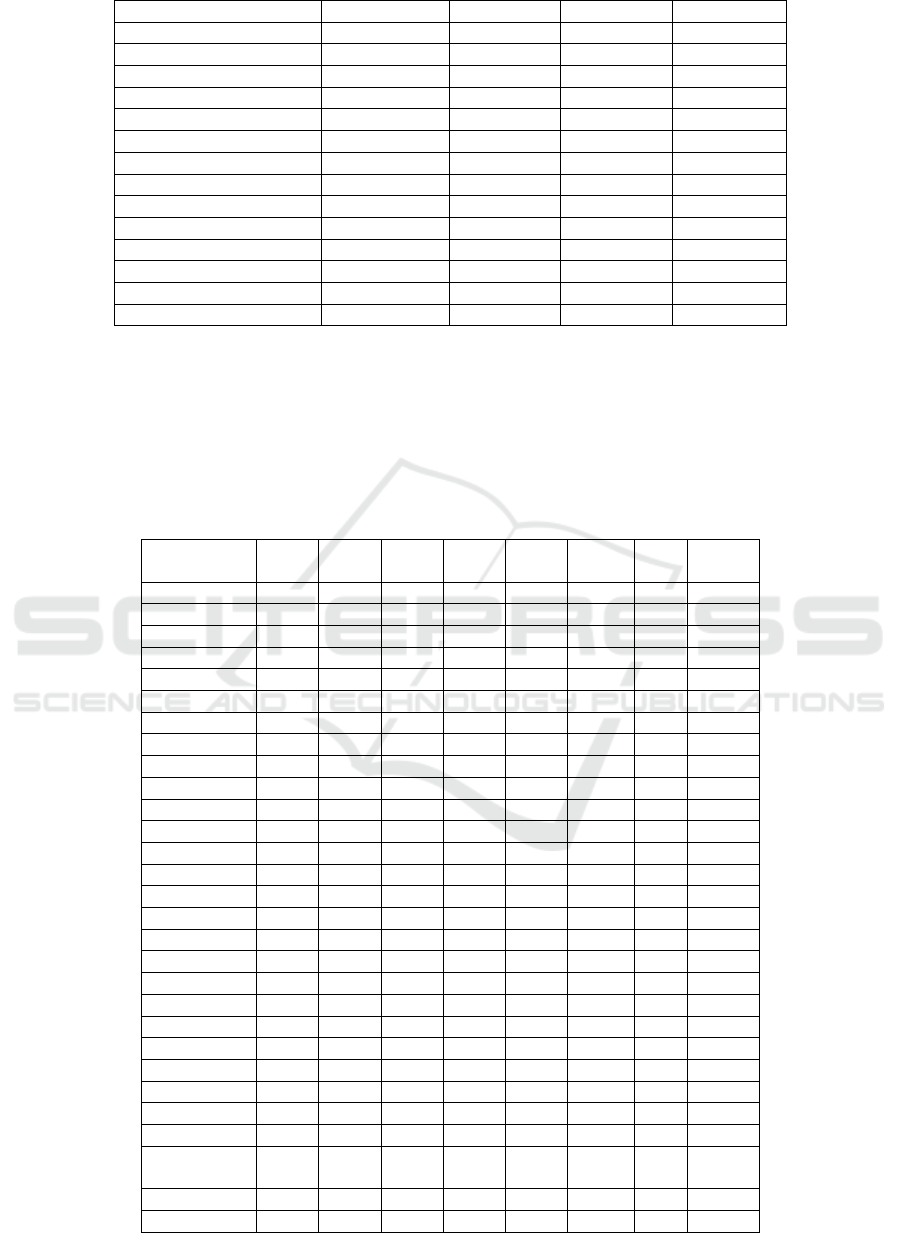
Anhui 0.468 0.296 0.3876 15
Tianjin 0.686 0.381 0.3573 16
Guizhou 0.542 0.238 0.3053 17
Fu
j
ian 0.556 0.225 0.2878 18
Jian
g
su 0.586 0.212 0.2654 19
Shaanxi 0.581 0.204 0.2603 20
Hainan 0.678 0.219 0.2445 21
Liaoning 0.616 0.172 0.2183 22
Heilongjiang 0.637 0.178 0.2183 23
Nin
g
xia 0.686 0.181 0.2090 24
Xizan
g
0.703 0.185 0.2085 25
Qin
g
hai 0.691 0.152 0.1799 26
Shanxi 0.656 0.115 0.1489 27
Jilin 0.730 0.041 0.0527 28
Inner Mon
g
olia 0.673 0.037 0.0518 29
3.3 Linear Interpolation Method,
Comprehensive Evaluation Results
According to the mean value of each evaluation
index of provinces and cities, minor sort, the results
show that the sorting is located in the top three,
respectively is sichuan, guangxi, henan, and after the
three were in Inner Mongolia, shanxi, jilin, as shown
in the table 3.
Table 3: Based on the linear interpolation method, the average size of minor sort of job evaluation in towns and townships
medical services.
Area X1 X2 X3 X4 X5 X6 P
The
sorting
Sichuan 25.53 19.67 15.42 25.50 24.28 29.00 0.80 1
Guan
g
xi 21.25 27.00 16.46 22.00 13.45 16.89 0.67 2
Henan 20.61 13.67 17.51 16.17 29.00 19.11 0.67 3
Yunnan 15.52 23.00 28.58 20.83 13.34 9.83 0.64 4
Xinjiang 27.44 21.00 18.34 29.00 5.89 7.34 0.63 5
Jian
g
xi 24.37 25.67 9.99 22.00 8.59 13.69 0.60 6
Hubei 29.00 15.00 8.31 17.33 15.04 17.29 0.59 7
Hunan 25.41 21.67 1.00 17.33 10.68 24.54 0.58 8
Chongqing 27.50 17.00 7.27 29.00 5.46 10.64 0.56 9
Guangdong 16.56 26.33 9.57 8.00 17.43 13.22 0.52 10
Shandong 19.74 13.00 7.06 13.83 19.07 18.23 0.52 11
Jian
g
su 21.42 11.00 14.16 9.17 21.51 11.25 0.51 12
Anhui 19.69 17.67 9.78 12.67 12.03 10.90 0.48 13
Guizhou 10.60 29.00 9.57 12.67 7.14 8.47 0.45 14
Hebei 18.47 13.67 6.85 12.67 12.54 11.58 0.44 15
Fujian 13.26 21.00 14.37 12.67 7.24 6.10 0.43 16
Gansu 19.34 19.00 9.99 13.83 5.47 5.19 0.42 17
Jian
g
su 13.38 1.00 29.00 1.00 24.23 2.83 0.41 18
Shaanxi 11.59 13.00 10.19 15.00 5.97 5.67 0.35 19
Heilongjiang 17.37 19.67 1.42 13.25 2.85 5.11 0.34 20
Qinghai 16.50 25.00 4.13 10.33 1.00 1.62 0.34 21
Ningxia 13.03 17.67 20.01 3.33 2.05 1.20 0.33 22
Hainan 3.89 18.33 25.87 3.33 3.28 1.38 0.32 23
Xizan
g
1.00 28.33 19.39 3.33 1.40 1.12 0.31 24
Liaoning 10.26 11.00 8.10 13.83 4.73 4.39 0.30 25
Tianjin 10.08 11.67 15.84 5.67 1.99 1.35 0.27 26
Inner
Mon
g
olia
9.04 18.33 2.88 6.83 3.45 3.19 0.25 27
Shanxi 4.93 5.00 5.39 9.17 4.44 3.59 0.19 28
Jilin 1.29 11.67 1.21 3.33 2.81 1.00 0.12 29
PMBDA 2022 - International Conference on Public Management and Big Data Analysis
94
3.4 Correlation Analysis
The ranking results of two comprehensive
evaluation methods are the same, On the results of
regional sorting the raw data. Completely random
design of Kruskal Wallis H - inspection, the result
shows that the difference in the ranking results of
two kinds of evaluation methods has no statistical
significance. Further do Spearman correlation
analysis, the result of the evaluation shows that the
ranking results of two kinds of evaluation methods
have high correlation(r=0.915, P<0.01),as shown
in the table 4.
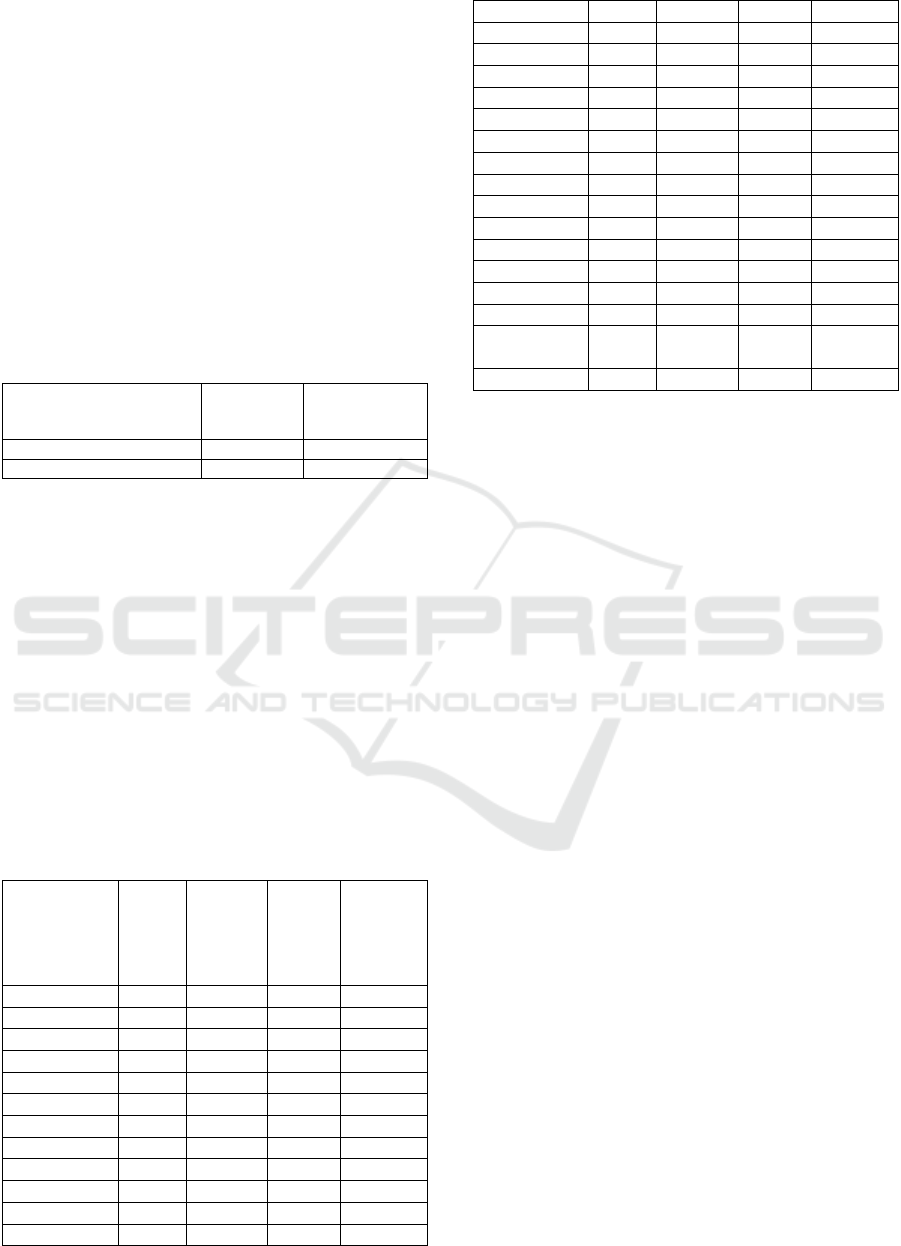
Table 4: Two kinds of Spearman correlation analysis of
the evaluation results.
TOPSIS
method
linear
interpolation
method
TOPSIS method 1.000 0.915
linear interpolation method 0.915 1.000
3.5 Two Kinds of Evaluation Results of
Correlation Analysis
Two kinds of evaluation results is not the same, to
ensure the accuracy and objectivity of the evaluation
results, the results of the two evaluation methods
show comprehensive sequencing, the results showed
that the country towns and townships of medical
service quality of the top three provinces, guangxi,
henan, sichuan, those in the bottom three of shanxi,
Inner Mongolia, jilin, respectively. As shown in the
table 5.
Table 5: Based on two methods of evaluation of
comprehensive sorting table in towns and townships of
medical services.
Area
TOPS
IS
metho
d
linear
interpol
ation
method
The
averag
e sort
The
compreh
ensive
sequenci
n
g
Sichuan 1 1 1.00 1
Henan 2 3 2.50 2
Guangxi 3 2 2.50 2
Yunnan 8 4 6.00 3
Henan 5 8 6.50 4
Hubei 6 7 6.50 4
Shandon
g
4 11 7.50 5
Jian
g
xi 10 6 8.00 6
Xinjiang 12 5 8.50 7
Jiangsu 7 12 9.50 8
Guan
g
don
g
9 10 9.50 8
Chon
gq
in
g
13 9 11.00 9
Anhui 15 13 14.00 10
Zhejiang 11 18 14.50 11
Hebei 14 15 14.50 11
Guizhou 17 14 15.50 12
Fu
j
ian 18 16 17.00 13
Gansu 19 17 18.00 14
Shaanxi 20 19 19.50 15
Tianjin 16 26 21.00 16
Heilongjiang 23 20 21.50 17
Hainan 21 23 22.00 18
Nin
g
xia 24 22 23.00 19
Liaonin
g
22 25 23.50 20
Qinghai 26 21 23.50 20
Xizang 25 24 24.50 21
Shanxi 27 28 27.50 22
Inner
Mongolia
29 27 28.00 23
Jilin 28 29 28.50 24
4 CONCLUSIONS
4.1 Comprehensive Evaluation Results
At present, the urban grassroots medical and health
service system is steady and rapid development, but
there are still areas development speed and scale
imbalance problem. Comprehensive evaluation
results from the above, our country towns and
townships in the central region the low level medical
service quality, this is consistent with the result of
actor of (Liu 2013). Among them, the medical
service quality comprehensive ranking top three,
respectively is, guangxi, henan, sichuan, after three
shanxi, Inner Mongolia, jilin, respectively.
Sichuan, henan, guangxi region in towns and
townships of medical service quality is good, is
located in the top level. Sichuan towns and
townships comprehensive medical service quality is
best, high on the first bit admissions index; The
number of physician practice in henan and
admission number is located in the country first and
third respectively. In towns and townships of shanxi,
Inner Mongolia, jilin region after comprehensive
ranking in the national health service ability.
Hospital in jilin people located in all but 1, sickbed
utilization rate, average daily visits and
professionals, average daily for hospital beds per
second from bottom in the country. Grassroots
health work in recent years, the rapid development
in our country, but the regional conditions and
policy environment to a certain extent, affect the
operation of the medical and health work and
development. Some less developed areas of fiscal
investment is insufficient, compensation mechanism
Evaluating the Quality of Medical and Health Services by the Method of Topsis and Linear Interpolation in China
95

is imperfect, the government health work value
degree is low, lead to the low level of health
manpower, equipment and funds, weak grassroots
service capacity (Xue 2014). So, in order to improve
the basic health service ability, improve the
grassroots health development of the regional
imbalance, local governments should improve
attention to grassroots health work, increase policy
support and financial support. Central policy tilt in
less developed areas should be targeted to the
economy, to strengthen the construction of
infrastructure, the rational allocation of health
resources, perfect the incentive mechanism, to
provide economic underdeveloped regions in health
manpower and material resources, and promote the
equal basic health services.
4.2 The Application Value of the Two
Kinds of Evaluation Method
The combination of two kinds of evaluation
methods, can be more intuitive, accurately reflect the
regional grassroots medical service level (Ying, Liu,
Zhao, Wang, Sa, LI 2016). By Spearman correlation
analysis, according to two kinds of results
correlation is higher, the correlation coefficient were
statistically significant. Although the two kinds of
evaluation results, but the difference was not
significant, examined the Kruskal Wallis H - and
there was no statistically significant difference of the
two kinds of evaluation result, and the results have
good consistency. In this paper, research results are
accurate, can reflect the regional differences of the
basic medical service quality.
ACKNOWLEDGEMENTS
We thank all collaborators for their contribution in
collecting data for current study.
REFERENCES
Gao, Z. Y. To strengthen the construction of towns and
townships in our province. Chinese people's political
consultative conference (CPPCC) newspapers in
guizhou. 2018-06-15(A02).
Liu, H.Q., Chai, X. D., Xu, C. M. & Cai, L. (2018).
TOPSIS method combined with RSR method of
comprehensive evaluation the singularity of children
immunization vaccine immunization coverage. China
for vaccines and immunization, 05,589-592. doi:
10.19914 / j.carol carroll jni 2018.05.018.
Li, L. F., Wang, X. D., Xia, Y. G., Zhang, Y., Bai, Y., et
al. (2015). A linear interpolation method in the
application of the comprehensive evaluation on the
work quality of child care. China's maternal and child
health care,16,2491-2494.
Liu, Q. (2013). The Chinese community health service
efficiency analysis. The Chinese health service
management,07,497-499 + 502.
National health and family planning commission. China
statistical yearbook of health and family planning,
Beijing union medical university press, Beijing,2017.
Wang, He., Song, P.G., An, L. (2015). Comprehensive
evaluation of maternal health in China by TOPSIS and
RSR, China Health Statistics,02,240-242.
Xue, J. W. (2014). Exploration of jilin province
community health reform and development. China's
community physicians,24,183-186.
Ying, R. J., Liu, W. L., Zhao, Z., Wang, C. D., Sa, L. F.,
& LI, X.L. (2016). Three kinds of comprehensive
evaluation method for the quality evaluation of
influenza surveillance network in xinjiang. Modern
preventive medicine,16,2963-2967.
PMBDA 2022 - International Conference on Public Management and Big Data Analysis
96
