
Accessibility and Population Matching Analysis of Public Service
Facilities Based on the Gaussian Mobile Search Method
Huanyu Zhang
1a
and Xiaopeng Cui
2,* b
1
Sports Institute, Harbin University of Commerce, University street, Harbin, China
2
School of Finance and Public Administration, Harbin University of Commerce, University Street, Harbin, China
Keywords:
Public Service Facilities Accessibility, Natural Breaks, Gaussian Two-Step Mobile Search Method.
Abstract:
Public service facilities are an essential index to measure urban infrastructure, people's livelihood and
well-being and a necessary standard to evaluate public service management. Taking Daoli District and
Nangang District of Harbin City as the study area, this paper calculates and analyzes the coverage and
population distribution of 15-minute accessibility of public service facilities in the study area based on the
Gaussian two-step mobile search method and ArcGIS Natural breaks. The results show that: 1) The overall
layout of the study area is reasonable, but the spatial layout of public facilities such as cultural, sports, and
medical facilities needs to be strengthened. 2) The data shows that the spatial layout of Daoli District is
more reasonable. 3) Most residents can reach five types of public service facilities within 15 minutes.
1 INTRODUCTION
1
The construction of public service facilities is the
basis of urban spatial layout and convenience for
residents, which is also an important performance to
measure the working ability of the government and
fulfill the purpose and obligation of the government.
The essence of public service facilities is to serve
citizens, so we should pay attention not only to the
increase in quantity but also to the quality of service.
There are abundant research results on the
accessibility of public service facilities. In terms of
research objects, some scholars pay attention to the
accessibility of park green space (Chen 2020), while
others pay attention to the accessibility of medical
facilities (Xiao, Yuan, Xu 2009). It is relatively
single, so this paper tries to construct a dual index
for analysis. There are also many research methods,
such as the nearest distance method (Fryer 2010),
and the spatial interaction-based method (Spencer
2014, Luo 2004). Through comparison and careful
consideration required in this paper, the Gaussian
two-step search method (Tao 2016) is used for
research and analysis. ArcGIS was used to transform
the data into a plan to show the distribution of public
a
https://orcid.org/0000-0001-6137-6915
b
https://orcid.org/0000-0002-4904-6208
service facilities and population, and the concept of
the 15-minute life circle was introduced to evaluate
the matching degree of the two.
2 OVERVIEW OF THE STUDY
AREA
Harbin, the capital city of Heilongjiang Province, is
the provincial capital city with the highest altitude in
the country and is located in the center of Northeast
Asia. By 2021, Harbin had jurisdiction over nine
districts and seven counties, with a total area of
53,186 square kilometers and a permanent
population of nearly 10 million. Nangang District
and Daoli District, which were developed earlier, are
taken as the research areas of this paper.
3 DATA SOURCES AND
RESEARCH METHODS
3.1 Data Sources
The subjects included population, health care,
education, commerce, sports, and public services
such as parks. According to the latest yearbook of
30
Zhang, H. and Cui, X.
Accessibility and Population Matching Analysis of Public Service Facilities Based on the Gaussian Mobile Search Method.
DOI: 10.5220/0012069600003624
In Proceedings of the 2nd International Conference on Public Management and Big Data Analysis (PMBDA 2022), pages 30-34
ISBN: 978-989-758-658-3
Copyright
c
2023 by SCITEPRESS – Science and Technology Publications, Lda. Under CC license (CC BY-NC-ND 4.0)

the local statistics department, as of October 2021,
there were 2,488,109 people in the experimental
area. Among, Daoli District 1097430 people, and
Nangang District 1390679. Other data were obtained
from local education, planning, civil affairs, and
other relevant departments or government public
information.
3.2 Research Methods
The mobile search method used in the early stage is
based on the calculation of the census unit as the
center, in a given radius of the search area supply
and demand ratio to the target accessibility and two.
Compared with the former, the Gauss two-step
mobile search engine adopted in this paper has two
advantages. First, it solves the problem that the
distance between supply and demand is too long to
be used. Second, it solves the problem of
cross-regional supply of demand by suppliers. The
Gaussian mobile search method is divided into two
steps. First, the coordinates of public facilities are
set as point J, and all residents within the threshold
range of point J are searched. The weighted sum of
the Gaussian function is used to obtain the resident
data within the threshold range of the point where
the facilities are located, and then the
demand-supply ratio of facility J is calculated. The
specific calculation formula is as follows:
𝑅
=
∑
,
0
∈
(
0
(1)
Where: Rj is the supply-demand ratio of facility
point j, S
j
is the scale (area) of facility point j, D
Ij
is
the distance between facility point j and settlement I
(road network distance), D0 is the search threshold,
P
i
is the scale (population) of settlement I within the
threshold, and G (D
Ij
, D0) is the Gaussian function.
The specific calculation method is as follows:
𝐺
,
0
=
⎩
⎨
⎧
1
2
2
1
2
1
1
2
0,𝑑
>𝑑
0
,𝑑
𝑑
0
(2)
Step 2: Centering on residential area i, search all
facility points within the threshold range, and
calculate the supply and demand ratio of all facility
points by weighting the Gaussian function. The
specific calculation formula is as follows
A
i
=
∑
G(d
i
j
,d
0
)R
j
j∈(d
i
j
d
0
)
(3)
Where: A
i
is the accessibility of settlement I, R
j
is the supply-demand ratio of facility point j, and G
(D
I
j,d0) is a Gaussian function. In this paper, the
supply point and demand point are divided into a
50*50 meters grid, and the geographic center of the
grid is used for a two-step mobile search. The
practical significance of the representation of
accessibility calculated based on the Gaussian
two-step mobile search method is the number of
public service facilities accessible to each person in
the research unit. In this paper, the practical meaning
of the representation is the number of public service
facilities available to each person in the grid.
4 DISTRIBUTION
CHARACTERISTICS OF
ACCESSIBILITY OF PUBLIC
SERVICE FACILITIES IN THE
STUDY AREA
4.1 Accessibility of Public Services
4.1.1 Accessibility of Educational Facilities
The maximum value of accessibility to educational
facilities is 4196.04, and the minimum value is 0.
Using the natural break point method in ArcGIS10.2,
the accessibility of educational facilities in the grid
of the study area was divided and calculated
according to five levels. The results showed that
there were 22,557 grids, and the accessibility of
medical facilities for 2,455266 people was below
13.10. Units with per capita accessibility below
13.10 accounted for 98.68% of all grids and 96.24%
of the total population. Again, the natural break
point method was used to divide the grid with
accessibility below 13.10. It can be seen that the
accessibility of medical facilities is spatially "high in
the northwest and low in the southeast".
4.1.2 Accessibility of Medical Facilities
The maximum value of accessibility to medical
facilities was 95.75, and the minimum value was 0.
Using the natural break point method in ArcGIS10.2,
the accessibility of educational facilities in the grid
of the study area was divided and calculated
according to five levels. The results showed that
there were a total of 20193 grids, and the
accessibility of medical facilities for 218,724 people
was below 0.83. Units with per capita accessibility
below 0.83 accounted for 86.24% of all grids and
84.65% of the total population. Again, the natural
break point method was used to divide the grid with
accessibility below 0.83. It can be seen that the
accessibility of medical facilities is spatially "high in
the northwest and low in the southeast".
Accessibility and Population Matching Analysis of Public Service Facilities Based on the Gaussian Mobile Search Method
31

4.1.3 Accessibility of Commercial Facilities
Put the relevant data into the formula and calculate
the maximum value of commercial facilities
accessibility is 6769.29, and the minimum value is 0.
By using the natural break point method in
ArcGIS10.2, the accessibility of commercial
facilities in the grid of the study area was divided
and calculated according to five levels. The results
showed that there were 22,728 grids, and the
accessibility of commercial facilities for 2,733,165
people was below 41.41. The units with per capita
accessibility below 41.41 accounted for 97.07% of
all grids and 98.61% of the total population. Again,
the natural break point method is used to divide the
grid of accessibility under 41.41. It can be seen that
the accessibility space of commercial facilities
presents "high in the west and low in the east".
4.1.4 Accessibility of Cultural and Sports
Facilities
By putting relevant data into the formula and
calculating, the maximum value of accessibility to
cultural and sports facilities is 1577.73, and the
minimum value is 0. By using the natural break
point method in ArcGIS10.2, the accessibility of
educational facilities in the grid of the study area
was divided and calculated according to five levels.
The results showed that there were 23140 grids, and
the accessibility of cultural and sports facilities for
2,649,426 people was below 10.27. Cells with per
capita accessibility below 10.27 accounted for 98.83%
of all grids and 99.13% of the total population.
Again, the natural break point method is used to
divide the accessibility grid at 10.27. It can be seen
that the accessibility space of cultural and sports
facilities presents "high in the middle and low
around".
4.1.5 Accessibility of Park Facilities
The maximum value of accessibility to park
facilities is 1806.51, and the minimum value is 0.
Using the natural break point method in ArcGIS10.2,
the accessibility of educational facilities in the grid
of the study area was divided and calculated
according to five levels. The results showed that
there were 22,396 grids, and the accessibility of
cultural and sports facilities for 2,785,771 people
was below 14.72. Units with per capita accessibility
below 14.72 accounted for 95.65% of all grids and
96.99% of the total population. Again, the natural
break point method is used to divide the
accessibility grid at 10.27. It can be seen that the
accessibility space of park facilities presents "high
in the northwest and low in the southeast".
4.2 Public Service Facilities and
Population Analysis
Table 1: Accessibility of educational facilities and
population coverage.
index Nangang
District
Daoli
District
15-minute
accessibility
2.34 1.18
Population
coverage
95.82 97.73
As can be seen in Table 1, the accessibility of
educational facilities in Daoli District is 1.18, and
that in Nangang District is 2.34. The accessibility of
Nangang District is nearly twice that of Daoli
District. In terms of the population coverage of
education facilities within 15 minutes, the
population coverage rate of Daoli District is 97.73%,
and that of Nangang District is 95.28%. The
population coverage rate of Daoli District is about
two percentage points higher than that of Nangang
District.
Table 2: Accessibility of medical facilities and population
coverage.
index Nangang
District
Daoli
District
15-minute
accessibility
0.34 0.68
Population
coverage
78.93 92.34
As can be seen from Table 2, the accessibility of
medical facilities in Daoli District is 0.68, and that
in Nangang District is 0.34. The accessibility of
Nangang District is nearly twice that of Daoli
District. In terms of the population coverage of
medical facilities within 15 minutes, the population
coverage rate of Daoli District is 92.34%, and that of
Nangang District is 78.93%. The population
coverage rate of Daoli District is about 15
percentage points higher than that of Nangang
District.
PMBDA 2022 - International Conference on Public Management and Big Data Analysis
32
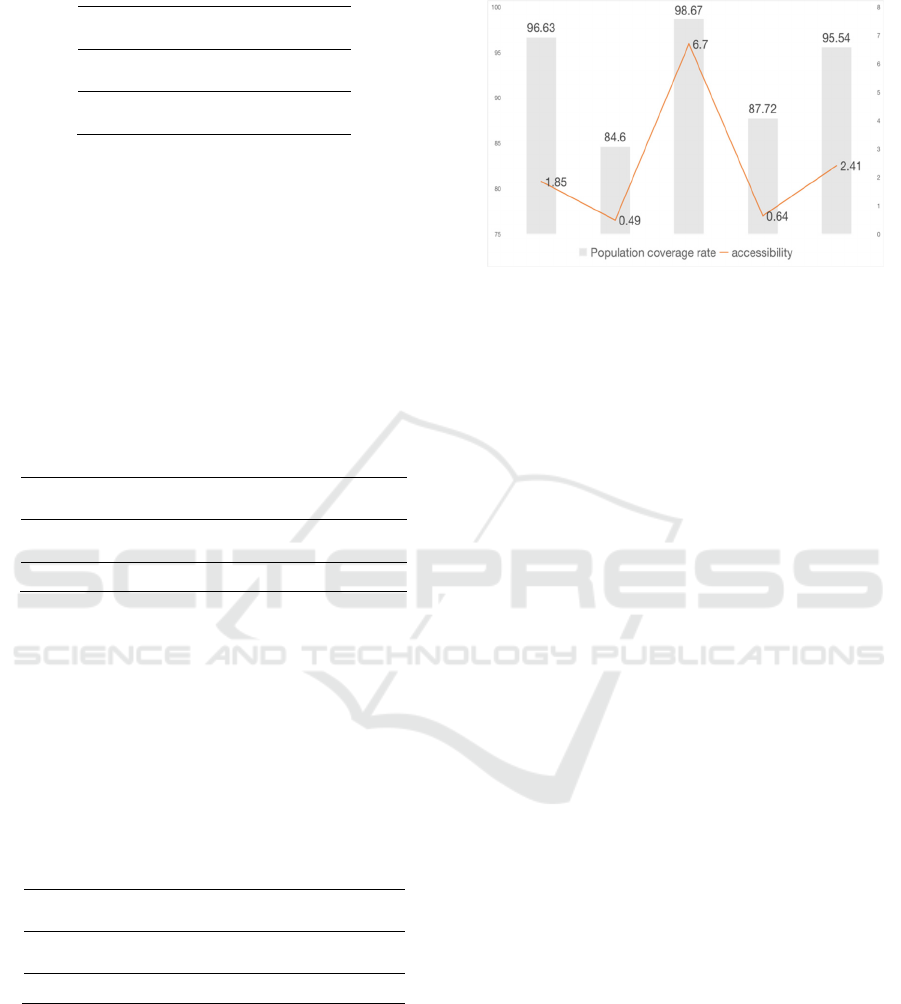
Table 3: Accessibility of commercial facilities and
population coverage.
index Nangang
District
Daoli
District
15-minute
accessibilit
y
9.19 3.31
Population
covera
g
e
98.25 99.24
As can be seen from Table 3, the accessibility of
commercial facilities in Daoli District is 3.31, and
that in Nangang District is 9.19. The accessibility of
commercial facilities in Daoli District is less than
half that in Nangang District. The accessibility of
the Nangang district is nearly twice that of the Daoli
District. From the perspective of the population
coverage within 15 minutes of commercial facilities,
the population coverage rate of Daoli District is
99.24%, and that of Nangang District is 98.25%.
The gap between the two is not very large.
Table 4: Accessibility of cultural and sports facilities and
population coverage.
index Nangang
District
Daoli
District
15-minute
accessibilit
y
0.81 0.40
Population coverage 74.95 93.31
As can be seen from Table 4, the accessibility of
cultural and sports facilities in Daoli District is 0.40,
and that in Nangang District is 74.95, twice that in
Daoli District. The accessibility of Daoli District is
lower than that of Nangang District. However, due
to the large internal differences in Nangang District,
the value of most areas is 0, so the accessibility of
recreational and sports facilities is spatially high in
the middle and low on the two sides.
Table 5: Accessibility of park facilities and population
coverage.
index
Nangang
District
Daoli
District
15-minute
accessibilit
y
2.09 2.84
Population coverage 93.78 97.94
As can be seen from Table 5, the accessibility of
park facilities in Daoli District is 2.84, and that in
Nangang District is 2.09. The accessibility of Daoli
District is about 1.3 times that of Nangang District.
In terms of population coverage rate, Daoli District
is 97.94, and Nangang District is 93.78. The
population coverage rate of Daoli District is about 4%
higher than that of Nangang District.
4.3 Comparative Analysis
Figure 1: Comparison of accessibility and population
coverage of various facilities.
According to Figure 1, the 15-minute accessibility
and population coverage of commercial, park, and
educational facilities are relatively high. The
15-minute accessibility of cultural, sports, and
medical facilities is less than 85% of the population,
and the accessibility is less than 0.8, indicating that
there is room for optimization of the spatial layout
of cultural, sports, and medical facilities.
5 CONCLUSION
Five types of representative public service facilities
in the study area were selected in the text, and their
grid analysis was carried out by using tools. The
data showed that if the accessibility was greater than
0, it meant that the residents represented by the grid
units were within 15 minutes of the public service
facilities. Further analysis shows that there are
14632 (62.49%) grid data that can use five types of
public facilities within 15 minutes in the study area,
and 2181930 (73.58%) people can reach five types
of public service facilities within a 15-minute life
circle through the conversion of grid units and
population data.
Based on the above analysis, the following three
conclusions are drawn: 1) The accessibility and
population coverage of education facilities,
commercial facilities, and park facilities are
reasonable, and the population distribution is
relatively matched. However, the layout of medical
facilities and cultural and sports facilities is
contradictory to the population distribution, and
there is still a large space for improvement in the
spatial layout. 2) The special spatial distribution of
different public facilities can be seen through the
grid data. On the whole, the accessibility presents a
Accessibility and Population Matching Analysis of Public Service Facilities Based on the Gaussian Mobile Search Method
33

spatial layout of "high in the middle and low on both
sides". 3) The overall data of 15-minute accessibility
of public facilities are good, with nearly 80% of
residents within its range, and the overall spatial
distribution is reasonable. But there are still some
people who cannot fully enjoy high-quality public
service facilities.
REFERENCES
Chen Fan. (2020), Spatial pattern and accessibility of
medical and health institutions in the main urban area
of Hefei. Jiangsu Urban Planning, 2020, (07): 28-32.
Fryer G E, Drisko J, Krugman R D, et al. (2010),
Multi-method assessment of access to primary
medical care in rural Colorado[J]. Journal of Rural
Health, 2010,15(1):113-121
Luo, Jun. (2014). Integrating the Huff Model and Floating
Catchment Area Methods to Analyze Spatial Access to
Healthcare Services[J]. Transactions in Gis, 2014,
18(3):436-448
Spencer J, Angeles G. (2007). Kernel density estimation
as a technique for assessing availability of health
services in Nicaragua[J]. Health Services and
Outcomes Research Methodology,
2007,7(3-4):145-157.
Tao Zhoulin, Cheng Yang. (2016). Progress in two-step
mobile search and its extended form [J]. Progress in
Geography, 2016,35(05):589-589
Xiao huabin, Yuan Qifeng, Xu Huijin. (2009). Research
on the spatial distribution of park green space based
on accessibility and service area [J]. Planners,
2009,25(02):83-88
PMBDA 2022 - International Conference on Public Management and Big Data Analysis
34
