
Method Development of Evaluating Government
Public Service Performance Based on
Big Data Technology
Using Social Media Data as Evaluation Data
Zhan Yun*
Sichuan University,
Chengdu, Sichuan, China
Keywords: Social Media Data, Government Public Services, Performance Evaluation Methods.
Abstract. In the era of big data, it is of great significance to develop a method to evaluate the performance of government
public services based on big data and technical application. This paper takes social media data as the evalua-
tion data. It uses the natural language processing technology of big data to establish a set of special, compre-
hensive and systematic new methods for government public service performance evaluation. They include:
(1) method of collecting social media data based on Python web crawler technology; (2) evaluation index
screening method based on word frequency analysis technology; (3) method of determining index weight
based on discriminant rate technique; (4) method of calculating performance score based on sentiment anal-
ysis; (5) visualization method of public service performance based on performance matrix; (6) method of
mining the influencing factors of public service performance based on semantic network analysis technology.
The contribution of this study is that it is of great value to improve and innovate the evaluation method of
government public service performance, and has a strong promotion significance.
1 INTRODUCTION
With the advent and development of the era of big
data, as a special category of big data, social media
data appears widely. It includes data from content
sharing websites, forums, blogs and microblogs (Far-
zindar & Inkpen 2020). It is characterized by easy ac-
cess, more democratic, real-time generation and high
level of interaction, free and so on (Arnaboldi, Coget
2016, Gao, Barbier, Goolsby 2011, Yates 2010).
These advantages determine that it is of great signifi-
cance to develop a set of methods to evaluate the per-
formance of government public services using social
media data. Previously, the academic community has
discussed the theory and method of using social me-
dia data to evaluate the performance of public ser-
vices (Bamberger 2019, Netzer, Feldman, Golden-
berg, et al. 2012, Nguyen, Quan, Phan 2014). In re-
cent years, some scholars have studied from practice.
Fabra-Mata and Mygind used Twitter data to assess
Norway 's contribution to the Colombian peace pro-
cess (Fabra-Mata, Mygind 2019). Ceron and Negri
used Twitter data to evaluate Italian policies on job
market reform and school reform (Ceron, Negri
2016). Deborah and Michel used Twitter data to eval-
uate the performance of university public services in
an Italian region (Agostino, Arnaboldi 2017). Guo
and Mei used social media data to evaluate the spatial
distribution and performance of mass sports facilities
(Guo, Mei 2020). Existing studies have made useful
explorations for the use of social media data to carry
out performance evaluation, but there are simplifica-
tion and unsystematic problems.
In view of this, this paper attempts to develop a
set of comprehensive and systematic method to eval-
uate the performance of government public services
using social media data. This method involves the
whole process from data collection and collation to
influencing factor mining. Finally, this paper reflects
on the contributions and limitations of this method.
18
Yun, Z.
Method Development of Evaluating Government Public Service Performance Based on Big Data Technology Using Social Media Data as Evaluation Data.
DOI: 10.5220/0012069300003624
In Proceedings of the 2nd International Conference on Public Management and Big Data Analysis (PMBDA 2022), pages 18-22
ISBN: 978-989-758-658-3
Copyright
c
2023 by SCITEPRESS – Science and Technology Publications, Lda. Under CC license (CC BY-NC-ND 4.0)
2 DEVELOP A METHOD TO
EVALUATE GOVERNMENT
PUBLIC SERVICE
PERFORMANCE USING
SOCIAL MEDIA DATA
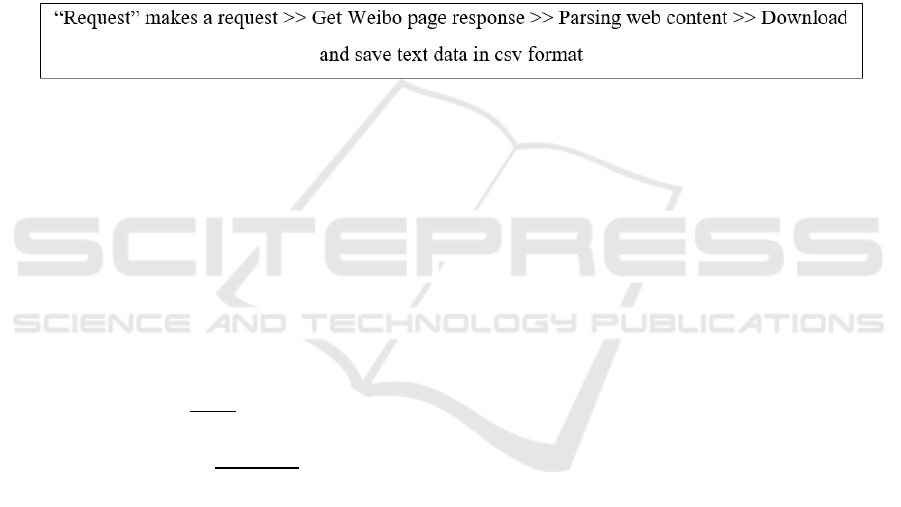
2.1 Evaluation Data Collection
For the collection of evaluation data, first of all, the
appropriate social media should be selected based on
how widely it is used and relevance to government
public services. The second is to crawl the data. There
are two ways to crawl data: One is to write a web
crawler program with python. Most social media plat-
forms open their own APIs and can call python 's
built-in encapsulation module requests method to
crawl the required data with API. This paper takes
China 's Sina Weibo as an example. After determin-
ing the search term, you can use the advanced search
function of Weibo to obtain important information
such as URLs and cookies, and then use python3.8 to
send requests through the request library. The parsed
web page data is stored in the local computer in the
csv format. The microblog collection process is
shown in Fig. 1. Another way is to use the data col-
lection platform on the market, we usually only need
to enter the keywords to get the relevant data. Their
disadvantage is that they cannot be customized at
will.
Figure 1: Process of Collecting Sina Weibo Data (own-drawn).
2.2 Screening of Evaluation Indicators
Based on Word Frequency Analysis
(1) Feature word extraction based on TF-IDF. TF-
IDF is a weighted method, which mainly solves the
problem of low word frequency and high importance.
TF is the word frequency, that is, the number of times
a word appears in the text; IDF is the reverse text fre-
quency, a measure of the general importance of
words; TF-IDF is the TF value multiplied by the IDF
value. Their formulas are as follows:
𝑇𝐹
=
,
∑
,
(1)
𝐼𝐷𝐹
=𝑙𝑜𝑔
||
:
∈
(2)
TF-IDF=TF*IDF (3)
Select the top 500 words in TF-IDF, delete the
words that obviously do not meet the evaluation char-
acteristics, delete the numerals, verbs, emotional
color words, and merge the words of regional charac-
teristics into ' XX ' place name.
(2) Word vector acquisition based on Word2vec.
To build a word vector model requires corpus train-
ing, the crawled data as a corpus or the use of existing
corpus, through Python call word2vec word vector
model training. Use the API interface of Gensim
module to load Word2Vec and set the word vector di-
mension. The dimension represents the characteris-
tics of words. The more features, the greater the dis-
crimination of words. However, too high dimension
setting may lead to errors due to insufficient computer
CPU and too large dimension, which leads to the re-
lationship between words too dilute. Thus, large cor-
pus is generally set to 300-500 dimensions, small spe-
cific areas of the corpus is generally 200-300 dimen-
sions.
(3) Construct evaluation index based on K-
Means clustering. The K-Means algorithm uses Eu-
clidean distance as the similarity index. The smaller
the Euclidean distance, the higher the similarity of the
two words. The idea of word clustering using k-
Means algorithm is as follows: 1) k points are ran-
domly selected as the clustering center; 2) Calculate
the distance from each word to each cluster center; 3
) Each point is divided into the nearest cluster center
to form k clusters ; 4 ) recalculate the centroid of each
cluster ; 5 ) Repeat the above steps until the position
of the centroid does not change or the set number of
iterations is reached. The core index of the elbow
method is SSE (sum of the squared errors). The rela-
tionship between SSE and k is the shape of an elbow,
and the k value corresponding to this elbow is the true
clustering number of the data, the formula is as fol-
lows:
𝑆𝑆𝐸 =
∑∑
|𝑝 − 𝑚
|
∈
(4)
Among them, SSE is the clustering error, which
represents the quality of the clustering effect. 𝑐
rep-
resents the i-th cluster, p represents the sample point
of 𝑐
, and 𝑚
represents the centroid of 𝑐
.
Method Development of Evaluating Government Public Service Performance Based on Big Data Technology Using Social Media Data as
Evaluation Data
19
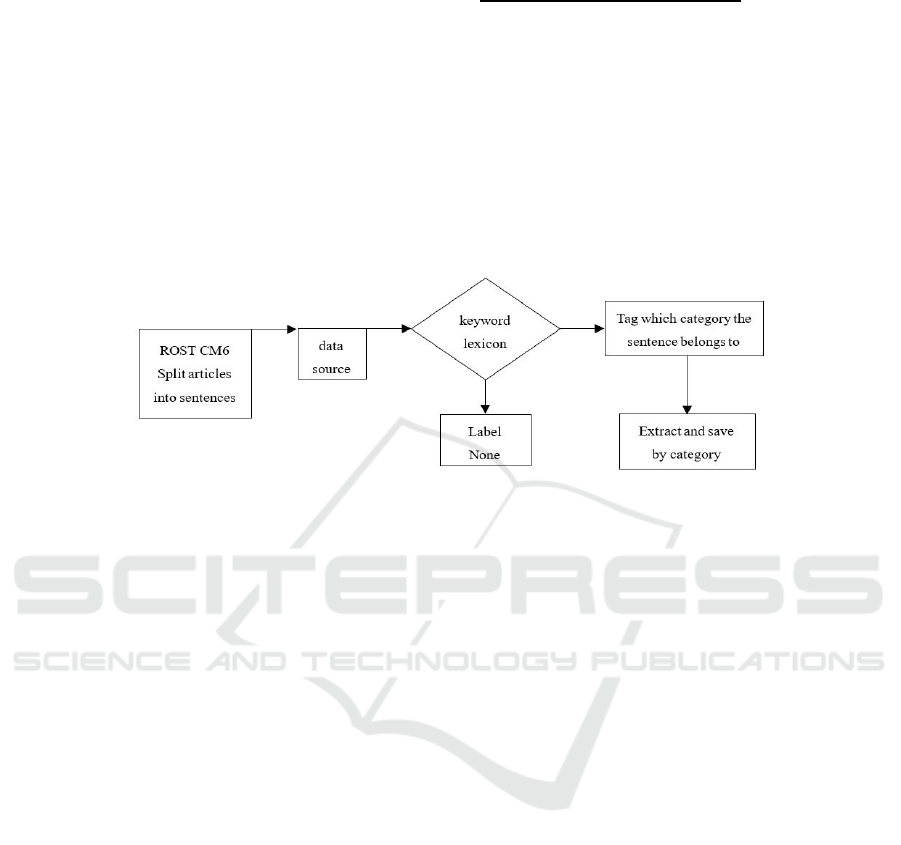
2.3 Weight of Indicators Based on
Discriminant Rate
The weight of the index can be designed by discrimi-
nant ratio. The discriminant rate determines its im-
portance by calculating the proportion of a subset in
the total set. It can judge the amount of discussion of
each indicator in the discussion of the evaluated ob-
ject in social media, and quantify the importance of
specific indicators on social media platforms in the
form of percentages. The calculation method is
shown as follows:
Relative importance =
*100% (5)
Firstly, the index data set is extracted. The ma-
chine learning method is used to classify the text and
eliminate the data unrelated to the evaluation index.
At present, the traditional machine learning methods
used in empirical research are SVM and TextCNN.
This article also recommends a relatively simple and
convenient method. It is through the ROST CM6 soft-
ware keyword extraction, and then for loop respec-
tively traverse text and keywords to achieve text ex-
traction. The details are shown in Fig. 2.
Figure 2: The process of sentiment sentence extraction (own-drawn).
Secondly, the relative importance analysis. After
the classification is completed, the amount of data for
each indicator can be obtained, and a clear discrimi-
nant ratio result can be obtained only by performing
a percentage conversion according to the formula. In
order to complete the relative importance analysis of
the first-level indicators, it is necessary to convert on
the basis of the discriminant rate of each second-level
indicator. Because the data is constant, it is only nec-
essary to accumulate the discriminant rate of the sec-
ond-level indicators under each first-level indicator.
In order to better assess the performance of govern-
ment public services, a distinction should be made be-
tween official and non-official accounts in the
weighting process.
2.4 Public Service Performance Score
Calculation Based on Sentiment
Analysis
Sentiment analysis can be used to obtain the perfor-
mance score of each index, because sentiment analy-
sis can score emotional vocabulary. At present, some
institutions have established some sentiment analysis
platforms or modules based on deep learning, such as
the sentiment analysis module of Baidu AI open plat-
form. The module in a number of vertical classes
(cars, restaurants, hotels, etc.) emotional orientation
analysis accuracy of more than 95 %. From the oper-
ation point of view, only need to call the AipNlp mod-
ule, and then write the file can realize the sentiment
analysis of each sentence in the file.
For the sake of objectivity, the calculation of emo-
tional score is based on the score of unofficial ac-
count. The emotional scores of the secondary indica-
tors of government public services are first calcu-
lated. The first-level indicator scores and the overall
performance emotional scores can be weighted by the
emotional scores of the secondary indicators. The cal-
culation formula is as follows:
𝐸𝑆 =
∑
𝑆
𝑁
(6)
𝑆
is the weight of the second-level index i, that
is, the unofficial discriminant ratio of the index; 𝑁
is the unofficial sentiment value of the second-level
indicator; ES is the overall performance sentiment
score for government public services.
2.5 Public Service Performance
Visualization Based on
Performance Matrix
For the purpose of diagnosis or result use, it is also
necessary to visualize the obtained evaluation results.
Drawing on the practice of Deborah and Michel
(Nguyen, Quan, Phan 2014), this paper visualizes the
PMBDA 2022 - International Conference on Public Management and Big Data Analysis
20
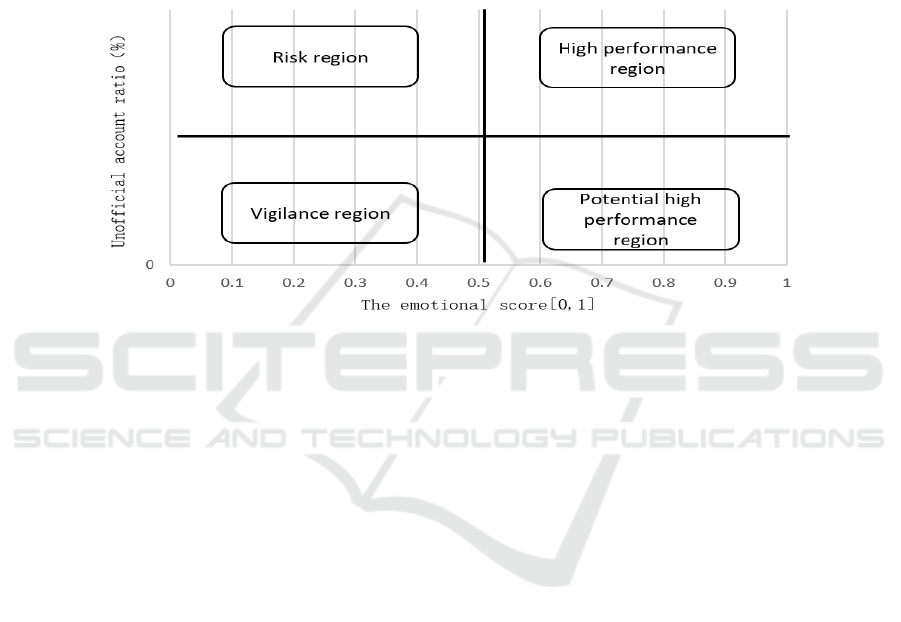
performance of government public services by devel-
oping a performance matrix.
The matrix is visualized in the form of horizontal
and vertical coordinates (as shown in Fig. 3). The hor-
izontal axis of the matrix is the emotional score, and
the vertical axis is the unofficial account ratio. These
axes are centered at the median value 0.5 of the sen-
timent value and the average of non-official account
ratios. Each point in the matrix represents a discus-
sion topic (second level evaluation index). Four quad-
rants can be determined in this way, which corre-
spond to four regions: high performance region, risk
region, potential high-performance region and vigi-
lance region. They represent: services that govern-
ments do best, services that require immediate gov-
ernment intervention, services that require greater
government advocacy, services that require govern-
ment surveillance. Through the performance matrix,
we can not only intuitively observe the effectiveness
of public services, but also help to determine the pri-
ority of improvement actions.
Figure 3: Government Public Service Performance Matrix (own-drawn).
2.6 Analysis of Factors Affecting Public
Service Performance Based on
Semantic Network Analysis
In order to have a deeper understanding of the perfor-
mance evaluation results of government public ser-
vices, it is also necessary to explore the influencing
factors hidden behind the performance scores. Se-
mantic network analysis in big data analysis provides
a solution for the analysis of influencing factors. Se-
mantic network analysis is carried out after the word
frequency analysis of the comment text. The word
frequency analysis has been completed in the index
system part, so it only needs to be carried out based
on the previous work. When performing semantic
network analysis of government public services, the
following process can be followed: selecting unoffi-
cial account comments - classifying positive and neg-
ative entries - counting word frequency separately -
drawing word cloud maps separately - drawing se-
mantic network maps separately - observing and sum-
marizing the links between feature words. In opera-
tion, the first step is to use the jieba word segmenta-
tion module of Python to cut the positive and negative
entries and delete the stop words, and then use the
collections word frequency statistics library for word
frequency statistics, and then use the easy word cloud
3.0 to draw the word cloud map. The second step is
to use the ROST tool to import the positive and neg-
ative text data of each index, and draw the semantic
network diagram.
3 CONCLUSIONS
Based on the grasp of big data methods and public
sector performance evaluation methods, this paper
develops a set of methods for evaluating government
public service performance using social media data
through expert consultation and combining existing
research results. It includes the methods for collection
and collation of media data, the evaluation index
screening method based on word frequency analysis,
the index weight establishment method based on dis-
criminant rate, the performance score calculation
method based on sentiment analysis, the public ser-
vice performance visualization based on performance
matrix and the public service performance influenc-
ing factors mining method based on semantic network
diagram.
Method Development of Evaluating Government Public Service Performance Based on Big Data Technology Using Social Media Data as
Evaluation Data
21

However, the current method still has room for
improvement: Firstly, due to the complexity and con-
fusion of the data, it may be difficult to achieve good
elimination and retention when cleaning. Secondly, in
terms of data analysis, there may be more appropriate
and effective ways to obtain assessment results and
explore influencing factors. These limitations need to
be further studied in the future.
REFERENCES
Anna Atefeh Farzindar & Diana Inkpen. Natural Language
Processing for Social Media, Third Edition [M]. San
Rafael: Morgan & Claypool Publishers, 2020: 2-3.
Arnaboldi M and Coget J. Social media and business:
We’ve been asking the wrong question! [J]. Organiza-
tional Dynamics, 2016, 45(1), 47-54.
Bamberger M. Integrating big data into the monitoring and
evaluation of development programmes [EB/OL].
[2019-11-15]. http:// unglobalpulse.org/ sites/default/
files/IntegratingBigData_intoMEDP_web_UNGP.pdf.
Ceron, A., Negri, F. The “Social Side” of Public Policy:
Monitoring Online Public Opinion and Its Mobilization
During the Policy Cycle[J]. Policy & Internet, 2016,
8(02): 131-147.
Dave Yates, Scott Paquette. Emergency knowledge man-
agement and social media technologies: A case study of
the 2010 Haitian earthquake[J]. Proceedings of the
American Society for Information Science and Tech-
nology, 2010, 47(1), 1-9.
Deborah Agostino, Michela Arnaboldi. Social media data
used in the measurement of public services effective-
ness: Empirical evidence from Twitter in higher educa-
tion institutions[J]. Public Policy and Administration,
2017, 32(04), 296-322.
Gao H, Barbier G and Goolsby R. Harnessing the
crowdsourcing power of social media for disaster re-
lief[J]. IEEE Intelligent Systems, 2011, 26(3), 10-14.
Guo, Qi & Mei, Hongyuan. Research on spatial distribution
and performance evaluation of mass sports facilities
based on big data of social media: A case study of har-
bin[C]. CAADRIA, 2020, 537-546.
Javier Fabra-Mata and Jesper Mygind. Big data in evalua-
tion: Experiences from using Twitter analysis to evalu-
ate Norway’s contribution to the peace process in Co-
lombia[J]. Evaluation, 2019, 25(1), 6-22.
Netzer O, Feldman R, Goldenberg J, et al. Mine your own
business: Market-structure surveillance through text
mining[J]. Marketing Science, 2012, 31(03): 521-543.
Nguyen T T, Quan T T, Phan T T. Sentiment search: An
emerging trend on social media monitoring systems[J].
Aslib Journal of Information Management, 2014,
66(05):553-580.
PMBDA 2022 - International Conference on Public Management and Big Data Analysis
22
