
Design of Multi Device Infusion Control and Monitoring System
Based on Internet of Things
Ruminto Subekti, Nur Jamiludin Ramadhan
a
and Riyan Septiana
Jurusan Teknik Otomasi Manufaktur dan Mekatronika, Politeknik Manufaktur Bandung, Jalan Kanayakan No. 21,
Dago, Coblong, Bandung, 40135, Indonesia
Keywords: Infusion, IoT, PID, Medical Device.
Abstract: The COVID-19 pandemic is spreading in almost all parts of the world. This situation requires the community
to comply with the efforts that have been made in various activities, including activities in hospitals. One of
these activities is the provision of nutrition to patients. Problems that are often found in the infusion process
include air bubbles in the hose, delays in changing the infusion flask, clogged liquid, excessive volume, and
the flowrate entering the body is not appropriate. The method used to build this tool is waterfall. Testing this
tool uses hardware consisting of ESP32 and Arduino nano as controllers, optocoupler sensors as droplet
detectors, bubble sensors as air bubble detectors, nextion and nodered as interfaces with users, servo motors
as hose presses, and buzzers as alarm indications. The findings show that droplet detection has an accuracy
rate of 100%, flowrate calculation has an accuracy of 94.52%, volume calculation has an accuracy of 95.53%,
hazard detection such as bubbles, exhausted liquid, clogged liquid, excess volume, and incorrect flowrate has
an accuracy of 100%, PID controller has parameters Kp = 0,057499, Ki = 0,099194, Kd = 0,0047985, the
control and monitoring process using nextion and nodered runs well.
1 INTRODUCTION
The COVID-19 pandemic is spreading in almost all
parts of the world. Recorded on December 27, 2021,
COVID-19 cases have reached 279,114,972 cases
with the number of deaths reaching 5,397,580.
(WHO, 2021). This has resulted in various efforts
made by the government to suppress the spread of
COVID-19 cases. These efforts include lockdowns,
maintaining distance, washing hands with soap and
using masks. This situation requires the community
to comply with the efforts that have been made in
various activities, including activities in hospitals.
One of these activities is providing nutrition to
patients which serves to maximize the healing process
for patients (Pitri et al., 2019). The provision of
nutrition is carried out through infusion therapy.
Hospital conditions that are full during a pandemic
result in the need for infusion therapy being very
important to do. To perform infusion therapy, the
nurse will count the droplets along with looking at the
clock to set the flowrate. This arrangement is carried
out because the impact of infusion dosing that is not
a
https://orcid.org/0000-0002-0909-0503
in accordance with patient needs can result in
endema, shortness of breath, high blood pressure, and
decreased urine quality (Mordhoko and Satria, 2013);
(Iskandar et al., 2018).
From these problems, it is found that several
previous studies have been conducted, including by
Primahayu (Primahayu et al., 2017) to create an
infusion fluid monitoring system. Red infusion fluid
in the flask is detected by image processing using a
camera. However, this system still has shortcomings,
namely infusion fluids are generally colorless, this
makes reading infusion fluids difficult to do. Another
research was conducted by D. Natalia (Natalia et al.,
2016) which resulted in an infusion monitoring tool
to determine the volume of infusion fluid by detecting
droplets in the chamber. However, in its application,
this tool still has shortcomings, namely that it cannot
be monitored remotely by nurses because it uses
cables.
The analysis results from previous studies did not
find any air bubble sensor in the system. Air bubbles
should not contaminate the patient's body because it
will poison the blood and will also cause embolism or
Subekti, R., Ramadhan, N. and Septiana, R.
Design of Multi Device Infusion Control and Monitoring System Based on Internet of Things.
DOI: 10.5220/0012056500003575
In Proceedings of the 5th International Conference on Applied Science and Technology on Engineering Science (iCAST-ES 2022), pages 1035-1042
ISBN: 978-989-758-619-4; ISSN: 2975-8246
Copyright © 2023 by SCITEPRESS – Science and Technology Publications, Lda. Under CC license (CC BY-NC-ND 4.0)
1035
the entry of foreign objects into the lungs (Kurrahman
, 2017). In addition, the results of the analysis of
previous research can be examined and improved in
terms of system deficiencies and combined into a new
system design that is better and more developed.
Therefore, this study was proposed which is expected
to help ease the burden on nurses, especially during
the COVID-19 pandemic and provide better handling
to patients who need infusion therapy.
2 PROBLEM FORMULATION
AND PROBLEM SOLVING
The lack of effective infusion facilities in middle-
class hospitals during the COVID-19 pandemic has
made it difficult for nurses to identify errors that
occur in patient infusions such as flowrate deviations,
excess volume values, fluid blockage, fluid depletion,
and air bubbles in patient infusion tubes. In addition
to the flowrate instability in the infusion, there is a
risk of worsening the patient's condition. Nurses must
also monitor the condition of multiple infusions
without having to be in physical contact with the
patient for a long time.
To overcome these problems, a study was made in
the form of 2 infusion devices that can perform the
function of controlling the flowrate value by pressing
on the hose and monitoring hazardous conditions in
patient infusion, including: deviation of flowrate
value, deviation of volume value, infusion fluid runs
out, clogged infusion fluid, and detection of air
bubbles in the infusion hose which will be displayed
in the Human Machine Interface (HMI). The HMI
will display the sensor data sent by the
microcontroller. In addition, the microcontroller also
sends data to the cloud database in real time through
the application server which will be displayed on the
monitor screen in the nurse's room.
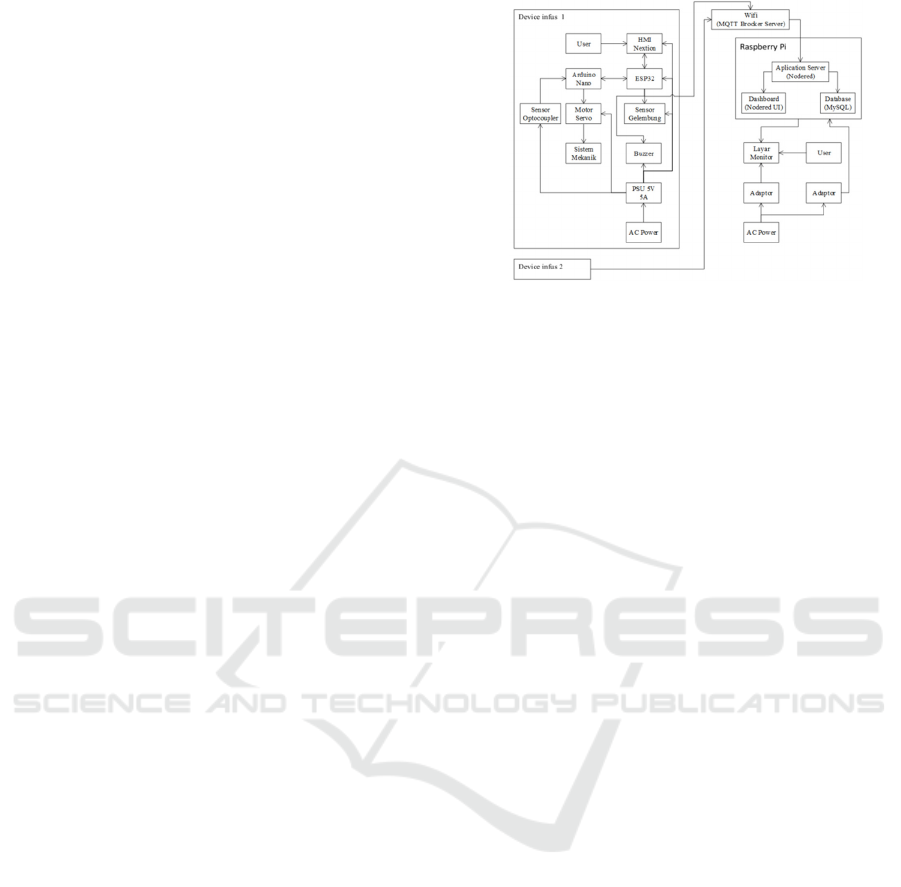
2.1 System Design
From the system architecture diagram in Figure 1, it
can be seen that the data transmission protocol used
in the Internet Of Things (IoT) system is MQTT
Brocker to perform a monitoring system for 2 infuse
devices on the monitor screen. The monitor screen
will display the Nodered UI IP installed on the
raspberry pi. The Nodered UI gets data from the
Nodered application server which will process all
data, receive data from the ESP32 microcontroller
and send data to MySQL. The infusion device itself
uses a bubble sensor to detect air bubbles in the
Figure 1: System Architecture Diagram.
infusion hose, an optocoupler sensor to detect
droplets and volume of infusion fluid, a servo motor
to clamp the infusion hose, a buzzer as an indication
in case of danger, and Nextion as an HMI. Arduino
nano and ESP32 have different roles, Arduino nano
will receive a signal from the optocoupler sensor then
will calculate the flowrate and volume values. From
the calculation of the flowrate value obtained,
Arduino nano will calculate the Proportional
Differential Integral (PID) algorithm to determine the
position of the servo motor. After that, the system will
send the data to ESP32 for further processing. ESP 32
itself will receive data from Arduino nano, then create
an alarm algorithm for infusion fluid administration.
ESP32 will receive a signal from the bubble sensor
then send a signal to the buzzer as an indication of
failure when the alarm algorithm works. In addition,
ESP32 will also send data to the HMI, server and
Arduino nano. All devices on the infuse device get a
power supply from an alternating current (AC) to
direct current (DC) adapter.
2.1.1 Flow Diagram
From the system flow diagram in Figure 2, it is known
that the system starts when the raspberry pi is turned
on and connected to Wi-Fi so that it can configure it
to nodered. After that the switch on the infuse device
is turned on and the ESP32 microcontroller will be
connected to Wi-Fi. The process continues by
entering parameters and pressing the start button on
the Nextion HMI. After that, the process of reading
the infusion liquid droplets by the optocoupler sensor
begins. When there are bubbles in the infusion hose,
it will cause a danger condition so that it sends a
signal to the buzzer to activate. When the buzzer is
active, the user can press the 'mute' button to turn off
the buzzer. When there are no drops within a certain
period of time, it will also cause a danger condition
and activate the buzzer again. When there is no
iCAST-ES 2022 - International Conference on Applied Science and Technology on Engineering Science
1036
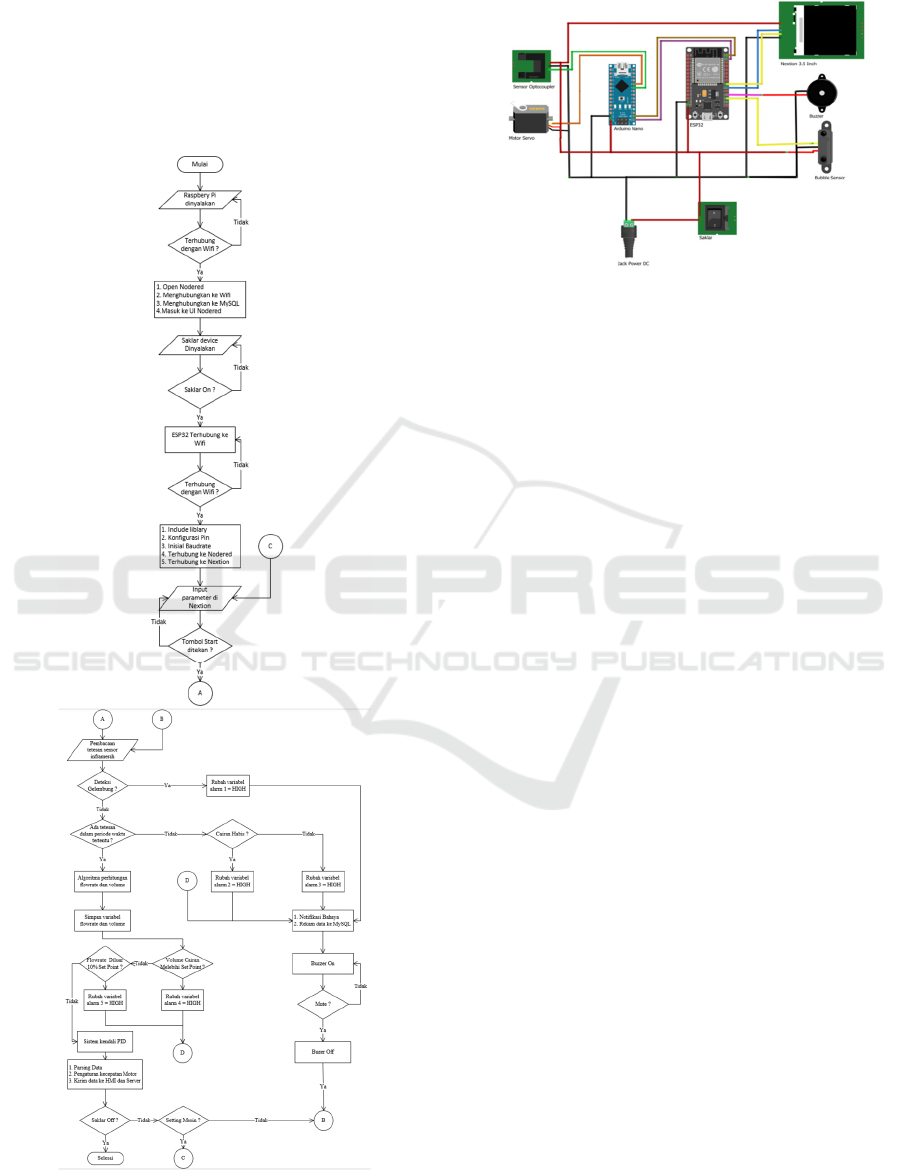
danger condition, the Arduino nano microcontroller
will calculate the flowrate and volume calculation
algorithm. Furthermore, the microcontroller will
calculate the control system from the flowrate
variable obtained to regulate the flow of liquid
through the speed of the servo motor. The final
process of the ESP32 microcontroller will send data
to the Nextion HMI and nodered server.
Figure 2: System Flowchart.
2.1.2 Electrical Design
Figure 3: Electrical Design.
As seen in Figure 3, this research uses 2
microcontrollers, namely Arduino nano and ESP32.
Both microcontrollers have their respective roles.
ESP32 is used to perform centralized data
communication between all elements. ESP32 will
communicate with HMI Nextion through Universal
Asynchronous Receiver Transmitter (UART) serial
data to display data and control parameters on the
infuse device. Then the parameter data will be sent to
Arduino nano to be processed. In addition, ESP32
will also send data to the server using MQTT broker.
While the Arduino microcontroller plays a role to
perform the control function using the control system.
Where the control system input is obtained from the
flowrate algorithm from the droplet reading results by
the optocoupler sensor while the control system
output will be used to move the servo position. Data
transmission between ESP32 and Nextion is done
through UART serial data. There are 3 data sent by
ESP 32, namely alarm, flowrate value, and volume
value. While Nextion will send 4 data, namely the
flowrate set, volume set, ON button and reset button.
In addition, data transmission is also carried out
between ESP32 and Arduino nano via UART serial
data. There are 4 data sent by ESP32, namely ON
condition, set flowrate, set volume, and reset
condition. While Arduino nano will send 3 data,
namely the flowrate value, volume value, and clogged
alarm condition.
2.1.3 PID Control System Design
The PID control system in this research is used to
control the infusion flowrate so that it can be aligned
with the manual input given by the Nextion HMI. PID
input is given from the calculation of the flowrate
calculation. In this study, the flowrate calculation was
obtained by determining how many drops of liquid in
one minute. Illustration of taking flowrate
Design of Multi Device Infusion Control and Monitoring System Based on Internet of Things
1037
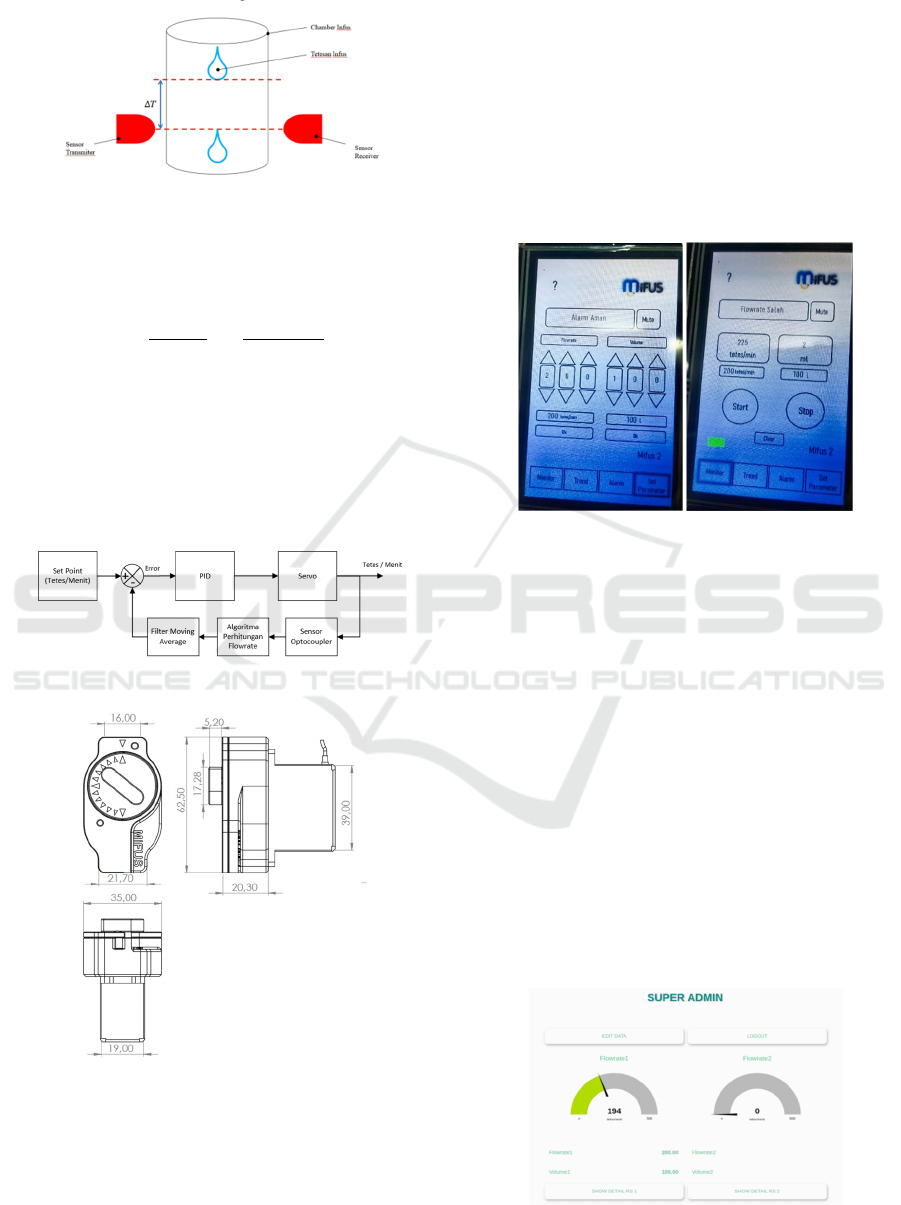
calculations can be seen in Figure 4 below.
Figure 4: Flowrate Data Retrieval.
Where ∆T is the cycletime or time required to
complete one droplet. To determine the resulting
flowrate can be seen in the following equation (1).
𝑓
𝑙𝑜𝑤𝑟𝑎𝑡𝑒
𝑑𝑟𝑜𝑝𝑠
𝑚𝑖𝑛𝑢𝑡𝑒
60000
𝐶𝑦𝑐𝑙𝑒𝑡𝑖𝑚𝑒
(1)
Figure 5 is a block diagram design where the PID
setpoint is drops/minute. The setpoint will be
compared with the flowrate obtained from the plant
through the optocoupler sensor reading and will be
stored in the error variable. The variable will be sent
to the PID to be calculated based on the
predetermined formula.
Figure 5: Block Diagram of Control System.
Figure 6: Infusion Hose Pressing System Design.
The output of the PID will be used as pulse width
modulation (PWM) to drive the servo motor. The
servo motor will clamp the hose based on the angle of
emphasis, the smaller the angle given, the greater the
emphasis on the infusion hose so that the droplets will
be inhibited. Conversely, the greater the angle given,
the smaller the emphasis will be on the infusion hose
so that the droplets will flow quickly. This principle
will be controlled by PID. A picture of the mechanical
system on the hose emphasis can be seen in Figure 6.
3 RESULTS
3.1 HMI Display Testing
Figure 7: Implementation of HMI Nextion.
Figure 7 below shows the machine settings window.
Testing is done by doing a setpoint flowrate of 200
and a volume of 100. After pressing the 'OK' button,
the parameters under the machine settings change
according to the inputted set point. Testing is done by
pressing the start button to start the system. After that,
the flowrate and volume will be updated according to
actual conditions. In addition, there is a green
indicator to indicate the system is running.
3.2 Dashboard Display Testing
In Figure 8 below can be seen the super admin
window. Testing is done by activating the infuse
device and entering the set point on the HMI nextion.
The result is that the set point value and realtime value
of the flowrate and volume variables enter the super
admin dashboard.
Figure 8: Nodered Dashboard Implementation.
iCAST-ES 2022 - International Conference on Applied Science and Technology on Engineering Science
1038
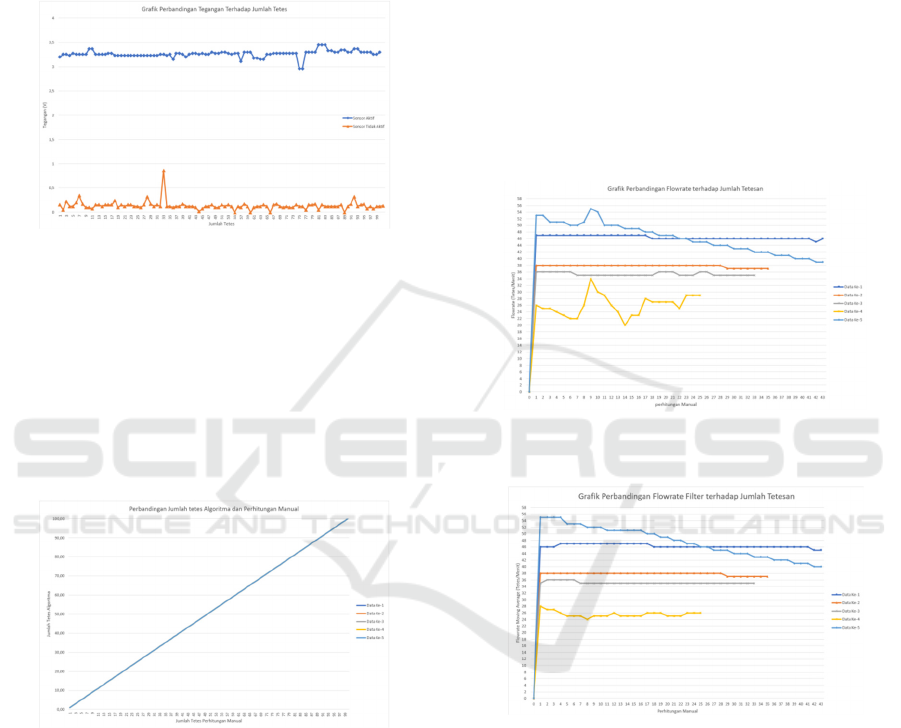
3.3 Testing Droplet Sensor Readings
Optocoupler sensor testing is carried out with the aim
of knowing the accuracy of sensor readings. Testing
is done using an Arduino Uno, optocoupler sensor
and voltage sensor. The following is a comparison
table.
Figure 9: Comparison Chart of Voltage Against Number of
Drops.
From the 100 sample data obtained based on Figure
9, it is known that when the optocoupler sensor is
active, the voltage will range from 2.96V to 3.45 V,
and when the sensor is not active, the sensor will have
a voltage ranging from 0V to 0.86V. In addition,
sensor testing is also carried out by comparing the
calculations in the algorithm with manual
calculations. The following is a comparison graph.
Figure 10: Comparison Chart of Number of Drops Sensor
Calculation and Manual Calculation.
Figure 10 is a comparison of the number of drops
detected by the optocoupler sensor and manual
calculation at a relatively medium speed and can be
seen with the human eye. Testing was carried out 5
times by taking sample data of 100 drops. The results
of each experiment show linear data between the
amount of liquid detected by the sensor and the
amount of liquid calculated manually. The difference
is obtained when the speed of the drops cannot be
seen by the human eye where the algorithm will
produce noise data. This can occur because there is a
delay of 50 ms in the sensor reading. So that with a
drop speed that is too fast, some drops of liquid are
not detected by the sensor. This is the case when the
sensor reading delay is reduced to 5 ms. This makes
the sensor not very accurate when detecting a
relatively medium or even slow drip speed. Because
the sensor will detect 2 to 3 times for one drop. With
a relatively moderate speed, it can be concluded that
the sensor reading has an accuracy of 100%.
3.4 Flowrate Accuracy Testing
Flowrate accuracy testing is done by comparing the
flowrate algorithm with the reading of the drip value
for 1 minute. the following is a table of flowrate
accuracy testing data.
Figure 11: Comparison Chart of Flowrate to Number of
Drops.
Figure 12: Comparison Chart of Filter Result Flowrate
against Number of Drops.
Figure 11 and Figure 12 are the comparison of
flowrate to the number of drops. The experiment was
conducted 5 times with different speeds. There are 2
data taken, namely flowrate data and filtered flowrate
data using the moving average method. The purpose
of using the moving average filter is to eliminate error
data that often appears. The algorithm will calculate
10 data samples and then average them. After
obtaining the 11th data, the 1st data will be discarded
so that there are still 10 data samples. The following
is the difference in errors generated with and without
using a moving average filter.
Design of Multi Device Infusion Control and Monitoring System Based on Internet of Things
1039
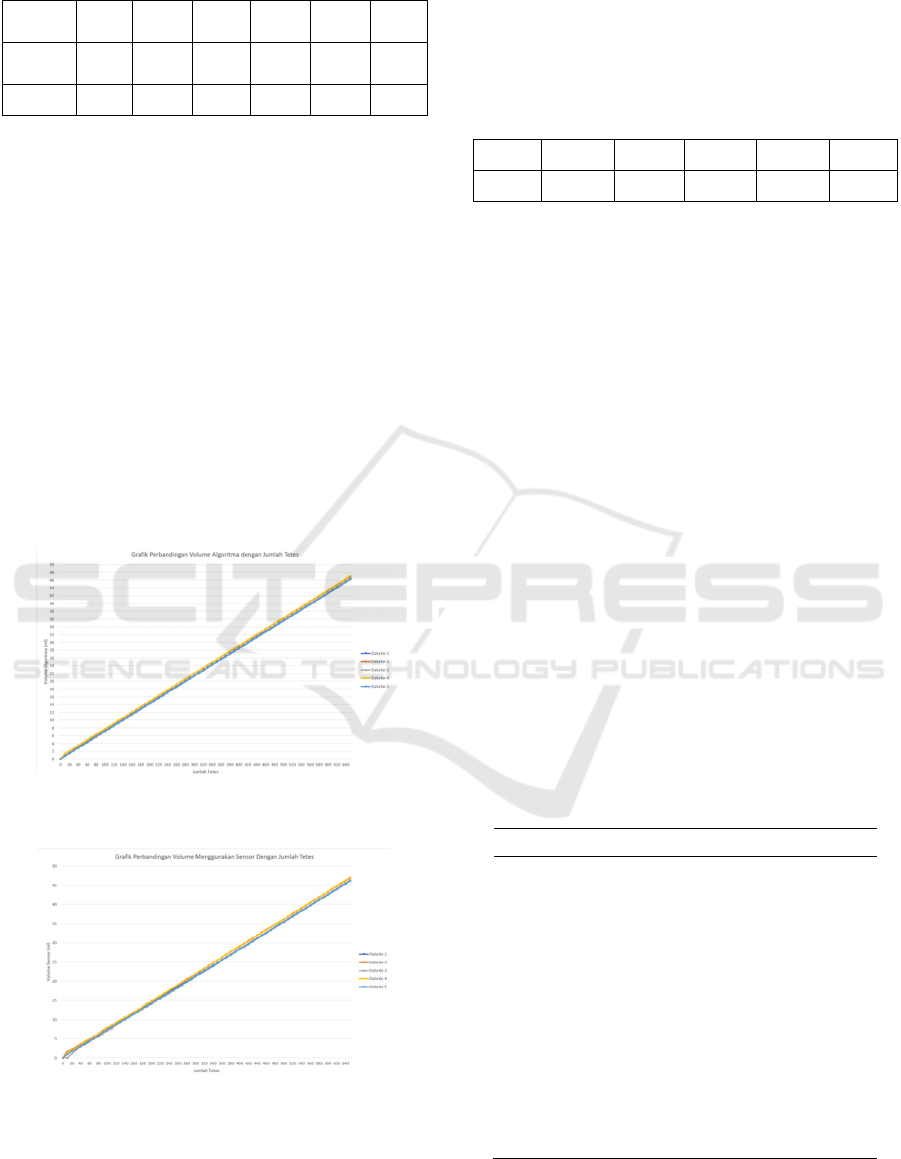
Table 1: Error Table of Filter and Non-Filter Flowrate.
Descript
ion
1st
data
2nd
data
3rd
data
4th
Data
5th
Data
avera
ge
Non
Filte
r
6,98% 5,71% 6,06% 16,00% 9,30% 8,81%
Filter 4,65% 5,71% 6,06% 4,00% 6,98% 5,48%
From Table 1 above, it can be seen that the error
obtained from the moving average filter results is
lower if without using the filter at all. The difference
occurs because there are some error data captured by
the system. In addition, sensor readings greatly affect
the delay time between droplets. From the
experiments that have been carried out, it can be
concluded that the reading of the flowrate value using
the moving average filter produces an accuracy of
94.52%.
3.5 Volume Accuracy Testing
Volume accuracy testing is done by comparing the
volume algorithm with the volume value reading
using the sensor. The following is a graph of the
experiment results.
Figure 13: Comparison Chart of Algorima Volume against
Number of Drops.
Figure 14: Comparison Chart of Volume Using Sensor
Against Number of Drops.
Figure 13 and Figure 14 are the comparison of
volume to the number of drops. Testing was done 5
times by comparing the volume obtained from the
algorithm with the loadcell sensor. The volume of the
algorithm is obtained using the linear regression
method and produces 14.6 drops for 1 ml. based on
the data that has been obtained, the error table is as
follows.
Table 2: Volume Accuracy Error Table.
1st data 2nd data 3rd data 4th Data 5th Data average
2,5% 2,17% 0,66% 16,1% 0,90% 4,4%
Error data in Table 2 is influenced by the different
volume of droplets flowing in the infusion hose. Each
droplet does not run linearly as shown by the volume
in the algorithm. This happens because of the
difference in pressure in the infusion flask when the
initial condition and the condition afterwards. The
decrease in volume in the infusion flask results in a
decrease in the pressure contained in the flask. This
causes the drip speed and volume of each drop to
change along with the decreasing pressure in the
infusion flask. From the experiments that have been
carried out, it can be concluded that reading the
volume value using the linear regression method
produces an accuracy of 95.53%.
3.6 Alarm Testing
3.6.1 Bubble Alarm Testing
Bubble alarm testing is done by placing the bubble
sensor on the infusion hose. To get bubbles, the
infusion hose is removed from the flask for a while
and then put back in the flask. The following is a table
of tests carried out.
Table 3: Bubble Alarm Testing Table.
Trial Bubble Sensor Alarm
1 0 OFF
2 0 OFF
3 0 OFF
4 0 OFF
5 1 ON
6 1 ON
7 1 ON
8 0 OFF
9 0 OFF
10 1 ON
Based on table 3, namely the bubble alarm test above,
it can be concluded that the accuracy of detecting a
iCAST-ES 2022 - International Conference on Applied Science and Technology on Engineering Science
1040
bubble alarm is 100%.
3.6.2 Testing the Liquid out Alarm
Testing the liquid running out alarm is done by testing
the volume read on the algorithm. Furthermore, the
alarm will activate when the volume is close to 10%
of the set volume. The set volume in the test is 50
milli liters. The following are the results of the test.
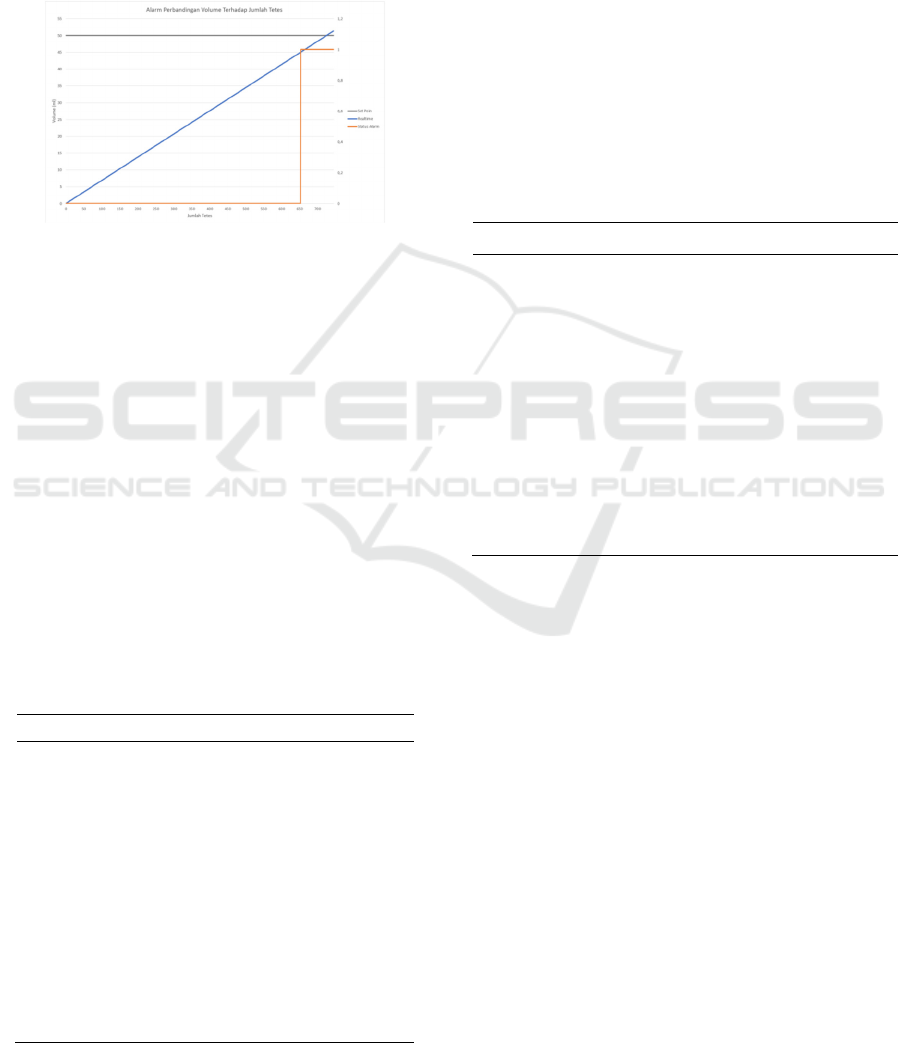
Figure 15: Liquid Out Alarm Response Chart.
Based on Figure 15, which is testing the liquid alarm,
it can be seen that the set volume is 50 milliliters.
While the alarm will be active when the volume is
close to 10% of the set point, which is more than 45
milliliters. From the test results it can be seen that the
alarm is active when the volume reaches 45.54
milliliters. The conclusion of this test is that the alarm
is functioning properly.
3.6.3 Clogged Liquid Alarm Testing
Testing the clogged liquid alarm is done by testing the
time difference between droplets. The alarm will
activate when there is no dripping for more than 10
seconds. To cause a blockage effect, the hose will be
clamped for more than 10 seconds. The following is
a table of test results.
Table 4: Clogged Liquid Alarm Testing Table.
Trial Drip time difference Alarm
1 2,2 OFF
2 1,8 OFF
3 1,4 OFF
4 2,2 OFF
5 0,8 OFF
6 1,8 OFF
7 7,2 OFF
8 10,1 ON
9 22,3 ON
10 0,1 OFF
Based on Table 4, namely testing the clogged liquid
alarm, it can be seen that the alarm will function when
the difference in drip time has exceeded 10000
milliseconds or 10 seconds. The 7th and 8th drops
have a drip time difference of 100062 milliseconds.
The 8th and 9th drops have a drip time difference of
22256 milliseconds. So the alarm is active on the 7th
drop and the 8th drop. The conclusion of this test is
that the alarm is functioning properly.
3.6.4 False Flowrate Alarm Testing
Testing the wrong flowrate alarm is done by testing
the difference between the set flowrate and the
flowrate generated by the algorithm. This alarm will
be activated when the resulting difference exceeds
10%. The following is a table of test results.
Table 5: False Flowrate Testing Table.
Trial- Set Flowrate Flowrate Alarm
1 60 54 OFF
2 60 54 OFF
3 60 53 ON
4 60 53 ON
5 60 53 ON
6 60 53 ON
7 60 54 OFF
8 60 54 OFF
9 60 119 ON
10 60 425 ON
Testing the wrong flowrate alarm is done by
testing the difference between the set flowrate and the
flowrate generated by the algorithm. This alarm will
be activated when the resulting difference exceeds
10%. The following is a table of test results.
3.6.5 Excess Volume Alarm Testing
Testing the excess volume alarm is done by testing
the volume read on the algorithm. Furthermore, the
alarm will be active when the volume has exceeded
the set volume. The following is a table of test results.
Design of Multi Device Infusion Control and Monitoring System Based on Internet of Things
1041
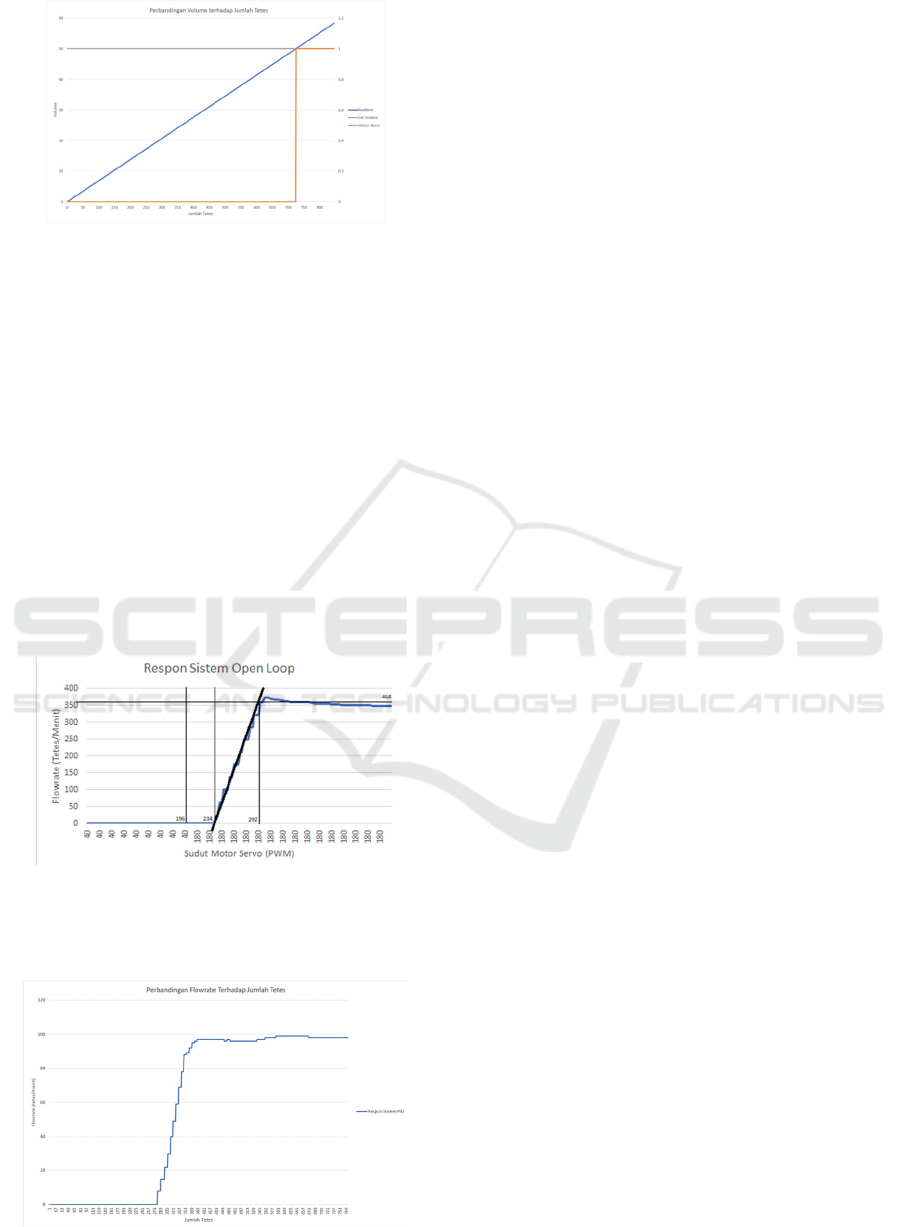
Figure 16: Excess Volume Alarm Response Chart.
Based on Figure 16, the excessive volume alarm test,
it can be seen that the set volume is 50 milliliters.
Furthermore, the alarm is active when the volume is
more than 50 milliliters. This happens when the
droplets have reached 740 with a volume of 50.37
milliliters. The conclusion of this test is that the alarm
is functioning properly.
3.7 PID Control System Testing
Testing the control system is done by giving step
input to the system. To apply to the plan, first the
servo motor is closed tightly so that no liquid drips,
then open the servo fully so that the liquid can flow
and record the resulting flowrate. The following are
the results of open loop system testing.
Figure 17: System Open Loop Response.
By using Kp =0.037499, Ti =0.029194, Td = 0.0047
985. Then the resulting system response is as follows.
Figure 18: System Close Loop Response Graph.
4 CONCLUSIONS
Based on the results of data analysis and discussion
that has been carried out, there are several
conclusions that can be drawn including the
following.
1. Droplet detection using an optocoupler sensor
has an accuracy of 100%.
2. The calculation of the flowrate value on the
infuse device with the moving average filter
method has an accuracy of 94.52%.
3. The calculation of the volume value on the
infusion device has an accuracy of 95.53%.
4. Detection of infusion errors such as bubbles,
fluid depletion, fluid blockage, incorrect flowrate
and excessive volume can be done well.
5. Flowrate control using PID control system can
run as expected and has parameters Kp =
0,057499, Ki = 0,099194, Kd = 0,0047985.
6. The process of controlling and monitoring each
infuse device using the nextion HMI runs well
for all windows.
7. The centralized monitoring process using
nodered dashboard can run well for all windows.
REFERENCES
(2021), “WHO Coronavirus (COVID-19) Dashboard _
WHO Coronavirus (COVID-19) Dashboard with
Vaccination Data.” https://covid19.who.int/
A. D. Pitri, S. Ismail, M. E. Magister, K. Departemen,
K. Fakultas, and K. Universitasdiponegoro,
“EKSPLORASI Peran Perawat Dan Ahli Gizi
Dalam Pemberian NUTRISI PADA PASIEN
KRITIS,” 2019.
K. Mordhoko and F. Chandra Satria Arisgraha,
“Rancang Bangun Sistem Optimasi INFUS
DROP RATE,” 2013.
D. Iskandar, A. Kholiq, J. Teknik, E. Politeknik, K.
Kementerian, and K. Surabaya, “Analisis Infus
Set Terhadap Keakurasian Infus Pump Di Ruang
ICU RSUD KARANGANYAR,” 2018. [Online].
Available: https://halosehat.com/review/tindakan
R. A. Primahayu, F. Utaminingrum, and D. Syauqy,
“Sistem Monitoring Cairan Infus Terpusat
Menggunakan Pengolahan Citra Digital,” 2017.
[Online]. Available: http://j-ptiik.ub.ac.id
D. Nataliana, N. Taryana, and E. Riandita, “Alat
Monitoring Infus Set pada Pasien Rawat Inap
Berbasis Mikrokontroler ATmega 8535,”
Bandung, Jan. 2016.
T. Kurrahman, “Pendeteksi Gelembung Udara Pada
Pemberian Cairan infuse,” Universitas
Muhammadiyah Yogyakarta, Yogyakarta, 2017.
iCAST-ES 2022 - International Conference on Applied Science and Technology on Engineering Science
1042
