
Learning Algorithms for Cervical Cancer Detection
Marco Antonio Acevedo
1
a
, María Elena Acevedo
1
b
and Sandra Dinora Orantes
2
c
1
Instituto Politécnico Nacional, ESIME Zacatenco, Av. Lindavista, Mexico City, Mexico
2
Instituto Politécnico Nacional, CIC, Mexico City , Mexico
Keywords: Artificial Intelligence, Machine Learning, K-NN Algorithm, Artificial Neural Networks, Diagnosis, Cervical
Cancer.
Abstract: Cervical cancer begins in the cervix, the lower part of the uterus (womb) that opens into the upper part of the
vagina. Worldwide, cervical cancer is the third most common type of cancer in women. This type of cancer
can be detected visually with pap-smear images. A secondary alternative is to evaluate the relevant risk factors
to see the possible formation of cervical cancer; these factors are recorded in a questionary. In this paper, the
dataset from the questionary is analysed with two machine learning algorithms: K-NN and Multi-Layer
Perceptron. We proposed the architectures and the parameters which achieve the best results. Two validation
algorithms were applied: K-Fold Cross-Validation and Hold Out (80-20). The results from the machine
learning algorithms were: 100% with 1-NN and Multi-Layer Perceptron together with K-Fold Cross-
Validation and 97% with 1-NN and 98% when Multi-Layer Perceptron was applied, and the validation
algorithm was Hold-Out.
1 INTRODUCTION
Cervical cancer (INM, 2021) (CC) is the growth,
development, and disorderly and uncontrolled
multiplication of cervical cells, which is the lower
part of the uterus (womb) that empties into the upper
part of the vagina.
Worldwide, cervical cancer is the fourth most
frequent cancer in women. In 2020 it had an incidence
of 604 000 new cases (Link 1). In the same year, there
were 342,000 deaths from cervical cancer, and about
90% of these occurred in low- and middle-income
countries. When women present the Human
Immunodeficiency Virus (HIV), they are six times
more likely to develop cervical cancer than women
without HIV, and an estimated 5% of all cervical
cancer cases are attributable to HIV. Moreover,
globally, HIV contributes to cervical cancer falls
disproportionately on younger women. In Mexico,
cervical cancer is the second leading cause of cancer
death in women (GM, 2015). An annual occurrence
of 13,960 cases in women is estimated, with an
incidence of 23.3 cases per 100,000 women. For
a
https://orcid.org/0000-0002-3535-1164
b
https://orcid.org/0000-0001-8179-0398
c
https://orcid.org/ 0000-0002-8626-5936
2019, the CC mortality rate in women aged 25 years
and over was 10,410 deaths per 100 thousand women.
Among the primary malignant tumours from which
women aged 25 and over die, CC is in second place,
with 13.2% of deaths from malignant tumours. By
age group, the mortality rate of cervical-uterine
cancer goes from 10.7 deaths per 100 thousand
women aged 40 to 49 years to 18.0 in women aged 50
to 59 years and 33.8 in women 60 and older. The
exams for the diagnosis of cervical cancer are (Cohen,
2019): pelvic examination, visualization of the cervix
and vaginal mucosa, cervical cytology, HPV test, and
colposcopy. All of these exams are invasive, and they
are intimately annoying for women. In this paper, we
propose Machine Learning algorithms to diagnose
cervical cancer based on data from questions to
women about some events throughout their life.
Literature Review
Table 1 shows the related work with our proposal.
The description column indicates the dataset used and
the algorithms applied to achieve the detection.
782
Acevedo, M., Acevedo, M. and Orantes, S.
Learning Algorithms for Cervical Cancer Detection.
DOI: 10.5220/0012047400003612
In Proceedings of the 3rd International Symposium on Automation, Information and Computing (ISAIC 2022), pages 782-787
ISBN: 978-989-758-622-4; ISSN: 2975-9463
Copyright
c
2023 by SCITEPRESS – Science and Technology Publications, Lda. Under CC license (CC BY-NC-ND 4.0)

Table 1. Related work to cervical cancer detection.
Year Title Author Description Results
2020
An Automatic Mass
Screening System for
Cervical Cancer
Detection Based on
Convolutional Neural
Network (Rehman, 2020)
Aziz-ur -Rehman,
Nabeel Ali, Imtiaz.A.
Taj, Muhammad Sajid ,
and Khasan S.
Karimov
Dataset: Cervical Cells images.
Algorithms: Softmax regression (SR), Support
vector machine (SVM), and GentleBoost
ensemble of decision trees (GEDT), and two
protocols: 2-class problem and 7-class problem.
2-class problem
SR 98.8%, SVM 99.5%,
GEDT 99.6%.
7-class problem
SR 97.21%, SVM 98.12%,
GEDT 98.85%.
2021
Automatic model for
cervical cancer screening
based on convolutional
neural network: a
retrospective,
multicohort, multicenter
study (Tan, 2021)
Xiangyu Tan1, Kexin
Li, Jiucheng Zhang,
Wenzhe Wang, Bian
Wu, Jian Wu, Xiaoping
Liand Xiaoyuan Huang
Dataset: 424,106 images from ThinPrep
cytologic test. Algorithm: Faster region
convolutional neural network.
Sensitivity: 99.4%,
Specificity: 34.8%.
Sensitivity for atypical
squamous cells of
undetermined significance:
89.3%; low-grade squamous
intraepithelial lesion: 71.5%,
and high-grade squamous
intraepithelial lesions:
73.9%.
2021
Classification of Cervical
Cancer Detection using
Machine Learning
Algorithms (Arora, 2021)
Aditya Arora, Anurag
Tripathi and Anupama
Bhan
Dataset: Herlev pap-smear image. Algorithms:
Active contour models for segmentation and
three types of Support Vector Machines for
classification: Polynomial order 4, Gaussian
RBF, and Quadratic.
Accuracy:
Polynomial SVM order 4:
95%, Gaussian RBF SVM:
85%, and Quadratic SVM -
85%.
2021
Classification of cervical
cancer using Deep
Learning Algorithm
(Tripathi, 2021)
Anurag Tripathi,
Aditya Arora, and
Anupama Bhan
Dataset: SIPAKMED pap-smear image.
Algorithms: ResNet50, ResNet-152, VGG-16,
VGG-19
Accuracy:
ResNet50: 93.87%, ResNet-
152: 94.89%, VGG-16:
92.85%, and VGG-19:
94.38%.
2021
DeepCervix: A deep
learning-based
framework for the
classification of cervical
cells using hybrid deep
feature fusion techniques
(
Rahaman, 2021
)
Md Mamunur
Rahamana, Chen Li,
Yudong Yao, Frank
Kulwa, Xiangchen Wu,
Xiaoyan Li, and Qian
Wang
Dataset: Herlev. Algorithm: DeepCervix, a
hybrid deep feature fusion technique with two
protocols: 2-class problem and 7-class problem.
Accuracy:
2-class problem: 98:32% and
7-class problem: 90:32%.
2021
Machine Learning
Assisted Cervical Cancer
Detection (Mehmood,
2021)
Mavra Mehmood,
Muhammad Rizwan,
Michal Gregus ml, and
Sidra Abbas
Dataset: Cervical cancer (Risk Factors) [11].
The same dataset was used in our proposal.
Algorithms: Random Forest (RF) for feature
selection, and an RF and shallow neural
networks combination as a
p
redictor.
Number of instances for:
Training: 70%, Validation:
15, and Test: 15. Accuracy =
93.6%
The papers from the first five rows used images as a
dataset, while the last work analysed the same dataset
used in this paper. In the Results column appears
standard classification metrics but mainly the
accuracy of the algorithms.
2 METHODS AND MATERIALS
In this section, the algorithms for cervical detection
will be described together with the data set. Also, we
will present the metrics to analyse the performance of
the algorithms.
2.1 Dataset
The dataset was collected at Hospital Universitario de
Caracas in Caracas, Venezuela (Link 2). It has 858
instances with 36 attributes. There are missing values
because some patients decided not to answer some
questions. In (Mehmood, 2021), the authors detected
the cases with missing values and decided to remove
them; they worked with 737 rows. In this paper, we
carried out the same task but worked with 672
instances from the original dataset. In Table 2, some
of the attributes of the dataset are shown.
We used the Biopsy (Boolean) attribute as the
target value. All the attributes with Boolean values
were converted to integers (0 and 1)
The data set is unbalanced, with 655 instances
from class 0 and 17 from class 1. Therefore, the
method SMOTE from Python was applied, resulting
in 655 attributes in class 0 and 655 attributes in class
1. So, finally, we have 1310 records.
Table 2: The attributes of the dataset analysed in this work.
Attribute Type
Age Integer
Number of sexual partners Integer
First sexual intercourse (age) Integer
Num of pregnancies Integer
Smokes Boolean
Hormonal Contraceptives Boolean
IUD (years) Integer
STDs (number) Integer
STDs:condylomatosis Boolean
Learning Algorithms for Cervical Cancer Detection
783

2.2 Artificial Neural Networks
An Artificial Neural Network (ANN) is a set of
interconnected neurons that emulate brain function. It
consists of one input layer, one output layer, and
hidden layers. The input layer receives the data of the
problem to resolve, for example, the value of
attributes or values of pixels in an image. The output
layer will yield the values for the solution of the
problem, either a class for classification or diagnosing
or a value for prediction. The hidden layers process
the data; at the end of the evaluation of each neuron,
a transfer function is applied. The training of the
network stops when minimal error is achieved. The
error decreases in each epoch through the gradient
descent algorithm. A fully interconnected, not
recurrent Multi-Layer Perceptron is the architecture
that will be applied in this paper.
2.3 K-Nearest Neighbours Algorithm
The k-nearest neighbor algorithm (Shai, 2014) is a
technique for classifying objects based on closest
training examples in the problem space. The k-nearest
neighbor algorithm is among the simplest of all
machine learning algorithms: similar things exist
nearby and are close to each other. An object is
classified by a majority vote of its neighbors, with the
object being assigned to the class most common
amongst its k nearest neighbors (k is a positive
integer). If k = 1, then the object is simply set to the
class of its nearest neighbor. Now, the algorithm will
be described. It will be assumed that the instance
domain, X, is endowed with a metric function p. This
is p: X x X → ℜ is a function that returns the distance
between any two elements of X. For example, if X =
ℜ
d,
then p can be the Euclidean distance, as it is
shown in Equation (1).
𝑝
𝑥,𝑥
=
‖
𝑥−𝑥′
‖
=
𝑥
−𝑥′
(1)
2.4 Metrics
In this sub-section, we will present the metrics to
evaluate the performance of the classification
algorithms used in this paper. The metrics are
numerical and graphical.
2.4.1 Confusion Matrix
The confusion matrix or error matrix (Ariza, 2018)
shows the results of the predictions of the
classification algorithm. It is a table with different
combinations of n (the number of classes). Table 3
presents an example of a Confusion Matrix with two
different classes. In this Table, the number of
correctly classifications and the number of records in
which the algorithm confounded one class with the
other class can be observed. For example, in the
intersection of row 0 with column 1, the confusion
matrix shows how many records of class 0
confounded with class 1; this value is called false
positives. The intersection of row 0 and column 1 are
the true positives.
Table 3: Example of a Confusion Matrix of two classes.
Predicted values
01
Correct
values
0
Correctly classified
(
t
p)
Incorrectly classified
(
fn
)
1
Incorrectly classified
(
f
p)
Correctly classified
(
tn
)
From table 3, True Positive (tp) (Hossin, 2015) is the
number of the positive records that are correctly
classified; False negative (fn) is the number of
negative instances that are misclassified; False
positive (fp) is the number of misclassified positive
instances; finally, True Negative (tn) represents the
negative instances correctly classified.
2.4.2 Classification Metrics
There are important metrics to evaluate the
performance of classification algorithms defined in
the following equations. First, accuracy (Bateman,
2015) calculates the correct predictions given the total
number of predictions (Eq. (2)).
𝐴𝑐𝑐𝑢𝑟𝑎𝑐𝑦=
𝑁𝑢𝑚𝑏𝑒𝑟𝑜𝑓𝑐𝑜𝑟𝑟𝑒𝑐𝑡 𝑝𝑟𝑒𝑑𝑖𝑐𝑡𝑖𝑜𝑛𝑠
𝑇𝑜𝑡𝑎𝑙𝑜𝑓𝑝𝑟𝑒𝑑𝑖𝑐𝑡𝑖𝑜𝑛𝑠
=
=
(2)
Precision is defined id defined in Eq. (3). This
metric indicates the number of positives predicted
positives.
𝑃𝑟𝑒𝑐𝑖𝑠𝑖𝑜𝑛=
𝑡𝑝
𝑡𝑝 +
𝑓
𝑝
(3)
On the other hand, Eq. (4) defines the Recall,
which is the number of actual positives that are
correctly predicted as positive.
𝑅𝑒𝑐𝑎𝑙𝑙=
𝑡𝑝
𝑡𝑝 +
𝑓
𝑛
(4)
However, in some problems precision will have
higher priority than recall and vice versa. Therefore,
ISAIC 2022 - International Symposium on Automation, Information and Computing
784
there is a metric that combines recall and precision.
Eq. (4) defines F1-score.
𝐹1 − 𝑠𝑐𝑜𝑟𝑒= 2
𝑃𝑟𝑒𝑐𝑖𝑠𝑖𝑜𝑛 𝑅𝑒𝑐𝑎𝑙𝑙
𝑃𝑟𝑒𝑐𝑖𝑠𝑖𝑜𝑛+ 𝑅𝑒𝑐𝑎𝑙𝑙
(4)
This metric would take values between 0 and 1. A
value of zero means that both the precision and the
recall are zero, while if F1-score has a value of one,
both metrics will be equal to 1.
2.4.3 Receiver Operating Characteristic
(ROC) Curve
The ROC curve (Yang, 2017) represents the trade-off
between sensitivity and specificity. These two metrics
are inversely related; if one increases, the other
decreases. We define these metrics in Eq. (5), and Eq.
(6). Sensitivity (Kumar, 2011) or true positive rate
(TPR) is a conditional probability of correctly
identifying a disease.
𝑆𝑒𝑛𝑠𝑖𝑡𝑖𝑣𝑖𝑡𝑦=
𝑡𝑝
𝑡𝑝 +
𝑓
𝑛
(5)
Specificity or true negative rate (TNR) is a
conditional probability of correctly identifying a
normal condition.
𝑆𝑝𝑒𝑐𝑖𝑓𝑖𝑐𝑖𝑡𝑦=
𝑡𝑛
𝑡𝑛+
𝑓
𝑝
(6)
The Area Under the Curve (AUC) is an effective
measure that combines sensitivity and specificity to
validate the diagnostic test.
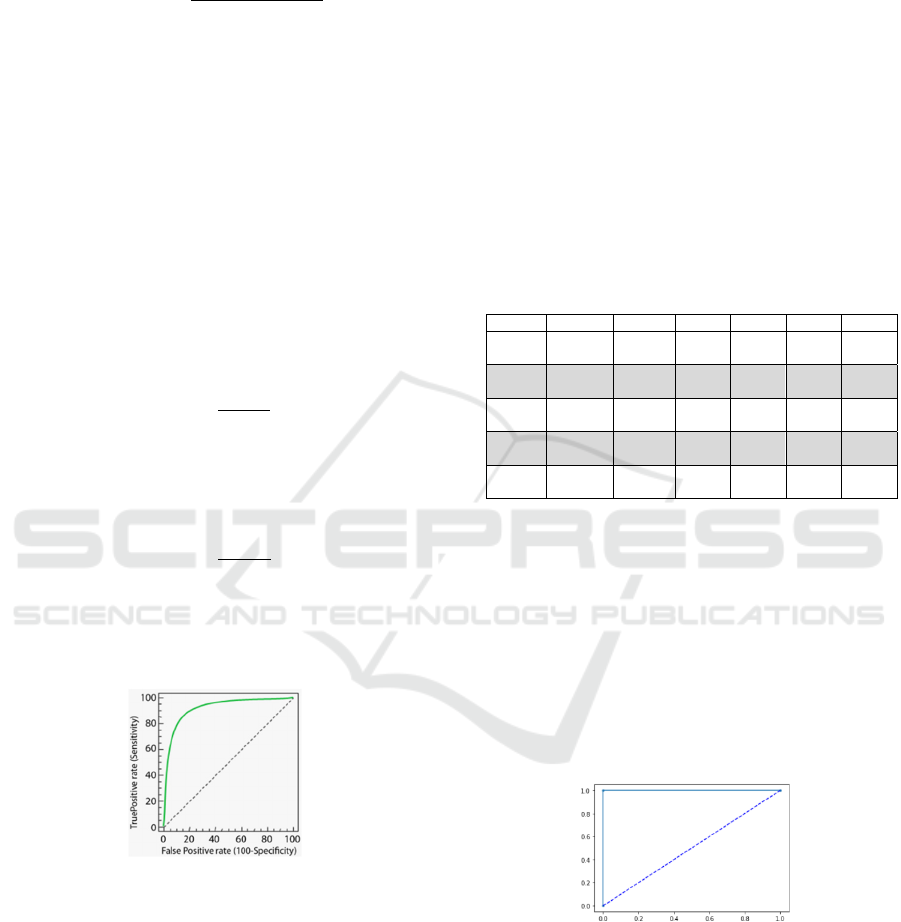
Figure 1: Example of ROC curve
Figure 1 depicts an example of a ROC curve. On
the Y-axis, we have the sensitivity, and the specificity
is on the X-axis. The best performance would be at a
point in the upper left corner, i.e., no false negative or
false positive. The diagonal is called a non-
discrimination line and is a random classification.
The point of a ROC random classifier will shift to the
position (0.5, 0.5). Points above the diagonal
represent good ranking results, and points below the
line for poor outcomes.
3 RESULTS
Two classification algorithms were applied to detect
cervical cancer: K-Nearest Neighbours (KNN) and
Multi-Layer Perceptron (MLP). The validation of the
algorithms was achieved by means of K-Fold Cross-
Validation and Hold-Out (80-20).
First, we present the results of K-NN algorithm.
The value of the K of the classification algorithm was
Knn = 1 (we used Knn to differentiate the K from K-
Fold Cross-Validation named as Kfcv) and Manhattan
distance. The value of Kfcv = 5. In Table 4, the
classification metrics for each iteration are shown.
Table 4: Classification metrics and Confusion matrices
from K-Fold Cross-Validation with Kfcv = 5, KNN
algorithm with Knn = 1, and Manhattan distance.
Table 4 shows that in iterations 1 and 3, the
algorithm confused just one instance, but the
precision and recall are equal to 0.99; that is the
reason F1-score = 1. This result means that the
performance of 1-NN algorithm is correct; also, the
accuracy is 1. Figure 2 shows de ROC curve for 1-
NN classifier. In this figure, it can be observed that
sensitivity and specificity had the value of 1, which
means that both classes were correctly classified.
Figure 2: ROC curve for 1-NN algorithm.
Table 5 shows the classification metrics from 1-
NN algorithm and Hold-Out (80-20) validation. We
can observe that the classifier confused 34 instances
belonging to class 0 as instances from class 1, which
is why a value of accuracy = 0.97. On the other hand,
all the cases from class 1 were correctly classified.
Iteration Precision Recall F1-score Accuracy Specificity Sensitivity
1 0.99 1 1 1 1 1
2 1 1 1 1 1 1
3 1 0.99
1
1
1 1 1
4 1 1 1 1 1 1
5 1 1 1 1 1 1
Learning Algorithms for Cervical Cancer Detection
785
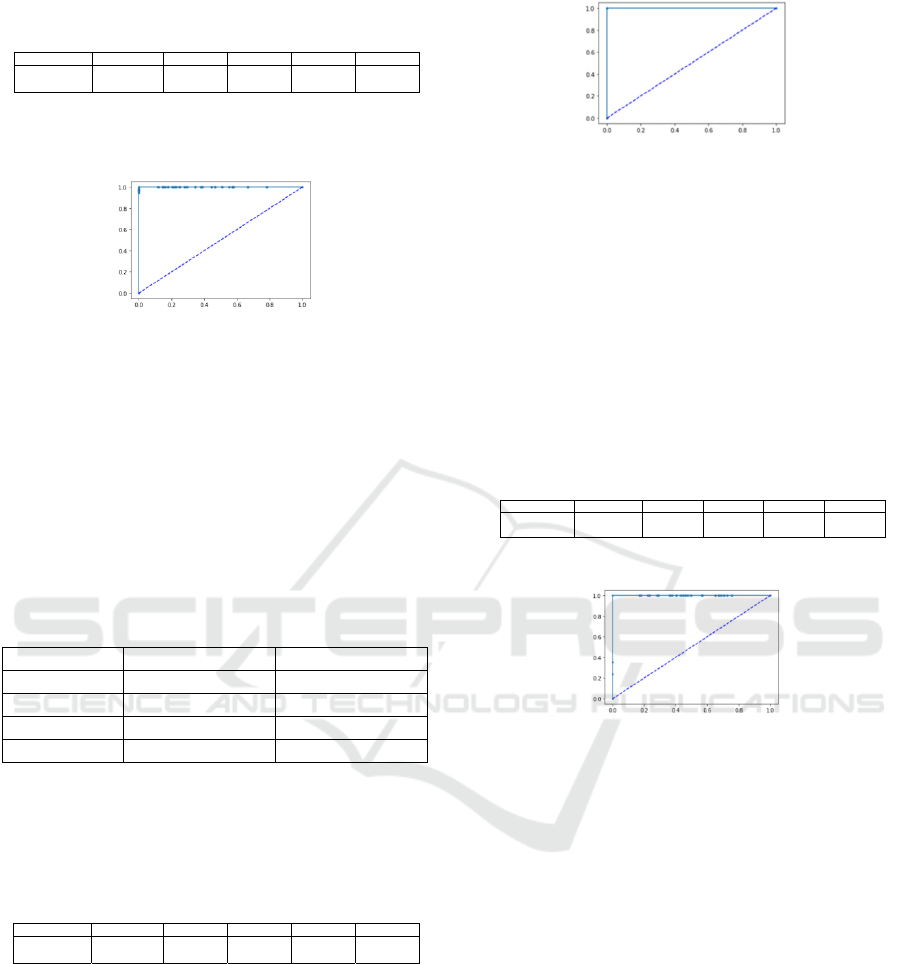
Table 5: Results of the classification metrics with 1-NN
algorithm and Hold-Out validation.
The ROC curve from 1-NN algorithm with hold-
out validation is shown in Figure 3.
Figure 3: Results of ROC curve with 1-NN classifier and
the validation with Hold-Out.
In this case, specificity had a value of 1, but
sensitivity showed a value of 0.95. This behaviour is
reflected with some points over the x-axis line; the
line is not flat.
We present the results from the Multi-Layer
Perceptron with the same validation algorithms: Kfcv
= 5 and Hold-Out (80-20). The architecture of the
MLP is shown in Table 6.
Table 6: The architecture of the Multi-Layer Perceptron
proposed in this work.
Type of layer Number of neurons Activation function
Input 36 ReLu
Hidden 12 ReLu
Hidden 8 ReLu
Output 1 Sigmoidal
Table 7 shows the results from the Multi-Layer
Perceptron with K-Fold Cross-Validation. The same
results were obtained over the five iterations.
Table 7. Metrics from Multi-Layer Perceptron and the
validation algorithm K-Fold Cross-Validation.
Precision and recall are equal to 1, and sensitivity
and specificity had the same value, which can be
observed in Figure 4, which shows ROC curve.
Both lines, specificity and sensitivity, are flat
because the classification was correct for the two
classes.
Both lines, specificity and sensitivity, are flat
because the classification was correct for the two
classes.
Figure 4: ROC curve for MLP and K-Fold Cross-Validation
algorithm with Kfcv = 5.
In Table 8, we can observe the results from Multi-
Layer Perceptron. The algorithm confused 154
instances because it classified them as class 1 when
they belonged to class 0. That is the reason the
precision is less than 1. Therefore, sensitivity is equal
to 1, which is illustrated in Figure 5. However,
specificity is less than one, which is why the line on
the x-axis presents some blue points; namely, the line
is not flat.
Table 8: The classification metrics from Multi-Layer
Perceptron with the hold-out algorithm validation.
Figure 5: The ROC curve of MLP with Hold-Out algorithm
for validation.
The best results were obtained by the 1-NN
algorithm with the 100% of classification. Now, we
compare the results of our proposal with the results
from literature review.
From Table 9, we can observe that the sixth paper
[10] used the same dataset we used in this proposal.
The authors obtained the 93.6% of accuracy, and our
proposal showed accuracy in the range of 97% and
100%. Therefore, the parameters and the architecture
of the algorithms proposed in this paper overcome the
results from the work of Mehmood et al. The best
results come from the K-Fold Cross-Validation
algorithm.
4 CONCLUSIONS
A secondary alternative for malignant cervical
formation is to analyse some relevant risk factors
which are recorded in a questionary. The analysis of
Precision Recall F1-score Accurac
y
S
p
ecificit
y
Sensitivit
y
0.95 1 0.97 0.97 1 0.95
Precision Recall F1-score Accurac
y
S
p
ecificit
y
Sensitivit
y
1 1 1 1 1 1
Precision Recall F1-score Accurac
y
S
p
ecificit
y
Sensitivit
y
0.76 1 0.86 0.98 1 0.80
ISAIC 2022 - International Symposium on Automation, Information and Computing
786

these records was performed by means of two
algorithms of Machine Learning: K-NN and Multi-
Layer Perceptron. The results from both methods
reached 100% accuracy when they were validated
with K-Fold Cross-Validation algorithm, and they
accomplished 97 and 98% accuracy with Hold Out
Validation algorithm. The obtained results show that
these Machine Learning algorithms are suitable for
the analysis of risk factors because of their high
accuracy. Furthermore, even our lowest results are
greater than the results from [10] that used the same
dataset.
Table 9: Comparisons of the results from the related work.
Ref. Results
Rehman, 2020
2-class problem
SR 98.8%, SVM 99.5%, GEDT 99.6%.
7-class problem
SR 97.21%, SVM 98.12%, GEDT 98.85%.
Tan, 2021
Sensitivity: 99.4%, Specificity: 34.8%.
Sensitivity for atypical squamous cells of
undetermined significance: 89.3%; low-grade
squamous intraepithelial lesion: 71.5%, and high-
g
rade s
q
uamous intrae
p
ithelial lesions: 73.9%.
Arora, 2021
Accuracy:
Polynomial SVM order 4: 95%, Gaussian RBF
SVM: 85%, and Quadratic SVM -85%.
Tripathi, 2021
Accuracy:
ResNet50: 93.87%, ResNet-152: 94.89%, VGG-16:
92.85%, and VGG-19: 94.38%.
Rahaman, 2021
Accuracy:
2-class problem: 98:32% and 7-class problem:
90:32%.
Mehmood,
2021
Number of instances for: Training: 70%, Validation:
15, and Test: 15. Accurac
y
= 93.6%
This proposal
Validation algorithms: 5-Fold Cross-Validation and
Hold Out (80-20) Accuracy:
1-NN: 5-FCV = 100%, HO = 97%; MLP: 5-FCV =
100%, HO = 98%
ACKNOWLEDGEMENTS
The authors would like to thank the Instituto
Politécnico Nacional (COFAA, EDI, and SIP), the
CONACyT, and SNI for their support to develop this
work
REFERENCES
Ariza-Lopez, F., Rodríguez-Avi, J., Alba-Fernández, V.,
2018. Control Estricto de Matrices de Confusión por
Medio de Distribuciones Multinomiales. GeoFocus.
Revista Internacional de Ciencia y Tecnología de la
Información Geográfica. N. 21, p. 215-226.
Arora, A., Tripathi, A., Bhan, A., 2021. Classification of
Cervical Cancer Detection using Machine Learning
Algorithms. 2021 6th International Conference on
Inventive Computation Technologies (ICICT)
Bateman, B., Jha, R., Johnston, B., Mathur, I., 2020. The
The Supervised Learning Workshop: A New,
Interactive Approach to Understanding Supervised
Learning Algorithms. Packt Publishing Ltd.
Cohen, P., Jhingran, A., Oaknin, A., Denny, L., 2019.
Cervical Cancer. Lancet, 393: 169–82.
Gobierno de México, Secretaría de Salud, Estadísticas de
Cáncer de Mama y Cáncer Cérvico Uterino, 2015.
https://www.gob.mx/salud/acciones-y-
programas/informacion-
estadistica#:~:text=En%20M%C3%A9xico%20tambi
%C3%A9n%20a%20partir,35.4%20casos%20por%20
100%2C000%20mujeres.
Hossin, M., and Sulaiman, M., 2015. A Review on
Evaluation Metrics for Data Classification Evaluations.
International Journal of Data Mining & Knowledge
Management Process (IJDKP), Vol.5 (2).
INSTITUTO NACIONAL DE LAS MUJERES, SISTEMA
DE INDICADORES DE GÉNERO, CÁNCER DE
MAMA Y CERVICO-UTERINO, 2021,
http://estadistica.inmujeres.gob.mx/formas/tarjetas/ca
ma_cacu.pdf
Kumar, R., Indrayan, A., 2011. Receiver Operating
Characteristic (ROC) Curve for Medical Researchers.
Indian Pediatrics, Vol. 48.
Link 1 https://www.who.int/es/news-room/fact-
sheets/detail/cervical-cancer
Link 2
https://archive.ics.uci.edu/ml/datasets/Cervical+cancer
+%28Risk+Factors%29
Mehmood, M., Rizwan, M., Gregus, M., Abbas, S., 2021.
Machine Learning Assisted Cervical Cancer Detection.
Frontiers in Public Health.
Rahaman, M., Li, C., Yao, Y., Kulwa, F., Wu, X., Li, X.,
Wang, Q., 2021. DeepCervix: A Deep Learning-based
Framework for the Classification of Cervical Cells
Using Hybrid Deep Feature Fusion Techniques.
Computers in Biology and Medicine, Vol. 136.
Rehman, A., Ali. N., Taj, I., Sajid, M., Karimov, K., 2020.
An Automatic Mass Screening System for Cervical
Cancer Detection Based on Convolutional Neural
Network. Mathematical Problems in Engineering, Vol.
2020.
Shai, S., and Shai, B., 2014. Understanding Machine
Learning: From Theory to Algorithms. Cambridge
University Press.
Tan, X., Li, K., Zhang, J., Wang, W., Wu, B., Wu, J., Li,
X., Huang, X., 2021. Automatic model for cervical
cancer screening based on convolutional neural
network: a retrospective, multicohort, multicenter
study. Cancer Cell Int, 21(1):35.
Tripathi, A., Arora, A., Bhan, A., 2021. Classification of
cervical cancer using Deep Learning Algorithm. 2021
5th International Conference on Intelligent Computing
and Control Systems (ICICCS)
Yang, S., Berdine, G., 2017. The receiver operating
characteristic (ROC) curve. The Southwest Respiratory
and Critical Care Chronicles, Vol 5(19).
Learning Algorithms for Cervical Cancer Detection
787
