Analysis of Net Profits of Chinese Fintech-Listed Enterprises
Based on Multiple Linear Regression Model
Wenli Gao
School of Finance Hebei University of Economics and Business, 47 Xuefu Road, Shijiazhuang, Hebei, China
Keywords: Financial Technology, Listed Chinese Enterprises, Net Profit, Operating Income, Earnings Per Share.
Abstract: Internet finance and modern technology are in a state of deep integration, and fintech(financial technology)
is gradually being applied to financial fintech products, especially in listed companies in China. The paper
examines the factors influencing the net profitability of Chinese listed fintech enterprises and utilizes
multiple regression models to analyze the impact of various fintech products among Chinese listed
companies in recent years. In contrast, the research focuses on the interrelationship between fintech and
listed Chinese companies. It also considers the size of listed banks on the development of fintech, filling the
gap in the issue of fintech and the net profit of listed Chinese enterprises with multiple linear regressions.
1 INTRODUCTION
The rapid informatization and digitization of the
Chinese economy have been accompanied by a
gradual transformation of the traditional financial
model into digital fintech, as evidenced by the use of
high technology such as big data and artificial
intelligence to drive the development of financial
markets (Ashta, 2021; Herrmann, H, 2021). After
the establishment of the Beijing Stock Exchange, the
number of listed companies in China will continue
to grow, especially as a large number of fintech
companies with lower operating costs are joining the
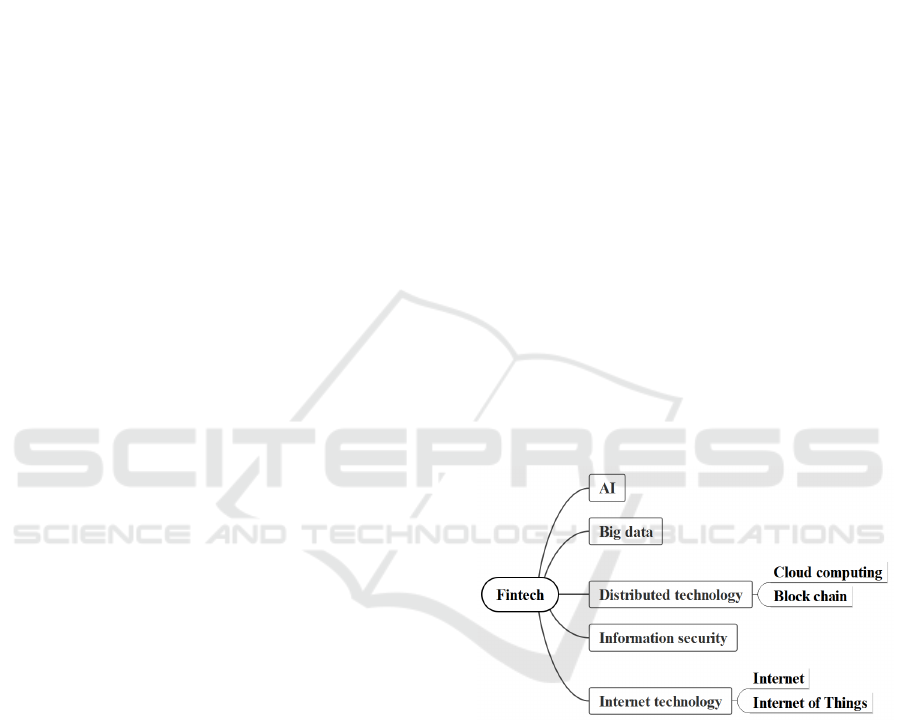
listings. Fintech uses big data to provide financial
identity information, transaction records and credit
history functions to financial institutions and e-
commerce platforms, further helping Chinese listed
companies to improve their product formats and
revenue channels. Meanwhile artificial intelligence
and internet technology can enable data transactions
and provide services such as wealth management,
securities and insurance. Finally, information
security can ensure the safety of fintech products,
further enhancing the security of financial products
available to Chinese listed companies (Figure 1). At
present, some of the Chinese listed companies are
service-oriented or traditional finance companies,
where fintech technology is in its infancy, while
others are companies that are already using fintech
products (Nelaturu, 2022; Du, 2022; Le, 2022). Both
groups of Chinese listed companies are growing
steadily under the influence of fintech, especially in
terms of net profit, operating income and earnings
per share.
Figure 1: Key technologies of fintech.
The rapid informatization and digitization of the
Chinese economy have been accompanied by a
gradual transformation of the traditional financial
model into digital fintech, as evidenced by the use of
high technology such as big data and artificial
intelligence (AI) to drive the development of
financial markets (Ashta, 2021; Herrmann, H, 2021).
After the establishment of the Beijing Stock
Exchange, the number of listed companies in China
will continue to grow, especially as a large number
of fintech companies with lower operating costs are
joining the listings. We can see the investment in
fintech in China (Figure 1). At present, some of the
Gao, W.
Analysis of Net Profits of Chinese Fintech-Listed Enterprises Based on Multiple Linear Regression Model.
DOI: 10.5220/0012034600003620
In Proceedings of the 4th International Conference on Economic Management and Model Engineering (ICEMME 2022), pages 451-456
ISBN: 978-989-758-636-1
Copyright
c
2023 by SCITEPRESS – Science and Technology Publications, Lda. Under CC license (CC BY-NC-ND 4.0)
451

Chinese listed companies are service-oriented or
traditional finance companies, where fintech
technology is in its infancy, while others are
companies that are already using fintech products
(Nelaturu, 2022; Du, 2022; Le, 2022). Both groups
of Chinese listed companies are growing steadily
under the influence of fintech, especially in terms of
net profit, operating income and earnings per share.
2 LITERATURE REVIEW
Both Chinese listed companies and fintech are
developing, and while fintech has enriched the
profitability of Chinese listed companies, they also
pose significant challenges. Pietronudo, M.C. et al.
(2022) have shown that the convergence of Chinese
listed companies and fintech requires technical
expertise and strategic placement. The development
of artificial intelligence and big data signifies that
fintech can already be transferred from the offline
market to the internet and even the mobile market
(Stoica, E.A. et al. 2022). The development of
fintech in Chinese listed companies has a constant
impact on corporate value, including influencing
factors such as net profit, operating income and
earnings per share. Zhao, J., et al, (2022) argues that
Chinese listed companies need to comply with
government regulation of fintech, while also
preventing the risk of financial spillovers. Fintechs
also need a spirit of innovation to add more types of
products to the microeconomy, and scholars have
invested in areas related to the profitability,
operating income and stock returns of fintech,
mainly from investors (Carbó-Valverde et al, 2022).
The innovation of fintech can help Chinese listed
companies increase their revenue and improve their
long-term growth. The literature review on fintech
and Chinese listed companies is as follows (Table
1).
In addition, there are a variety of approaches to
studying listed firms. Luo S, et al, (2022) utilize
keywords and literature research methods to analyze
how fintech affects business innovation. Keywords
from the last five years were studied at the time of
the research. Deep learning and computer algorithms
are also the main methods used in the study of
fintech innovation and Chinese companies (Wang, et
al. 2022).
Table 1: Literature on Fintech and Chinese listed
companies.
Fintech Essentials Author/Researcher
Technical expertise,
Big Data,
Intelligent,
M.C. et al, (2022),
Stoica, E.A. et al, (2022),
Zhao, J., et al, (2022),
Carbó-Valverde et al,
(
2022
)
,
Algorithms,
Quantitative,
Listed enterprises
Wang, et al. (2022),
Barrot, et al. (2022).
Besides qualitative analysis, quantitative analysis
has also been involved in financial technology
research before. (Barrot, et al. 2022). This study
makes use of multiple linear regression to
investigate the impact of listed firms and fintech, it
is the research of listed firms and fintech in the
Chinese context. The study aims to answer the
following questions: (1) How do net profit,
operating income and earnings per share of listed
fintech companies in China affect each other? (2)
How do multiple linear regressions analyze the
impact of fintech on Chinese listed companies?
3 METHODOLOGY
The quantitative analysis method of multiple linear
regression was used in this study. The data in the
study was obtained from the financial statements of
listed companies and the information of data was
reliable and feasible. In building the model with
multiple linear reviews care was taken to separate
the relationship between the independent variables
and the response variables, and the regression
relationship was established by finding the
maximum factor of the regression through stepwise
regression. The linear relationship model is
established in the regression equation (Formulate 1)
and the regression variables are tested for variance
and significance. The basic idea of using multiple
regression linear prediction is to complete the model
after establishing the relationship between the
independent and the response variables, see Figure 2
for the specific steps.
The first step of data collection. The research
data for this study was obtained from the financial
statements of the banking segment of listed
companies in the Chinese A-share market as
disclosed on the Oriental Fortune website. Listed
companies in China are supervised by the Securities
Regulatory Commission, in which the listed
companies' financial statements are audited every
ICEMME 2022 - The International Conference on Economic Management and Model Engineering
452

quarter. Hence, the publicly available financial
statements are authentic and reliable and they can be
used for the study. The 10 listed banks were
modelled using linear regression to determine the
interdependence of the 10 variables, where A is the
intercept, the number of units that affect the change
in Z for each unit change in X
n
.
Z=y
1
X
1
+y
2
X
2
+y
3
X
3
+...+y
10
X
10
+A (1)
Data collection
Data collation
Construct a regression mode
Conclusion
Correlation test
Figure 2: Literature review process.
The second step is to collate the data. The
number of companies in the banking segment of
China's A-share listed companies is 42. Listed banks
with net profits of 150 billion yuan or more are
selected and the number of extracts is calculated as
10 by applying the formula (Formulate 2). The
findings of the research are within the 95%
confidence range, the statistic of Z is 1.96, the
estimated value is at is 0.5, and the value of N is
calculated to be 10.3 within a reasonable margin of
error, so the sample of listed banks is 10. Using
EXCEL, the independent variable (net profit from
2017-2021) and the response variable (operating
income in 2021 and stock return in 2021).
n=P(1-P)/(e
2
/L
2
+ P(1-P)/N (2)
Notes: percentage precision value (E), confidence level
(L), proportional estimate (P), overall sample size of N
The third step is to construct a regression model.
Using EXCEL and multiple regression linear model
to analyze, set the regression equation and determine
the regression coefficient to complete the modelling
of regression analysis.
Step four is correlation test. The review process
is as follows, it needs to be tested with a t-test, from
the results of the regression analysis can be seen,
and the size of the t-test corresponds to the
parameters of the variable p. p<0.05 means that
there is a significant difference, and p>0.05 means
that there is no significance between the variables.
The study hypothesises that the variables are not
random variables and are independent of each other
concerning the random variable errors. The
independent and response variables are not affected
by special circumstances and are able to maintain a
linear relationship.
4 ANAYLYSIS AND RESULTS
The paper focuses on the analysis of the impact of
FinTech on Chinese listed companies, mainly on 10
companies in the banking segment of Chinese listed
companies. This study collates the net profits of
these 10 listed companies in the banking sector for
the five years from 2017 to 2021 in an EXCEL table
and also summarizes the operating income and stock
returns for 2021 in a separate table (Table 2).
Multiple regression linear analysis relates the
purpose of the study to multiple factors by the
optimal combination of multiple independent
variables together to predict the dependent variable.
Table 2: Net profit of FinTech listed companies.
(Unit: 100 million yuan)
No. Name 2017 2018 2019 2020 2021
1 PSBC 477 523 609 642 762
2 CITIC 426 445 480 489 557
3 CCB 702 736 772 783 876
Analysis of Net Profits of Chinese Fintech-Listed Enterprises Based on Multiple Linear Regression Model
453

4 PAB 232 248 281 289 363
5 SPDB 543 559 589 583 530
6 CMB 702 805 928 973 1199
7 BOC 1724 1800 1874 1928 2166
8 ICBC 2860 29877 3122 3159 3483
9 BCM 702 736 772 783 876
10 ABC 1930 2027 2120 2159 2412
Notes: Postal Savings Bank of China(PSBC),
China International Trust and Investment Corporation(ITIC), China Constuction Bank(CCB), PingAn Bank (PAB),
Shanghai Pudong China(BOC), China Merchants Bank(CMB), Development Bank(SPDB), Industrial and Commercial
Bank of China(ICBC), Bank of Communications(BCM),
Agricultural Bank of China(ABC).
The data was collated using EXCEL based on the
data collected. The study identified the net profit
from 2017-2021 as the independent variable for the
study, while the 2021 operating income and 2021
stock earnings were used as the dependent variables
for the study, and regressions were calculated based
on the formula. The regression analysis was also
conducted using the EXCEL software and the
regression analysis function in the SPSS software.
Table 3: Regression Statistics in operating income.
Multiple R 0.980241553
R Square 0.960873503
Adjusted R Square 0.911965382
Standard Error 843.7893199
Observations 10
Table 4: Regression Statistics in share price per.
Multiple R 0.833072649
R Square 0.694010039
Adjusted R Square 0.311522588
Standard Error 0.972882514
Observations 10
The regression statistical table can be completed
after regression analysis, Multiple R is the
correlation of performance multiple regression data,
and Multiple R is greater than 75% showing a strong
correlation trend, the Multiple R between the net
profit of this study from 2017-2021 and the
operating income in 2021 is 98% (Table 3), the two
factors of net profit and operating income show a
strong correlation The Multiple R between net profit
in 2017-2021 and share price per in 2021 is 83.31%
(Table 4), and the two factors of net profit and share
price per share also show a strong correlation.
Therefore, Chinese fintech has a positive correlation,
i.e. a mutually reinforcing effect, on net profit,
operating and share price revenue per share of
Chinese listed companies.
In the regression analysis, this research can be
derived from the ANOVA table (Table 5 and Table
6), from which it can be seen that the range of
fluctuations between the variables in this study is not
large and shows a trend of stable effects. The
ANOVA table corresponds to a Significance F of
0.02, which is less than 0.05. A Significance F of
less than 0.05 indicates that the overall regression
model is significant. Looking at the regression
coefficient table below again, the Coefficients
coefficient is available in the error analysis table,
which is the intercept in formulate (1) in part 3 in
Table 7 and Table 8.
Table 5: ANOVA in operating income.
df SS MS F Sig F
Regression 5 700 139 19.6 0.006
Residual 4 284 7
Total 9 728
Table 6: ANOVA in share price per.
df SS MS F Sig F
Regression 5 8.59 1.72 1.81 0.29
Residual 4 3.79 0.95
Total 9 12.37
Table 7: Coefficients in operating income.
Intercept 799.8865083
2017 16.56962463
ICEMME 2022 - The International Conference on Economic Management and Model Engineering
454

2018 0.023275674
2019 -25.46317054
2020 -0.62295762
2021 12.05858768
Table 8: Coefficients in share price per.
Intercept 0.768134965
2017 -0.02548449
2018 -2.6159E-05
2019 0.057321944
2020 -0.03389629
2021 0.000565444
The error in the multiple linear regression model
is defined by
() ()
11
1
2
+−
=
+−
−
=
=
∧
∧
mn
VV
mn
yy
T
n
i
ii
σ
(3)
The number of observations is, the number of
parameters is, and the number of redundant
observations is, so the denominator of the above
equation is.
Finally, the study needs to test the significance of
the above results, this study uses a t-test to test the
net profit variable, operating income and earnings
per share for the 5 years from 2017 to 2021
respectively, t-test p-value is calculated as 0.03. If P
< 0.01, then the two groups are highly significantly
different; if 0.01 < P < 0.05, then the two groups are
significantly different; if P > 0.05, then the two
groups are not significantly different. Therefore, the
net profit variable, operating income and earnings
per share tests of listed companies in Chinese fintech
are correlated. The normal split between operating
income and earnings per share for 2021 is shown in
Figure 3 and Figure 4.
Figure 3: Normal Probability Plot in operating income.
Figure 4: Normal Probability Plot in share price per.
5 CONCLUSIONS
The paper analyzes the banking sector among the
listed companies in China's fintech and the following
conclusions are obtained. net profit variables for the
five years from 2017 to 2021, operating income and
earnings per share are positively correlated. This
means that as operating income grows, so do the net
profit and earnings per share of the companies. The
comparison suggests that the cost of the banking
segment of Chinese listed companies is also
manageable through the products of fintech.
Chinese fintech companies should focus more on
fintech innovation on their development path. In an
era of constantly updated financial products Chinese
fintech listed companies need to be more innovative
in technology and ideas. Secondly, in terms of
fintech technology and management, Chinese listed
companies need to see a broader perspective and
attract more professionals and components of a good
fintech team.
ACKNOWLEDGEMENTS
Thanks to Hebei University of Economics and
Business for providing a platform for research.
REFERENCES
Ashta, A. & Herrmann, H., (2021). Artificial intelligence
and fintech: An overview of opportunities and risks
for banking, investments, and microfinance. Strategic
Change, 30(3), pp.211-222.
Baloch, M.A., Ozturk, I., Bekun, F.V. and Khan, D.,
(2021). Modeling the dynamic linkage between
financial development, energy innovation, and
environmental quality: does globalization matter?.
Business Strategy and the Environment, 30(1), pp.176-
184.
Barrot, Jessie S., Ian I. Llenares, and Leo S. Del Rosario.
Students’ online learning challenges during the
Analysis of Net Profits of Chinese Fintech-Listed Enterprises Based on Multiple Linear Regression Model
455

pandemic and how they cope with them: The case of
the Philippines. Education and Information
Technologies 26, no. 6 (2021): 7321-7338.
Bhat JR, AlQahtani SA, Nekovee M., (2022). FinTech
enablers, use cases, and role of future internet of
things. Journal of King Saud University-Computer and
Information Sciences. Sep 5.
Carbó-Valverde, Santiago, Pedro J. Cuadros-Solas, and
Francisco Rodríguez-Fernández., (2022).
Entrepreneurial, institutional and financial strategies
for FinTech profitability. Financial Innovation 8, p.1-
36.
Emanuel EJ, Osterholm M, Gounder CR., (2022). A
national strategy for the “new normal” of life with
covid. Jama. 18;327(3):211-2.
Luo S, Sun Y, Yang F, Zhou G., (2022). Does fintech
innovation promote enterprise transformation?
Evidence from China. Technology in Society. 1;
68:101821.
Nelaturu, K., Du, H. & Le, D.P., (2022). A Review of
Blockchain in Fintech: Taxonomy, Challenges, and
Future Directions. Cryptography, 6(2), p.18.
Pietronudo, M.C., Del Gaudio, B.L. and Leone, D.,
(2021). Coopetition strategy and industry
convergence. Evidence in the Chinese banking market.
Technology Analysis & Strategic Management, pp.1-
14.
Stoica, E.A. and Sitea, D.M., 2021. Blockchain Disrupting
Fintech and the Banking System. Multidisciplinary
Digital Publishing Institute Proceedings, 74(1), p.24.
Wang, H., Chen, X., Du, J. and Lai, K.K., (2022).
Classification of FinTech Patents by Machine
Learning and Deep Learning Reveals Trends of
FinTech Development in China. Mathematical
Problems in Engineering, 2022.
Xu D, Taylor CJ, Ren Y., (2022). Wait-and-See or
Whack-a-Mole: What Is the Best Way to Regulate
Fintech in China?. Asian Journal of Law and Society.
:1-30.
Zhao, J., Li, X., Yu, C.H., Chen, S. and Lee, C.C., 2022.
Riding the FinTech innovation wave: FinTech, patents
and bank performance. Journal of International Money
and Finance, 122, p.102552.
ICEMME 2022 - The International Conference on Economic Management and Model Engineering
456
