
Optimal Investment Strategies for Gold Bitcoin Portfolio Based on
the LSTM and AHP Models
Zihao Zhu, Bozhong Zheng and Ruoxi Li
*
University of Shanghai for Science and Technology, Shanghai, China
Keywords: Gold, Bitcoin, AHP, LSTM, Transaction Costs.
Abstract: Bitcoin is the most innovative digital cryptocurrency, but its price is highly volatile and cannot maintain price
stability in the event of market shocks. It is regarded as a long-term safe haven from the natural value of gold.
Therefore, this research selects gold and bitcoin as a portfolio investment product to explore the optimal
portfolio investment problem with given investment period, initial assets and transaction costs. This research
uses the hierarchical analysis process (AHP) model to solve for the optimal investment ratio. After obtaining
the investment ratio, a gold bitcoin investment decision model is established to determine the daily trading
operation. And using the simulated ups and downs analysis, it is concluded that the investment proportion
solved by AHP model has better investment efficiency. Later, the long-short-term memory (LSTM) model is
constructed to predict the rise and fall , and the annualized interest rate is 158.85%. Finally, the sensitivity
analysis of the transaction cost to the model is also carried out, and the results show that the investment ratio
derived from the AHP method has some value in practical applications. The research in this paper provides
some guidence for the optimal investment strategies for gold bitcoin portfolio.
1 INTRODUCTION
In recent years, in the context of economic
globalization and financial crisis, experts and scholars
not only focus on stock market research, but also
gradually pay attention to the research of gold futures
prices, bitcoin and other digital currencies (Atamian,
2022). For a long time in the past, gold has been
regarded as a natural currency and a safe-haven store
due to its stable properties over a long period of time
(Dongfang Y, 2021). Using a classical Markov
transition model, gold prices continue to increase
once they have risen (Qilian Z, 2011). With the
popularity of digital currencies, a cashless society is
expected to be nurtured (Kabaklarlı E, 2022),
eventually replacing paper money and coins. From
this perspective, cryptocurrencies can be seen as
environmentally friendly (Sagheer, 2022). Bitcoin
has been one of the most innovative digital
cryptocurrencies since its inception (Zheshi C, 2021),
and its price has often risen and fallen dramatically,
providing investors with high returns but also
possessing significant risks.
Using a T-GARCH model, it was found that
bitcoin has similarities to gold and can be a hedge
against stock market risk in times of stock turbulence
(Anne Haubo Dyhrberg, 2016). In addition, the
varying-coefficient quantile approach was applied
and it was found bitcoin to be a safe haven (Ren,
2022) and good speculative asset (Baek, 2015).
However, several researches indicate that bitcoin is a
risky investment with limited hedging ability. For
example, Bouri built the DCC dynamic conditional
model and found that it is less suitable as a hedging
instrument but can be used for diversification (Elie,
2017). Nonetheless, investment strategies in gold,
stocks, oil and bitcoin can be implemented to reduce
investment risk to a large extent (Khaled, 2019). In
order to investigate the relationship between the
prices of the gold and bitcoin, Yechen explored the
impact of dollar index, gold price on bitcoin price and
found that the correlation between the prices of the
gold and bitcoin is relative weak (Yechen Z, 2017).
Besides, the newly proposed Wavelet Quantile
Correlation (WQC) implemented by Kumar AS et al.
concluded that gold has a safe hedge in all markets,
while bitcoin has mixed results (Kumar, 2022). By
applying the (vine) copula, it was found that gold
substantially reduces the downside risk of a portfolio
containing gold and energy commodity allocations, in
contrast to the inconsistent hedge function of bitcoin
(Syuhada, 2022). The DCC-FIGARCH model was
328
Zhu, Z., Zheng, B. and Li, R.
Optimal Investment Strategies for Gold Bitcoin Portfolio Based on the LSTM and AHP Models.
DOI: 10.5220/0012030300003620
In Proceedings of the 4th International Conference on Economic Management and Model Engineering (ICEMME 2022), pages 328-337
ISBN: 978-989-758-636-1
Copyright
c
2023 by SCITEPRESS – Science and Technology Publications, Lda. Under CC license (CC BY-NC-ND 4.0)

constructed to show that bitcoin qualifies as a hedge
against Islamic stock market declines (Chkili, 2021).
Furthermore, Chemkha et al. show the effectiveness
of bitcoin and gold as hedging assets in reducing
international portfolio risk based on a multivariate
asymmetric dynamic conditional correlation model
(Chemkha, 2021).
Due to the diverse nature of investment products,
the portfolio investment model was conceived as a
way for rational investors to allocate their funds to
several different assets to obtain more return than a
single investment while taking as little risk as
possible (Xue, 2022). In addition, Ma Y et al. show
that diversification increases returns, reduces
portfolio volatility across all portfolios, and
diversification also provides higher returns (Ma,
2020). In order to make the investment strategies, the
multi-factor stock selection model with better
accuracy and stability can be developed an entropy-
weighted method combined with Technique for Order
Preference by Similarity to an Ideal Solution
(TOPSIS) model for comprehensive evaluation of
each stock (Yeong Z, 2021). Moreover, the portfolio
investment model based on Long Short-Term
Memory (LSTM) neural network can also be built to
construct different portfolios for different risk
aversion coefficients (Yue, 2021). The combined
machine learning methods and portfolio models can
also be implemented to build stock portfolios by
using support vector machine (SVM) model and
LSTM model to predict stock ups and downs (Jun,
2019). Besides, Fang et al. uses conditional value-at-
risk (CVaR) model to measure risk while considering
investment transaction costs (Chengde F, 2015).
Furthermore, Wang et al. constructed a mean-
variance-down-run variance portfolio model with
transaction costs, introduced risk aversion
coefficients, and solved the model using a teach-and-
learn algorithm to obtain optimal portfolios with
different returns (Xiaoqin W, 2020). Later, they also
considered the case of multi-stage portfolios and built
a mean-VaR multi-stage portfolio optimization
model to obtain the optimal investment strategies for
each stage under different paths (Xiaoqin W, 2020).
Zhu et al. applied particle swarm optimization (PSO)
method combined with the metaheuristic approach on
solving the intractability of portfolios (Zhu, 2011).
Also, Butler et al. pointed out that PSO approach can
offer better results (Butler, 2010). Consequently, it is
possible to predict the future price or rise and fall of
investment products, determine their fluctuation
status, and select the combination. It is particularly
important to carry out portfolio investment with
appropriate investment products, which can enable
investors to obtain greater returns on the basis of
taking smaller risks.
In this research, we choose gold and bitcoin as
portfolio investment products. We build the EEMD-
PCA-LSTM model to predict the price, and construct
analytic hierarchy process (AHP) model to solve the
portfolio investment ratio and get the daily
recommended investment weight ratio of gold and
bitcoin. Finally, it is solved by the gold bitcoin
investment decision model.
2 THEORY AND METHODS
2.1 Data Collection and Pre-processing
The data samples in this research include the daily
prices of gold and bitcoin from 2016 to 2021, mainly
from the London gold market and NASDAQ.(
Mathematical modeling competition for American
College Students) On this basis, the date with
incomplete data is eliminated and the date with
abnormal data is handled. We selected five indicators:
daily yield 𝑅
, daily average yield 𝐸(𝑅
), volatility
𝜎
(standard deviation of 𝑅
), the maximum
retracement rate MaxDawndown, and the longest
consecutive rising days MaxDay.
We build the Ensemble Empirical Mode
Decomposition (EEMD) (Dongfang Y, 2021) model
to decompose signals (Xiwen S, 2022). In order to
increase the number of features and improve the
efficiency of training neural networks. We input the
original data into EEMD model and decompose nine
signals. The results are shown in the Fig.S1 of the
supporting information (SI).
Then, the Principal Component Analysis (PCA)
(Chen, 2022) is used to analyze on the nine signals
output by EEMD model, calculate their eigenvectors
and eigenvalues, respectively (Xu, 2022), and sort
them from large to small. The results are shown in the
Fig.S2 of the supporting information (SI). The
eigenvalues of the last four principal components are
too small, so they are discarded as noise. Only the first
five features are retained and used as input variables
for subsequent prediction models.
2.2 Long Short-Term Memory (LSTM)
Model
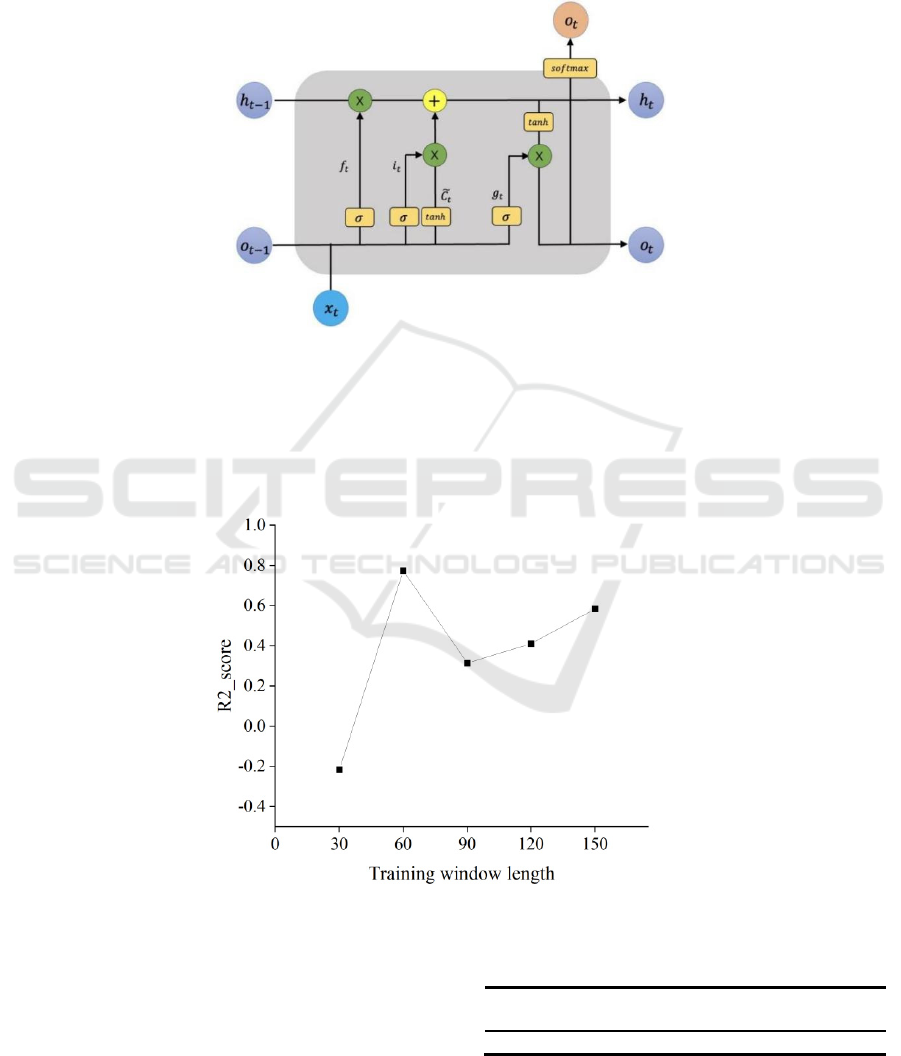
The Long Short-Term Memory (LSTM) model is an
improved version of Recurrent Neural Network
(RNN). The structure of LSTM model is
demonstrated in the Fig.1. The “Gate” structure of
Optimal Investment Strategies for Gold Bitcoin Portfolio Based on the LSTM and AHP Models
329
LSTM model is used to alleviate the gradient
disappearance and gradient explosion of RNN (Sako,
2022). This "Gate" structure makes the gradient not
disappear completely no matter how long the time
series propagates. The hidden state of the LSTM
model is called cells. These cells are repetitive
structures. Each cell receives the cell state of the
previous step and the current input, and determines
which information to retain and which to forget (Li,
2022). This can effectively preserve long-term
information.
Figure 1: Single cell structure of LSTM model.
In each day's investment, we need to choose the
length of the training set. We take the bitcoin market
price from May 1st to May 20th, 2019 as the test set,
and set the length of the training set as
[30,60,90,120,150]. The R
2
on test set is shown in the
Fig.2. It is concluded that the best training window
length is 60 days.
Figure 2: R2_Score on test set predicted by LSTM model on training sets of different lengths.
In this research, the LSTM model is built by using
the Keras framework in Python 3.8 Environment.
After training and parameter adjustment, the hyper
parameters of the model are finally determined as
shown in Table I.
Table1: The final hyper parameters of the LSTM model.
Epochs Batch
size
Verbose Loss optimizer
200 1 1 MAE Adam
ICEMME 2022 - The International Conference on Economic Management and Model Engineering
330

2.3 Modern Portfolio Theory (MPT)
Modern portfolio theory (MPT), or mean-variance
analysis, is a mathematical framemwork for
assembling a portoflio of assets such that the expected
return is maximized for a given level of risk. (Zola,
2021). It measures Portfolio Utility from the
perspective of investment risk and return, and puts
forward a quantitative method to measure financial
risk for the first time. The establishment of mean-
variance analysis is based on the following three
assumptions: investors are risk averse; each asset has
risks; the distribution of return on assets is normal.
Mean-Variance analysis is the process of weighting
risk, expressed as variance, against expected return.
Investors use mean-variance analysis to make
decisions about which financial instruments to invest
in, based on how much risk they are willing to take
on in exchange for different levels of reward. (Zhang,
2022). The covariance between gold and bitcoin
yields 𝜎
can be calculated as:
𝜎
=
∑
(
(:)
)(
(:)
)
(1)
where 𝑟
(:)
and 𝑟
(:)
are the yield of gold and bitcoin
on that day in the time period T, respectively. T
indicates the statistical period, which is set to 30 in
this research. 𝑟
and 𝑟
denote the average yield of
gold and bitcoin, respectively. 𝑛 is the number of
observations of the sample.
The standard deviation of the portfolio 𝑆𝑇𝐷 is
calculated to represent the overall risk and the
weighted return rate 𝑟
is calculated to represent the
overall portfolio return efficiency.
𝑟
=𝑤
𝑟
+𝑤
𝑟
(2)
𝜎
=𝜔
𝜎
+𝜔
𝜎
+2𝜔
𝜔
𝜎
(3)
𝑆𝑇𝐷 =
𝜎
(4)
where 𝑟
is the weighted yield of portfolio; 𝜎
denotes ortfolio risk; 𝜎
,𝜎
are standard deviation of
gold and bitcoin yields, respectively ; 𝜔
, 𝜔
are the
percentages of gold and bitcoin in the portfolio,
respectively.
2.4 Analytic Hierarchy Process (AHP)
Model
Analytic hierarchy process, or AHP for short, is a
multi-objective decision analysis methodology
proposed by Satty in the 1970s (Huo, 2021). Its
principle is to decompose the factors related to
decision-making into several levels, such as target
level, criterion level and scheme level. Through the
calculation and comparison of each factor, the
weights of different factors are obtained, which
provides a reference basis for decision-makers to
select the optimal scheme (Yadav P, 2022). The
specific operation steps are as follows:
Step 1: Establish a hierarchical structure.
According to the analysis of the problem, the
decision-making problem is divided into three levels
(Himanshu, 2021). The top level is the target layer M
which selects the most appropriate investment weight
for the balance of income and risk. The lowest layer
is the scheme layer, including gold and bitcoin. The
middle layer is the standard layer, including average
daily yield, volatility, commission, maxdawndown
and maxday.
Figure 3: Analytic hierarchy process three-tier structure model diagram.
.
Step 2: Solve the hierarchical structure.
Firstly, the judgment matrix is constructed
according to the investment principles to determine
the weight distribution value of each criterion as
shown in Table II. By comparing the values of the five
criteria of gold and bitcoin, the judgment matrix is set
to determine how much weight should be allocated to
gold and bitcoin every day under each criterion.
Optimal Investment Strategies for Gold Bitcoin Portfolio Based on the LSTM and AHP Models
331

Table 2: Guideline Layer Judgment Matrix.
Volatility
MaxDawndo
wn
Average daily
yield
Commissi
on
MaxDay
MaxDawndo
wn
1 2 1/5 2 1
Average daily
yield
1/2 1 1/7 1 1/2
Average daily
yield
5 7 1 7 5
Average daily
yield
1/2 1 1/7 1 1/2
MaxDay 1 2 1/5 2 1
Step 3: The eigenvector of the previously
obtained eigenmatrix is obtained by the eigenvalue
method, and then normalized to obtain the weight
matrix as shown in Table III. (The data on December
10th, 2016 is taken as an example).
Table 3: Weight Matrix of Gold and Bitcoin under Each Criterion.
Volatility
MaxDawndown
Average daily
yield
Commission
MaxDay
Weights of
Criterion
0.134 0.072 0.586 0.072 0.134
Gold
0.855
0.092 0.1 0.869 0.152
Bitcoin
0.144
0.907 0.9 0.130 0.847
Step 4: Calculate the score according to the
weight matrix and determine the weight of gold
bitcoin investment.
𝜔
= 0.134 × 0.855 + 0.072 × 0.092 +
0.586 × 0.1 + 0.072 × 0.869 + 0.134 ×
0.152 = 0.263 (5)
𝜔
= 0.134 × 0.144 + 0.072 × 0.907 +
0.586 × 0.9 + 0.072 × 0.130 + 0.134 ×
0.847 = 0.736 (6)
Then, the proportion of gold bitcoin investment 𝑘
is calculated according to the weight of gold bitcoin
investment.
𝑘=
= 0.358 (7)
Through the above steps of the AHP model, we
obtained the gold bitcoin investment ratio K on
December 10th, 2016. In addition, we use the data of
the same day, set the change range of investment
weight distribution as 0.05 and the change range as 0
~ 1, and then we can get 21 investment ratios plus the
investment ratio K obtained by AHP model. A total
of 22 groups of investment ratios have solved their
weighted yield and standard deviation, respectively,
and drawn the return / risk curve as shown in the
Fig.4.
This curve is called the Markowitz bullet. In the
efficient frontier, there is a position where the
volatility of yield is the smallest, that is, point Q in
the graph. Point P in the figure is the highest income
point, and the investment proportion closer to point Q
represents the lower risk.
ICEMME 2022 - The International Conference on Economic Management and Model Engineering
332
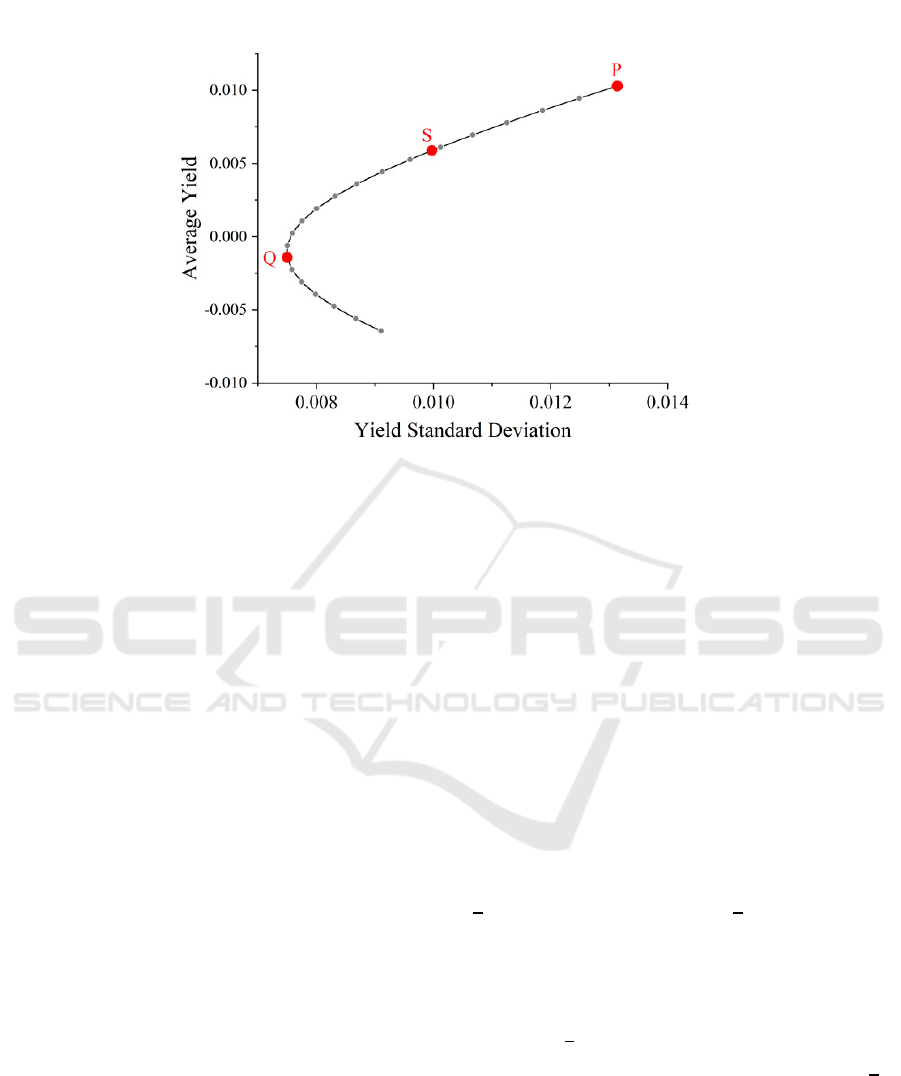
Figure 4: Return / Risk Curve of 22 Investment Proportions.
The investment proportion closer to point P
represents a higher yield, but also bears greater risks.
It can be concluded that the point S obtained by AHP
is just between the lowest risk point Q and the highest
return point P, which is a proportion that balances the
return and risk. Therefore, in the following
investment, we implement AHP model to determine
the daily investment proportion of gold and bitcoin.
2.5 Gold Bitcoin Investment Decision
Model (GBIDM)
1) Optimal Strategies
a) Principle 1: Risk and return are positively
correlated (Tu, 2018).
• Strategy I: For gold and bitcoin, the investment
ratio can converge to the K value or remain as
constant as possible.
b) Principle 2: Gold has value preservation and
safe-haven properties (Yang, 2019); Bitcoin has the
characteristics of high profit and high risk.
• Strategy II: Bitcoin is allowed to be bought or
sold frequently, and then, gold is not, instead.
c) Principle 3: Long-term assets are often
accompanied by value growth.
• Strategy III: Do not sell assets easily unless it
is estimated that the assets sold can produce higher
returns.
• Strategy IV: Hold as little cash as possible.
2) Model Building
𝑓 is a standard used to judge the relationship
between Commission and expected return.
𝑓=𝑇×𝐸(𝑅
)−(1−𝛼
)(1 − 𝛼
) (8)
𝛼
,𝛼
are the commissions for gold and bitcoin,
respectively. The condition that 𝑓 is positive means
that the expected revenue from a trading operation is
greater than the deducted commission. Therefore,
trading operations between gold and bitcoin can be
performed when 𝑓 is positive, and not when 𝑓 is
negative.
The GBIDM model is based on three basic
principles of investment and four basic strategies. For
each trading day, 14 scenarios are classified and the
corresponding decisions are made based on 𝑃
, 𝑃
,
,𝑘 and 𝑓, as shown in Fig. 5.
means the current
holding ratio of gold to bitcoin. Since gold can only
be traded on weekdays, trading decisions are not the
same on weekdays and weekends. Taking for
example, when it is a weekday and 𝑃
is positive, 𝑃
is positive,
is greater than k, and 𝑓 is negative, then
buy gold and bitcoin in a ratio of cash so that
is
closer to k. However, if it is a weekend and 𝑃
is
negative, then no trade operation is carried out. The
other detailed process is shown in the Fig. S3. of
supporting information (SI).
Optimal Investment Strategies for Gold Bitcoin Portfolio Based on the LSTM and AHP Models
333

Figure 5: Decision diagram of GBIDM model.
2.6 Model Connection
With the above-mentioned models and data
processing methods, they are fused and combined
into the GBIDM-AHP-LSTM model, and the
framework of the model is shown in Fig. 6 First, the
LSTM model will predict the value of 𝑃
, 𝑃
by
learning the data of bitcoin and gold for the previous
60 days. The detailed data is shown in Fig. S3 and
Fig. S4 of supporting information (SI). After that,
various quantitative indicators including 𝑅
, 𝐸
(
𝑅
)
,
𝜎
, 𝑀𝑎𝑥𝑑𝑎𝑦, 𝑀𝑎𝑥𝐷𝑎𝑤𝑛𝑑𝑜𝑤𝑛 are calculated. These
indicators are then brought into the AHP model to
find k. Finally, the GBIDM model combines the
results of the above models with its own
characteristics to derive recommended trading
operations.
Figure 6: Framework of GBIDM-AHP-LSTM model.
3 RESULTS AND DISCUSSION
3.1 Case Analysis
To verify the validity of the GBIDM-AHP-LSTM
model we proposed, the price data of gold and bitcoin
from December 6th, 2016, to September 10th, 2021,
were chosen as the back testing target. The data
source for gold is London Bullion Market
Association, and the data source for bitcoin is
NASDAQ, with a total of 1739 data items and the
date and closing price are included in each data item.
𝐶
、
𝐺
、
𝐵
are the holdings of USD, gold, and
bitcoin on the i-th day.𝑣
,𝑣
are the values of gold
and bitcoin on that day, respectively. 𝑎
,𝑎
are the
commissions for gold and bitcoin, respectively. There
is no limit to the number of trades per day and the
commissions are deducted for all trades. The initial
asset 𝐶
is given on the first day, after that no new
money is provided daily, so the daily available assets
are 𝑊
=𝐶
+𝐺
+𝐵
.
Let 𝑎
=0.01,𝑎
=0.02 , the quantitative
investment model is constructed (Liu, 2020) and
back-tested according to the above method. Daily
trading operations are conducted according to the
GBIDM-AHP-LSTM model, and detailed daily
operations are shown in the TABLE SI. of the
supporting information (SI). The return is evaluated
as shown in Table Ⅳ . From Table Ⅳ , we can
conclude that the GBIDM-AHP-LSTM model has a
ICEMME 2022 - The International Conference on Economic Management and Model Engineering
334
high rate of return. The final total return in the case
analysis is 756.80%, the average annual return is
158.85%, the average monthly return is 13.24%, and
the average daily return is 4.41‰. So the model is
helpful for traders' investment decisions.
Table 4: Return on investment using the GBIDM-AHP-
LSTM model.
GBIDM-AHP-LSTM
Model
Total Return (%) 756.80
Average Annual Return (%) 158.85
Average Monthly Return (%) 13.24
Average Daily Return (‰) 4.41
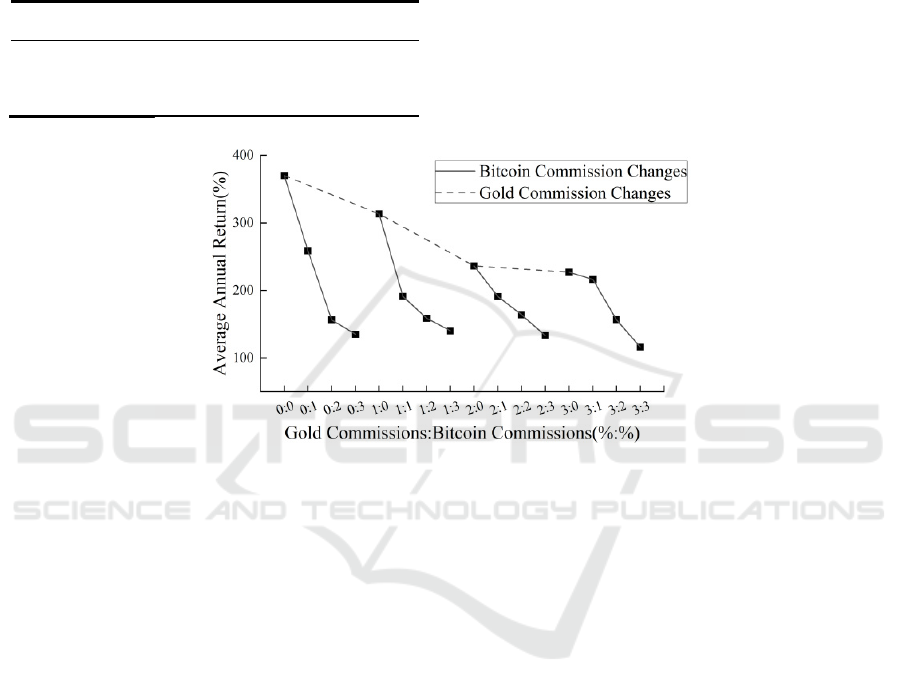
3.2 Sensitivity Analysis
If the operation of transactions is too frequent, too
much money will be spent on commissions. To
further verify the stability and reasonableness of the
GBIDM-AHP-LSTM model we proposed, the
commissions of gold and bitcoin were set from zero
to three percent, and the trend of the average annual
return of the model was observed. The specific results
are shown in Fig. 6.
Figure 7: Change in average annual return when gold commissions and bitcoin commissions change.
As shown in Fig. 6, the average annual return is
maintained above 100% for different combinations of
gold and bitcoin commissions. With 𝑎
being held
constant, the average annual return decreases
significantly as 𝑎
increases (as shown in the solid
line in Fig. 7); with 𝑎
held constant, the average
annual return decreases flatly as 𝑎
increases (as
shown in the dashed line in Fig. 7).
When the overall commission increases, the
commission-limiting mechanism in the GBIDM
model increases the trading threshold and discourages
investment operations when the expected return may
be less than the transaction cost (Sun, 2019). AHP
model can balance risk and return and select the
appropriate portfolio investment ratio, so although the
return decreases as the transaction cost increases, the
decrease is not significant and tends to be flat overall.
Moreover, it can be concluded that can be seen is that
the stability of GBIDM-AHP-LSTM model is
stronger on the changes of 𝑎
than on the changes of
𝑎
.
4 CONCLUSION
In conclusion, we build the LSTM model to predict
the price of gold and bitcoin at first, then various
quantitative indicators are calculated from the
predicted prices. In addition, these quantitative
indicators are brought into the AHP model to solve
for the recommended investment ratio of gold to
bitcoin, and the GBIDM model is constructed to solve
for the daily investment trading operations to bring
the current gold and bitcoin holding ratio close to the
recommended investment ratio. Next, the GBIDM-
AHP-LSTM model is used for investment case
analysis, and the annualized interest rate is 158.85%.
Finally, a sensitivity analysis of commissions is
performed on the GBIDM-AHP-LSTM model, and it
is concluded that bitcoin commission has a certain
impact on the model, but gold commission has a
slight impact on the model. Through the result of this
model, we have formulated a strategy, which can help
investors get greater profits within the range of
acceptable risks.
Optimal Investment Strategies for Gold Bitcoin Portfolio Based on the LSTM and AHP Models
335

ACKNOWLEDGMENT
The authors would like to express our heartfelt thanks
to the professors of Shanghai University of
technology for their enlightening discussion. The
authors would also like to thank our supervisors for
their friendly help and timely guidance, which helped
us to complete the writing of the whole paper.
REFERENCES
Anne Haubo Dyhrberg. (2016) Bitcoin, gold and the dollar
– A GARCH volatility analysis[J]. Finance Research
Letters,16:85-92.
Atamian, E. K., & Bastidas, N. (2022). Cryptocurrency:
The Future of Plastic Surgery Payments?. Aesthetic
surgery journal, sjac131.
Baek,Elbeck. (2015) Bitcoins as an investment or
speculative vehicle? A first look[J]. Applied Economics
Letters, 22(1):30-34.
Chkili, W., Ben Rejeb, A., & Arfaoui, M. (2021). Does
bitcoin provide hedge to Islamic stock markets for pre-
and during COVID-19 outbreak? A comparative
analysis with gold. Resources policy, 74, 102407.
Chemkha, R., BenSaïda, A., Ghorbel, A., & Tayachi, T.
(2021). Hedge and safe haven properties during
COVID-19: Evidence from Bitcoin and gold. The
Quarterly review of economics and finance : journal of
the Midwest Economics Association, 82, 71–85.
Chengde F, Zengxin W, Mengying Z.(2015) Portfolio
model based on the typical transaction cost of
CVaR .Journal of Guangxi University (Nature
Science),40(06):1611-1616.
Chen Feifei Yue, Zhu Yulian, Tian Jia slightly, Jiang
Ke.(2022)Network image recognition algorithm of
smooth principal component analysis for fusion graph
embedding. Journal of the National University of
Defense Technology,2022,44(03):16-22.
Butler M., Kazakov D. (2010) Particle swarm optimization
of bollinger bands. Lecture Notes in Computer Science.
6234:504–511.
Dongfang Y. (2021) Gold futures price forecast based on
the CEEMDAN-PCA-LSTM model. Shandong
University.
Dongfang Y. (2021) Gold futures price forecast based on
the CEEMDAN-PCA-LSTM model. Shandong
University.
Elie Bouri, Peter Molnár,Georges Azzi,David Roubaud,
Lars Ivar Hagfors.(2017) On the hedge and safe haven
properties of Bitcoin: Is it really more than a
diversifier?[J]. Finance Research Letters,20:192-198.
Himanshu, Ritika, Mushir N, Suryavanshi R. (2021)Impact
of COVID-19 on portfolio allocation decisions of
individual investors. J Public Aff. 18:e2649.
Huo Xiaoxiao, Chen Ruzan.(2021) Research on portfolio
construction based on hierarchical analysis-entropy
weight method. Modern computer,27(28):50-54.
Jun R . (2019) Stock quantitative investment model based
on SVM and LSTM network prediction [D]. Wuhan
University of Science and Technology study,.
Kabaklarlı E. (2022). Green FinTech: sustainability of
Bitcoin. Digital finance, 1–9.
Khaled Guesmi, Samir Saadi, Ilyes Abid, Zied Ftiti.(2019)
Portfolio diversification with virtual currency:
Evidence from bitcoin[J]. International Review of
Financial Analysis,63(C):431-437.
Kumar, A. S., & Padakandla, S. R. (2022). Testing the safe-
haven properties of gold and bitcoin in the backdrop of
COVID-19: A wavelet quantile correlation approach.
Finance research letters, 47, 102707.
Li, M., Zhu, Y., Shen, Y., & Angelova, M. (2022).
Clustering-enhanced stock price prediction using deep
learning. World wide web, 1–26. Advance online
publication.
Liu Songting. Optimization and Research of Asset
Investment Strategy Considering Transaction Cost
under the Cumulative Prospect Theory. Hunan Normal
University,2020.
Ma, Y., Ahmad, F., Liu, M., & Wang, Z. (2020). Portfolio
optimization in the era of digital financialization using
cryptocurrencies. Technological forecasting and social
change, 161, 120265.
Qilian Z, Bo H, Sixiong Y. (2011) Study of Markov
Mechanism Conversion Model in Gold Price
fluctuation. Journal of Shanxi University of Finance
and Economics,33(S3):66-67.
Ren, X., Wang, R., Duan, K., & Chen, J. (2022). Dynamics
of the sheltering role of Bitcoin against crude oil market
crash with varying severity of the COVID-19: A
comparison with gold. Research in international
business and finance, 62, 101672.
Sako, K., Mpinda, B. N., & Rodrigues, P. C. (2022). Neural
Networks for Financial Time Series Forecasting.
Entropy (Basel, Switzerland), 24(5), 657.
Sagheer, N., Khan, K. I., Fahd, S., Mahmood, S., Rashid,
T., & Jamil, H. (2022). Factors Affecting Adaptability
of Cryptocurrency: An Application of Technology
Acceptance Model. Frontiers in psychology, 13,
903473.
Syuhada, K., Suprijanto, D., & Hakim, A. (2022).
Comparing gold's and Bitcoin's safe-haven roles against
energy commodities during the COVID-19 outbreak: A
vine copula approach. Finance research letters, 46,
102471.
Sun Jidou. The Correlation of Investment Return Rate and
Transaction Cost in China Stock Market. Finance and
Economics University of Tianjin,2019.
Tu Shenhao. Portfolio Research Based on Deep
Reinforcement Learning and Improving the Mean-
Variance Model. University of Chinese Academy of
Sciences (School of Artificial Intelligence),2018.
Xue, Q., Ling, Y., & Tian, B. (2022). Portfolio
Optimization Model for Gold and Bitcoin Based on
Weighted Unidirectional Dual-Layer LSTM Model and
ICEMME 2022 - The International Conference on Economic Management and Model Engineering
336

SMA-Slope Strategy. Computational intelligence and
neuroscience, 2022, 1869897.
Xiaoqin W, Yuelin G.(2020) Lower half variance portfolio
model with transaction costs.Journal of Engineering
Mathematics,37(02):155-164.
Xiaoqin W, Yuelin G.(2020) Mean VaR multi-stage
optimization model for the portfolio considering
transaction costs.Journal of Engineering Mathematics,
37(06): 673-684.
Xiwen S, Xiaoxing H, Jiahui H, Jie W, Yifeng T.(2022) A
new method for noise reduction of coordinate time
series of CEEMDAN[J/OL].Navigational Positioning
Journal:1-8[2022-06-22].
Xu LAN, Qin Xiujuan, An Wei, Gao Zhiqiang.(2022)
Comprehensive Evaluation of Wheat Variety Based on
Principal Compent Analysis. Journal of Gansu
Agricultural University:1-12[2022-06-22].
Yadav P, Yadav S, Singh D, Kapoor RM, Giri BS. (2022)
An analytical hierarchy process based decision support
system for the selection of biogas up-gradation
technologies. Chemosphere. 302:134741.
Yang Muqing. Study on gold price prediction based on
parameters and model uncertainty. Hunan University,
2019.
Yechen Z, David Dickinson, Jianjun L. (2017) Analysis on
the influence factors of Bitcoin’s price based on VEC
model [J]. Financial Innovation,3(1).:1-13.
Yeong Z, Yulin L, Minke Z, Geng X.(2021) Based on
Entropy Right TOPSIS Model. Technology and
market,28(12):145-148.
Yue W. (2021) Research on Stock Portfolio Construction
Based on LSTM Neural Network. Harbin Institute of
Technology,.
Zheshi C. (2021) Research on the influencing factors of
Internet and financial futures and the prediction
methods of Bitcoin price.Harbin Industrial University
study.
Zhu H., Wang Y., Wang K., Chen Y. (2011) Particle Swarm
Optimization (PSO) for the constrained portfolio
optimization problem. Expert Systems with
Applications, 38(8).
Zola. (2021) A Study on the Portfolio Strategy Based on the
Mean-Variance Model. Research on Financial
Theory ,2021(05):9-16.
Zhang X, Wu X, Zhang L, Chen Z. (2022) The Evaluation
of Mean-Detrended Cross-Correlation Analysis
Portfolio Strategy for Multiple risk Assets. Eval
Rev,46(2):138-164.
2022.Mathematical modeling competition for American
College
Students.https://www.mathmodels.org/Problems/2022/
MCM-C/index.html.
Optimal Investment Strategies for Gold Bitcoin Portfolio Based on the LSTM and AHP Models
337
