
Data Technology Apply in Business Decision Making:
How to Use Data Information to Make Business Decisions in the
Digital Age
Xingxian Li
63-1-1001 Xinxian Jiayuan, Huairou District, Beijing, 101400 Beijing, China
Keywords: Business Decisions, Data-Driven, Data Capature, Data Cleansing and Standardization, RPA Technology, The
Normalized, Z – Score, Fitting, Data Conversion.
Abstract: Data are an important asset of an enterprise, changing the way information is connected and reshaping the
future of the enterprise. To make business decisions quickly and without mistakes, business managers must
rely on data and information. The construction of enterprise data information will follow the DIKW model,
the seven-step process rule, the four-layer technical framework and the underlying powerful algorithm
foundation. Data capature, data cleaning and standardization, and data modeling are the basis for making
business decisions based on data information. This academic paper will talk about the basic methods of data
standardization and data modeling. It comes from working practice.
1 INTRODUCTION
Business decision is a process in which enterprises or
organizations make decisions on future actions after
analyzing, calculating and judging the factors
affecting the realization of goals based on objective
possibilities and certain tools, skills and methods with
the help of certain information and experience. For
business managers, management is decision-making.
"Decision-making occupies the core position in
management activities and runs through the entire
process of management activities." (Li, 2020)
Efficient and high-quality decision-making drives
the enterprise to continuously provide high-quality
products (or services), making the enterprise stand out
and win in the fierce market competition. In today's
digital era, the speed and amplitude of change are far
beyond the past, which puts forward higher
requirements on the decision-making ability of
enterprises, and the decision-making must be both
good and fast. However, in the real business world, the
decisions made by enterprise managers fail to reach
the expected goals due to the lack of systematic
methods. "According to Microsoft, more than 74
percent of business decisions are behind schedule or
fail......" jean-Paul Sartre wrote in his book The
Difficulty of Making Decisions. The actual situation
is so bad, what kind of decision-making mechanism
can provide enterprise managers with ways and means
to get out of the decision-making dilemma? Based on
years of enterprise management experience and
systematic learning summary, the article author has
been studying the management advantages of
advanced enterprises in recent years, and comes to the
conclusion that only by relying on digital technology
can we make high-quality decisions and avoid
decision-making mistakes. The digital technology
mentioned here is not only the summary of the past
data information and experience, but also the
simulation and prediction of the future trend. For
example, Amazon's personalized recommendation
based on big data derives more than one third of its
revenue from recommendation functions. McKinsey
defines "Industry 4.0" as the digitization of
manufacturing, with sensors embedded in almost all
components and equipment, and the widespread
introduction of cyber-physical systems that analyze all
available data. Relying on digital technology, senior
managers, middle managers and first line managers
respectively focus on strategic decisions, management
decisions and daily rountine operation decisions, and
they play their own role to ensure the continuous and
efficient operation of the enterprise and its survival in
the ever-changing business world.
Li, X.
Data Technology Apply in Business Decision Making: How to Use Data Information to Make Business Decisions in the Digital Age.
DOI: 10.5220/0012028900003620
In Proceedings of the 4th International Conference on Economic Management and Model Engineering (ICEMME 2022), pages 247-256
ISBN: 978-989-758-636-1
Copyright
c
2023 by SCITEPRESS – Science and Technology Publications, Lda. Under CC license (CC BY-NC-ND 4.0)
247
2 DATA-DRIVEN BUSINESS
DECISIONS ARE AN
INEVITABLE CHOICE FOR
ENTERPRISES
2.1 Definition of Business Decisions
Talking about business decision, let's take a look at its
definition first: Business decision is made by the
relevant organization of the enterprise to enhance the
strength of the enterprise, improve the profitability of
the production and operation of the decision. Business
decision-making mechanism is a mechanism by which
enterprise managers make decisions on production,
management and other business activities under the
condition of having sufficient legal person property
rights. The business decision mechanism is in the
main position in the operation mechanism. It is not
only the basis of designing other mechanisms, but also
runs through the operation of other mechanisms. A
sound decision-making mechanism is a necessary
condition for effective decision-making.
2.2 The Main Points of Decision Theory
Since the second World War, many operational
researchers, statisticians, computer scientists and
behavioral scientists have been trying to find a
scientific way of making decisions in the field of
management in order to make clear and rational
choices on complex multi-scheme problems. With the
study of this aspect, decision theory has been
developed rapidly. Decision Theory School is an
emerging management School based on statistics and
behavioral science and using computer technology
and research methods. The main representatives of
traditional theories are Herbert Simon, A. Simon and
James G. March. The core theory is the decision
theory proposed by Herbert Simon, and the main
viewpoints are as follows:
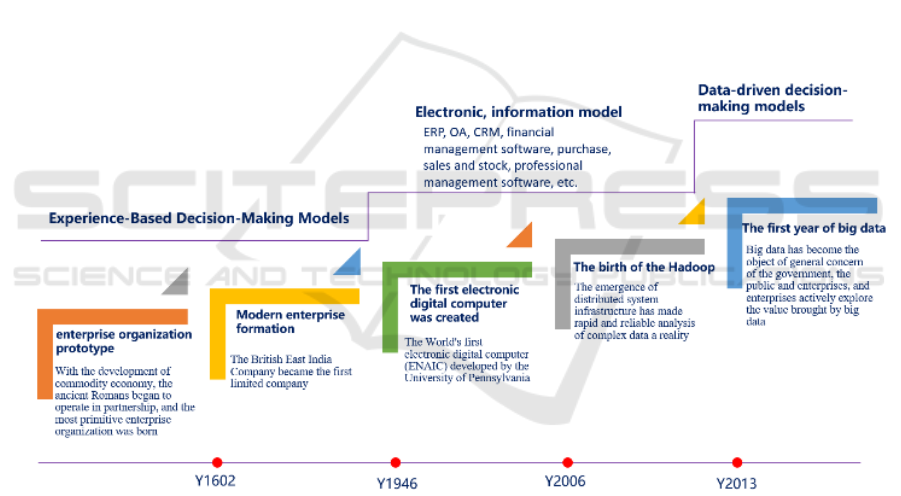
Figure 1: Three stages of business decisions rely on.
• Management is decision-making: Simon et al.
believe that the whole process of management
activities is decision-making process. Determining
objectives, making plans and selecting plans are
business plans and planning decisions; Mechanism
design, production unit organization and authority
allocation are organizational decisions; Inspection of
plan execution, wIP control and selection of control
means are control decisions. Decision-making runs
through the whole management process, so
management is decision-making.
• Decision making is divided into procedural
decision making and non-procedural decision making:
procedural decision making refers to the decision
made in accordance with established procedures;
Special treatment is required when the problem is
widespread, new, unstructured, or so important and
complex that there is no routine procedure to follow.
Decisions on such questions are called non-procedural
decisions.
• Satisfactory code of conduct: Simon thinks,
because the organization under the changing external
environment influence, to collect all the data which are
ICEMME 2022 - The International Conference on Economic Management and Model Engineering
248

difficult, and some action plans are more difficult to
list the sites, and the person's knowledge and ability is
limited, so when making decision, it is difficult to
obtain the best solution, in practice, even able to find
out the best solution, in economic terms have to
consider, People also tend not to pursue it, but to make
decisions based on satisfying principles.
With the development of digital technology,
modern decision-making theory has gradually come
into being, represented by Venkat Venkatraman. In his
book The Digital Matrix: New Rules for Business
Transformation through Technology, he provided
three decision-making methods conducive to success:
first, how to avoid getting lost in the dynamic
ecosystem: carefully build and participate in various
ecosystems; The second is how to work with different
companies to build new capabilities and create new
business value: to connect with competitors and
potential Allies; Finally, how to design the
organizational structure to reflect the new and
powerful model of human-computer interaction: using
powerful machines to amplify the enterprise's
potential.
2.3 The Three Stages of Development of
Business Decisions
With the application of new advanced informatization
and digital technologies such as artificial intelligence,
cloud computing, big data, blockchain, Internet of
Things, and the Internet, the degree of digitization of
society continues to increase, and data have become
an important element in building a modern society.
From 2020, data have become the fifth largest factor
of production after land, labor, capital and technology.
It is an important asset of enterprises and, of course,
an important asset of individuals, organizations and
even countries. "In the digital age, companies need to
have a new understanding of data, because data has
become the new core asset." (Ram, 2020) Business
decisions based on data information will not affect the
quality of decision-making due to the subjective
factors of managers, and avoid decision-making
mistakes or major decision-making mistakes.
"Information and value form the 'foundation' of
decision-making: what we can do, what we know, and
what we want." (Carl, 2017) The evolution process of
the basis for supporting decision-making is shown in
Figure 1: The three stages of the business decision-
making model are the empirical decision-making
model, the electronic information decision-making
model and the data-driven decision-making model.
Since 2013, enterprises have entered the data-driven
decision-making model. The data-driven decision-
making model reflects that the entire business chain of
the enterprise's R&D, planning, organization,
production, coordination, sales, service and
innovation uses digital decision-making, and supports
the strategic decision-making and planning of the
entire enterprise, enabling the enterprise to achieve
overall Decision intelligence, and ultimately lead the
transformation of enterprises and even the industry
through data-driven. The Fraunhofer Institute in
Germany put forward the concept of Industry 4.0. The
institute believes that the logical starting point of
Industry 4.0 is to adapt to the rapid changes in the
competitive environment. How does an enterprise
adapt to the rapid changes in the market + users +
products + technology, it can be seen that the
traditional low-frequency decision-making
mechanism cannot adapt to the high-frequency
decision-making needs in emergencies, and data-
driven fast and high-quality decision-making is an
inevitable choice for modern enterprises.
3 THE FORMATION PROCESS
OF BUSINESS DECISION
DRIVEN BY DATA
INFORMATION FROM DIKW
MODEL
Just like the accumulation of knowledge, the
formation of data-driven decision mechanism is
essentially a process of enterprise capacity building.
Enterprise-related data are collected, processed,
identified, processed and presented, and finally
become the knowledge and wisdom to guide
enterprise operation and management. This process is
presented by DIKW model as shown in Figure 2,
which is to understand this process from the cognitive
level.
3.1 The Relationship Between DIKW
Model and Enterprise to Make
Intelligent Business Decision
DIKW shows the universal process of evolution from
data, information, knowledge to wisdom. This model
will also be followed by intelligent decision-making
based on data information from the enterprise.
• D-Data: Data can be numbers, words, images,
symbols, etc. It comes directly from facts and can be
obtained through original observation or
measurement.
Data Technology Apply in Business Decision Making: How to Use Data Information to Make Business Decisions in the Digital Age
249
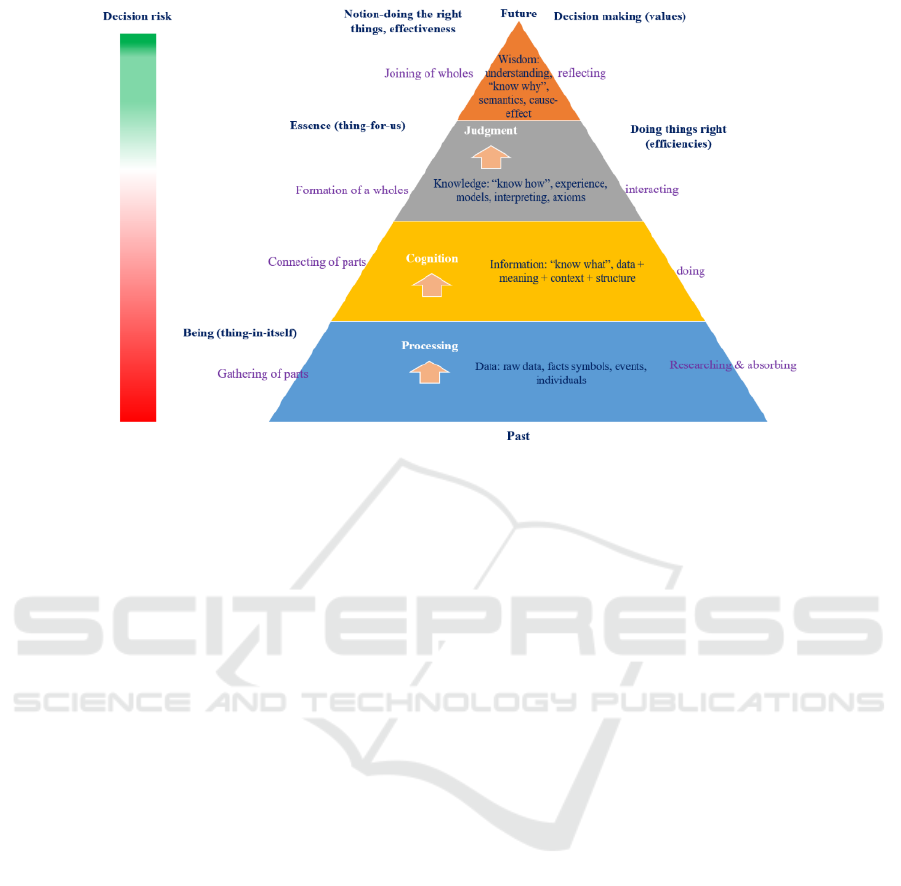
Figure 2: DIKW model and business Intelligence decision process.
• I-Information: by organizing and processing
data in a certain way and analyzing the relationship
between data, data become meaningful, which are
Information. Information can answer simple questions
such as: Who? What? Where to? What time? So
information can also be thought of as data that is
understood.
• K-knowledge: Knowledge is useful
information filtered, refined and processed from
relevant information. It is a collection of information
that makes information useful. It is a process of
judging and confirming information, which combines
experience, context, interpretation and reflection.
Knowledge establishes meaningful connections
between data and information, and between
information and the application of information in
action. It embodies the essence, principles and
experience of information. Knowledge answered,
"Well?" Problems to help enterprise modeling and
simulation.
• W-Wisdom: Wisdom is an extrapolated,
nondeterministic, nonjudgmental process. Unlike
previous stages, wisdom focuses on the future, trying
to understand what was not understood or done in the
past. Wisdom can be summarized as the ability to
make sound judgments and decisions, including the
best use of knowledge. Wisdom answers the question
"Why?"
3.2 Smart Business Decisions Take
Time to Build
It takes time, maybe a year or even a few of years,
from data capature to the extraction of information
then to intelligent decisions of enterprises. First of all,
data capature is complicated, because data sources are
online, offline, inside and outside the company,
including historical data and model-based forecast
data. Secondly, after the data are obtained, how to
organize the data to make it information, involves data
cleaning, sorting, association and other technical
problems; Thirdly, the information obtained from data
capatureis massive and needs to be processed,
extracted and abstracted. This process involves the use
of various analytical methods, and it is a process that
is gradually deepened with business insight. Only
when enterprise managers' cognitive level reaches a
certain level, and with the assistance of IT technology,
can they be data-driven. Digital decision making
focuses on the automation and optimization of specific
business decisions. (Venkat, 2018)
ICEMME 2022 - The International Conference on Economic Management and Model Engineering
250
4 HOW IS THE DATA-DRIVEN
DECISION PROCESS
IMPLEMENTED FROM THE
PERSPECTIVE OF PROCESS
CONSTRUCTION
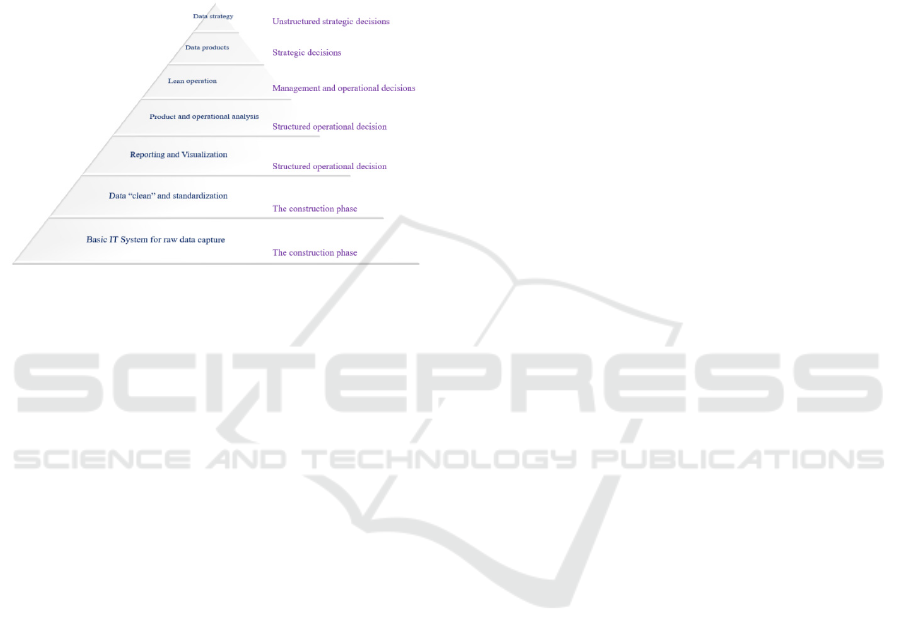
The process of implementing data-driven decision-
making is divided into 7 levels, as shown in Figure 3
below:
Figure 3: The 7 stages of data-driven enterprise business
decision making.
1) Basic IT system: The first level is the "basic IT
system", which is a data-driven foundation, and its
function is to complete data capature. It mainly refers
to the software system and its supporting hardware
equipment used by the enterprise in the actual
operation process, such as various business systems
of the enterprise, financial management software,
CRM system; hardware equipment such as sensors,
detectors, etc., these systems complete "data
capature" task. "It can be said that the best, latest and
most flexible ideas come from the end." (Tencent,
2020) The raw data obtained after data capature are
non-standard and unusable. They must be processed
before they are meaningful, thus entering the next
stage of "data cleaning and standardization".
2) Data cleaning and standardization: At the "data
cleaning and standardization" level, what we are
trying to achieve is to break down data barriers so that
data can flow normally within the enterprise. (Wang,
2020) The work of this stage covers: a) data cleaning;
b) Data integration; c) Data distribution and
transformation; d) Data reduction and other pre-
processing work.
3) Data reporting and Visualization: The question
in this step is: How do you make the data visible? The
simplest and most straightforward method is "data
reporting." It is to construct various forms according
to daily business usage and fill in a large amount of
data in the forms. Some enterprises make reports
manually, some enterprises use report engine to make
reports, and some enterprises enter the stage of data
analysis and visualization. Through BI and other
analysis tools, they delegate the right of data analysis
to the user end, helping the business to quickly get
data and quickly make reports, and even do some
analysis independently. From "basic IT systems" to
"data reporting and visualization," the first three
levels are, in some ways, the foundation for data
analysis and application. For an enterprise, complete
the three levels, some companies are done manually,
some companies are localized deployment of IT
systems, some companies is done by the cloud IT
systems, only the three levels of ability, can be said
that the enterprise has the use of data to guide the
operation, the decision-making, management and so
on the basis of data applications.
4) Product and operation analysis: the first target
is the monitoring of daily operation; Second, when
the daily analysis has become a routine part of the job,
the enterprise products and business people will find
simple daily analysis cannot solve the problem of
complex management and strategic decision, unable
to bring a surprise to customers, which requires the
user, product, channel, market, demand, and so on
aspects of deep analysis and research. In this process,
many business-specific analysis topics and data
models have emerged to help enterprises better
understand the market, and capture customers and
potential business opportunities. The most
representative example of this is "user portraits".
5) Lean operation: At the level of "lean
operation", all analyses are no longer isolated from
each other, but more based on an actual business
scenario to realize the overall management of all
processes in this scenario. If multiple applications or
systems can be built in each field of the enterprise,
then these aggregations can basically support the
main enterprise operation and management.
6) Data product: Data mining is an evolutionary
product generated by enterprise data, and it is one of
the many ways for enterprises to realize the value of
internal data. Data products in the physical industry
are often due to the fact that the internal data
capabilities of the enterprise have grown to a certain
stage, and some internal data and analysis methods of
the enterprise have already met the conditions for
independent realization, so they are taken out by the
enterprise as a type of product and provided to the
market. Data products are formed, and the data
products of entity enterprises serve more within the
organization.
7) Data Strategy: Companies use data
strategically to accelerate decision-making through
Data Technology Apply in Business Decision Making: How to Use Data Information to Make Business Decisions in the Digital Age
251
business insights and ultimately achieve their
strategic goals. After long-term scientific
governance, data have become a strategic resource for
enterprises, and data information are used to gain
competitive advantages and achieve business goals.
5 SEE HOW DATA-DRIVEN
DECISION-MAKING GOALS
ARE ACHIEVED WITH THE
TECHNICAL FRAMEWORK
OF IT
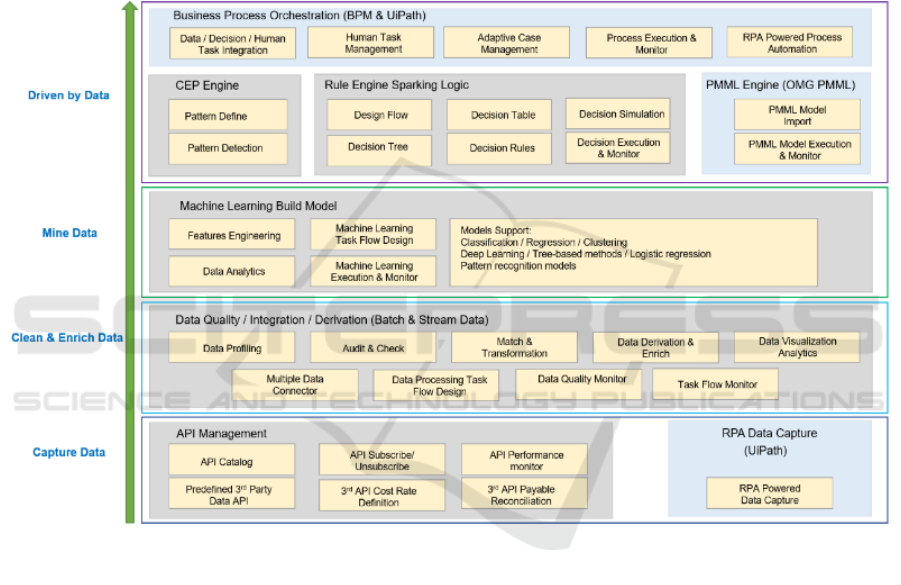
In order to achieve data-driven decision-making goal,
the technical architecture of the enterprise system is
divided into four levels: data capture → data
standardization → mining data value → making
intelligent decisions, as shown in Figure 4:
Figure 4: A 4-tier technical framework for data-driven business decisions
Data capture: The data API management platform
uses RPA technology for data aggregation, integrates
the data scattered in various information islands, and
displays the data source and data call records at the
same time to ensure the stability of data calls.
Real-time data processing (cleaning,
standardization, etc.), data quality management: CEP
stream computing software, powerful stream data
computing capability, can handle complex events;
massive data throughput, millisecond-level response.
Data mining: Machine learning platform, with
powerful integration capabilities of data and tools, can
be easily expanded; general technology can preset
more than 2,000 modules of Hull's advanced
algorithms, auxiliary modeling, etc.
Intelligent business decision: decision engine
platform; timely early warning and rapid response
operation monitoring system; data visualization
system. FICO, IBM, Experian and other technologies
achieve easy-to-use, agile, and intelligent effects.
6 EXAMPLE: DATA CLEANING,
STANDARDIZATION
METHODS
The previous part succinctly shows the IT technical
architecture that data support business decision-
making. Data collection can rely on various software
systems, hardware equipment established by the
ICEMME 2022 - The International Conference on Economic Management and Model Engineering
252
enterprise in the past, or even collect data manually,
and complete the aggregation through RPA robots.
The aggregated data are waiting for cleaning and
standardization. This process cannot be done
manually and must rely on technology. “Data by
themselves do not express any meaning, they are only
when data are combined with logic that we can
discover and express insights.” (Zhou, 2021)
Therefore, this chapter will introduce data cleaning
and standardization methods, which are part of big
data processing and come from work practice. The
methods are as follows:
6.1 Data Normalization
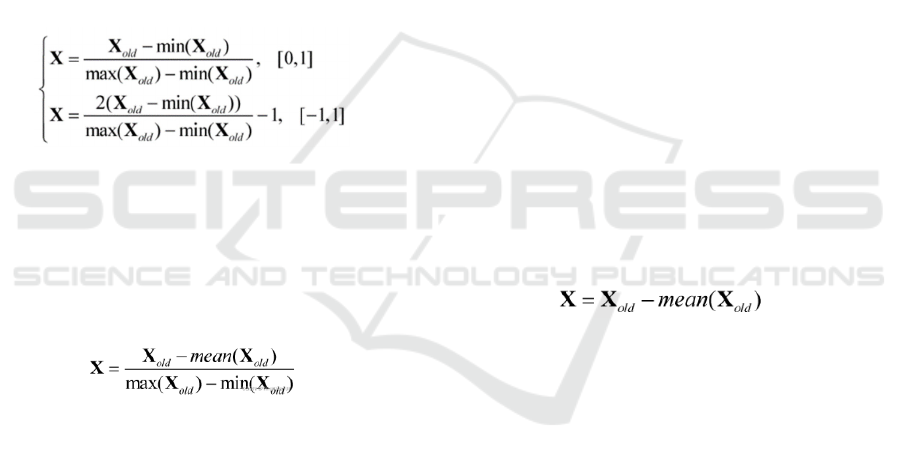
1) Data normalization: Data normalization is to map
the dimensional features of the data into a specified
range, [0, 1] or [-1, 1], and a compression dimension.
Normalization types can be divided into:
(1)
• Max-min normalization, the equation is as (1),
where X
old
is the original data set with m samples and
n features. min(X
old
) and max(X
old
) represent the
extreme values for each feature of the original data set.
• Mean normalization, the equation for mean
normalization is as (2), where mean(X
old
) represents
the mean value of each feature of the original data set.
(2)
• Non-linear normalization: Take the logarithm
of the original data. Non-linear normalization does not
scale the dimensional features of the original data to a
certain range, but reduces the scale (dimension) of the
dimensional features. Usually in some data
processing, the logarithm of the original data is often
taken before further processing. The reason for this is
that the logarithmic function is a monotonically
increasing function in its definition domain. After
taking the logarithm, it will not change the nature and
correlation of the data, and it can also compress the
scale (dimension) of the feature.
2) Additional notes on data normalization methods:
Features: Normalization will change the data
distribution of the original data, and the original
information is not preserved. The purpose of scaling
different features is to make the influence weights of
each feature dimension on the objective function to be
the same. At the same time, due to the different
degrees of scaling and transformation for different
features, the projected contour lines of those flat
distribution objective functions tend to be circular,
which also changes the distribution type of the original
data.
Functions: a) Speed up the training: such as the
convergence speed of the objective function in the
iterative algorithm; b) Balance the weights of the
features in each dimension to avoid the interference of
the features with too large or too small a numerical
scale on the model
Disadvantage: After normalizing the data,
although the weight of each dimension is balanced, it
also changes the data distribution of the original data,
that is, destroys the data structure.
6.2 z-score
Scale the data to a data distribution centered at 0 and
a standard deviation of 1 (Note: a data distribution
with a mean of 0 and a standard deviation of 1 is not
necessarily a normal distribution, it may also be a t
distribution or other distribution), in addition, z-score
retains the original data information and does not
change the original data distribution type. The purpose
of the z-score is also to make different features of the
raw data comparable. The z-score equation is shown
in (3)
(3)
In the equation, µ is the vector of the mean of each
column feature of the original data set, µ=mean
(Xold), σ is the vector of the standard deviation of
each feature of the original data set.
Comparison of data normalization and z-score:
The same aspect of normalization and z-score:
both perform linear transformation on the original
data, that is, both translate the sample points and then
shorten the distance, so that the different features of
the original data are comparable
The difference between normalization and z-score:
a) the impact of normalization on the objective
function is reflected in the value, while the impact of
z-score on the objective function is reflected in the
geometric distribution of the data; b) normalization
changes the amount of data level and also change the
distribution of the data, Z-score only changes the
magnitude of the data but does not change the
distribution type of the data; c) z-score normalizes the
data, does not change the contour projection of the
objective function, and will Continue to maintain the
Data Technology Apply in Business Decision Making: How to Use Data Information to Make Business Decisions in the Digital Age
253
flatness of the original objective function, and
normalize the data to make the contour projection of
the objective function appear circular; d) In the
gradient descent algorithm, normalizing the data helps
to speed up the convergence of the algorithm.
Data normalization and z-score usage scenarios:
• Using gradient descent parameter estimation
model: using normalized data can improve the
convergence speed of the algorithm
• PCA dimensionality reduction algorithm
needs to be decentralized, so Z-Score processing can
be used
• For specific requirements on value range, data
should be normalized, such as image processing,
where pixel intensity must be normalized to fit a
certain range (RGB color range 0 to 255).
• Probabilistic models are insensitive to feature
dimensional differences and can be standardized
without using measurement indicators (such as
decision trees).
In general, z-Score processing is used when it is
uncertain which data processing method to use,
because it does not change the data distribution type,
that is, does not break the data structure.
6.4 Centralization/Zero Meanization
After centralizing the data, the mean value of the data
is a 0 vector, which is to translate the original data to
the vicinity of the origin. The centralized processing
of data is a process of translation one by one, and does
not change the type of data distribution. Suitable for
PCA dimensionality reduction algorithm. The
centralized preprocessing expression is as (4)
(4)
The function is to facilitate the calculation of the
covariance matrix, remove the influence of the
intercept term (bias term), and increase the
orthogonality of the basis vector.
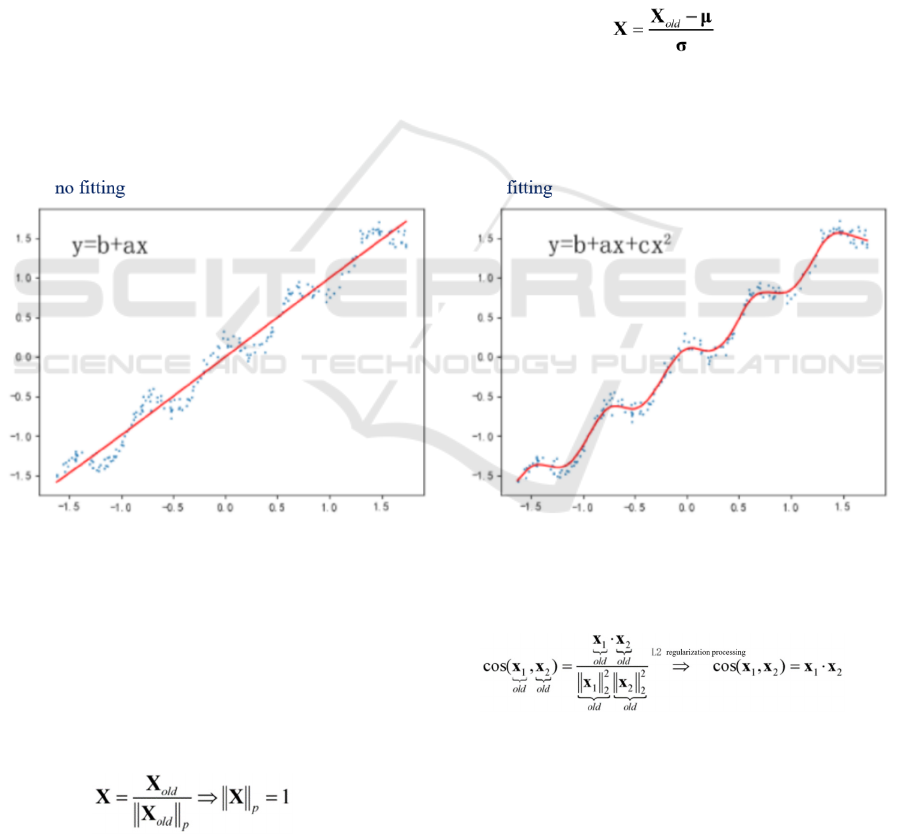
Figure5Fitting of Linear Regression.
6.3 Regularization
Regularize the data to scale a certain norm (L1 norm,
L2 norm) of each sample to 1, that is, calculate its p-
norm for each sample, and then for each element in the
sample Divide by this norm such that the p-norm of
each sample of the processed data is equal to 1. The
equation is as (5)
(5)
Regularization processing data is mainly used in
text classification and clustering, and has a great effect
on the need to calculate the similarity between
samples, such as (6) calculating the cosine similarity
of sample X
1
and sample X
2
(6)
7 EXAMPLES: DATA
MODELING, MACHINE
LEARNING METHODS
Machine learning is for modeling, so as to predict the
future under the built model and guide decision-
ICEMME 2022 - The International Conference on Economic Management and Model Engineering
254

making. Here are some basic methods of machine
learning:
7.1 Polynomial Features
Polynomial feature is a way to increase the dimension
of data. In linear regression, when using simple X
1
and
X
2
features to fit the curve, it cannot be completed -
underfitting, but we can create new features such as X
2
to fit the data, a better model may be obtained, so we
sometimes do a polynomial process on the features,
that is, change the features X
1
, X
2
into X
1
2
, X
2
2
, as
shown in the following figure
7.2 Data Conversion
According to the central limit theorem in probability
theory, when the sample size is infinite, the limit of
many distributions is the normal distribution. Many
random variables in reality are formed by the
combined influence of a large number of independent
random factors, and each of these factors plays a small
role in the overall impact. Such random variables tend
to approximate a normal distribution. (Objective
background to the Central Limit Theorem).
From the point of view of entropy (used to measure
the degree of confusion of information), the entropy of
the normal distribution is the largest among all other
distributions when the mean and variance of the data
are known (the original data distribution type is
unknown). According to the entropy standard,
"maximum entropy" is approximately equivalent to
"the closest uniform distribution under the same
constraints", that is, it is more practical. It can be
understood in this way that "entropy maximization" is
to make the ideal closer to reality, let the special
approach the general, and thus make the model more
general. Note that the entropy of the normal
distribution is actually determined by the variance,
and the "maximum entropy of normal variables" is a
conclusion in the context of a fixed variance. Different
variances obviously lead to different normal
distributions, and a normal distribution with higher
entropy has more variance - and is also closer to
"uniform" on the real axis.
Many machine learning models use normal
distributions, such as linear regression machine
learning models that require data features to be
normally distributed. If the data features are not
normally distributed, sometimes it is necessary to find
a mathematical transformation to transform the
features according to the normal distribution. Methods
as below:
1) Logarithmic transformation: For data
distributions that are highly skewed (eg, Skewness is
more than 3 times its standard error), we can take
logarithmic processing. Among them, it can be
divided into natural logarithm and logarithm with
base 10. Among them, logarithm with base 10 has the
strongest correction force, but sometimes it is
overcorrected and converts positive skewness into
negative skewness. The equation is as (7)
X = log(Xold) (7)
2) Square root transformation: The square root
transformation normalizes the samples that obey the
Poisson distribution or the samples with mild
skewness, or when the variance of each sample is
positively correlated with the mean, the square root
transformation can be used to make the variance
homogeneous sex. The expression is as (8)
Ξ=
𝑋
(8)
3) Reciprocal transformation: It is often used for
data with large fluctuations at both ends of the
distribution. The reciprocal transformation can
reduce the influence of extreme values. The
expression is as (9)
Ξ=1/Ξ
ολδ
(9)
4) Square root inverse rotation transformation:
commonly used for data subject to binomial
distribution or percentage. It is generally believed that
the equal overall rate is small (such as <30%) or large
(such as >70%), and the deviation from normality is
more obvious. Through the inverse transformation of
the square root of the sample rate, the data can be
close to the normal distribution, and the variance can
be achieved. homogeneity requirements. The
expression is as (10)
Ξ=ασιν(
𝑋
) (10)
5) BOX-COX transformation: usually used when
the continuous response variable does not meet the
normal distribution. In some cases (P value of
characteristic distribution < 0.003) the above methods
(square transformation, etc.) are difficult to achieve
normalization, so Box-Cox transformation can be
considered, but when P value > 0.003, using both
methods Yes, the ordinary square transformation is
preferred. (About the technical example, write it here
first, and we will discuss it together when we have the
opportunity)
Data Technology Apply in Business Decision Making: How to Use Data Information to Make Business Decisions in the Digital Age
255

8 CONCLUSIONS
Standardized data information is the basis for business
decisions. Data information is first and foremost a
perceptron of the environment. With the help of
technologies such as artificial intelligence, they work
side by side with corporate decision makers to make
up for human shortcomings and help the entire
organization run efficiently.
ACKNOWLEDGMENT
My sincere thanks to:
1. The knowledge taught by the tutors of the
Russian Friendship University makes my knowledge
a system;
2. The superior managers, colleagues, and
subordinates I meet in my work are the support,
guidance, and tolerance you have given me in practice.
It is not an exaggeration to use the idiom "a thousand
tempering";
3. Guidance from the reviewers of "2022 4th
International Conference on Economic Management
and Model Engineering (ICEMME2022)";
4. Strong support from my family.
REFERENCES
Audio books - In-depth Interpretation RPA, Reader Wang
Yan, Produced by Huazang, September 2020.
"DECISION QUALITY: VALUE CREATION FROM
BETTER BUSINESS DECISIONS" authors: Carl
Speitzler, Hannah Winter, Jennifer Meyer. Hunan
Literature and Art Publishing House, 2017
"McKinsey structured Strategic Thinking", author: Zhou
Guoyuan, Posts and Telecommunications Press,
January 2021.
"Modern Enterprise Management", authors: Li Dongjin,
Qin Yong, Chen Shuang, Posts and
Telecommunications Press, September 2020.
"Super Connection", Author: Tencent Smart Retail, Citic
Press, August 2020
"The Amazon Management System" authors (USA) Ram
Charan, (China) Yimei Yang. Machinery Industry
Press, 2020
"The Digital Matrix: New Rules for Business
Transformation through Technology", author: Venkat
Venkatraman, Guangdong People's Publishing House,
2018
ICEMME 2022 - The International Conference on Economic Management and Model Engineering
256
