
Classification of Parkinson’s Disease Using the Frequency-Specific
Changes of Resting Brain Activity
Jiaqi Tang, Runhan Zhang and Jiayi Pu
Keystone Academy, Beijing 101318, China
jiayi.pu@student.keystoneacademy.cn
Keywords:
Parkinson’s Disease, Frequency-Specific Changes, Resting-State Functional Magnetic Resonance Imaging,
Machine Learning, Classification.
Abstract:
Resting state functional magnetic resonance imaging has become a widely used method for diagnosingof
Parkinson's disease. Nevertheless, machine-learning technology has not been used to better classify disease
results from MRI signals. Here, the slow-frequency fluctuation amplitudes of patients and healthy controls
are measured as input to the machine learning model. The features and classification capabilities of the
machine learning model are respectively evaluated by the T-test and linear support vector machine. . The
signals from three frequency bands (Slow-5, 0.01-0.03 Hz; Slow-4, 0.03-0.08 Hz; conventional, 0.01-0.08
Hz) are analyzed. We found that in the classification of Parkinson's disease, Slow-4 signal provides more
information than Slow-5, and its classification ability is comparable to traditional frequency bands. This study
shows that machine-learning technology is a promising method of detecting abnormal areas and activities in
Parkinson's disease, and multi-band data can give us more specific message.
1 INTRODUCTION
Parkinson's disease (PD) is a kind of
neurodegenerative disease which mainly affects
dopaminergic (dopamine-producing) neurons in the
substantia nigra and basal ganglia (Blandini, 2000).
Neurons in the substantia nigra produce the
neurotransmitter dopamine, which regulates synaptic
transmission and controls body movement. In PD
patients, dopaminergic neurons in the substantia
nigra gradually die. When 80% of dopaminergic
neurons are lost, a variety of typical PD symptoms
occur, including tremor, slow movement, stiffness,
and balance problems (Surmeier, 2018). In addition
to motor control, dopamine also plays a vital role in
higher cognitive functions, including motivation,
learning, and memory. In fact, dopamine deficiency
is associated with many neurological and psychiatric
diseases, such as Parkinson's disease, schizophrenia,
depression, attention deficit/hyperactivity disorder
(ADHD), and addiction (Burbulla, 2017). The
decrease in dopamine levels mainly leads to
abnormal brain activity in the basal ganglia network
(Qian, 2017), motor system (Hu, 2019) and visual
cortex (Meder, 2019; Spay, 2019). All of these can
cause movement disorders and sensory and cognitive
symptoms, such as gearing, axial and limb stiffness,
slow movement, stiffness, balance and tremor, and
decreased sense of touch and smell (Surmeier, 2018).
Machine learning (ML) has been used in the study
of the spatial patterns of abnormal cerebralin activity
areas in PD patients. It can be further divided into two
phases. I the first phase, a model trained through data
set is biult, and in the second stagethe classification
ability from an independent test data set is evaluated.
ML is an ideal new tool for clinical research because
it can integrate complex imaging data into
personalized diagnostic and prognostic indicators.
Through Comparison, it is clear that ML provides a
more effective multivariate pattern to analyze the
predictions for future observations than traditional
univariate analysis. In addition, it produces
independent P values that can be recorded in standard
tests. The ML model has been applied to various data
patterns for diagnosing PD, including handwriting
patterns (Licarete, 2020; Wiviott, 2019), sports
(Cherubini, 2014; Wahid, 2015), neural Image data
(Choi, 2017), speech patterns (Sakar, 2013),
cerebrospinal fluid (Maass, 2020), myocardial
scintigraphy (Nuvoli, 2020), and serum (Váradi,
2019). ML also allows combining data from different
experimental methods, including magnetic resonance
142
Tang, J., Zhang, R. and Pu, J.
Classification of Parkinson’s Disease Using the Frequency-Specific Changes of Resting Brain Activity.
DOI: 10.5220/0012015000003633
In Proceedings of the 4th International Conference on Biotechnology and Biomedicine (ICBB 2022), pages 142-148
ISBN: 978-989-758-637-8
Copyright
c
2023 by SCITEPRESS – Science and Technology Publications, Lda. Under CC license (CC BY-NC-ND 4.0)

imaging (MRI) (Wang, 2017) and single photon
emission computed tomography (SPECT)
(Cherubini, 2014). Using the ML method, scientists
have identified outstanding features that have
traditionally not been used for clinical diagnosis of
PD. In addition, they have ML to detect pre-clinical
stage or atypical forms of disease and better
understand the disease.
Resting functional magnetic resonance imaging
(RS-fMRI) is a way of assessing regional interactions
that occur at rest. It can be used to check PD on a
macro scale. fMRI enables scientists to understand
the neuronal activity in the body in PD (Meppelink,
2009). In addition, RS-fMRI enables scientists to
understand how functionally specialized brain
function areas change in comparsion with structural
MRI data..
The low frequency fluctuation amplitude (ALFF)
derived from classic fMRI is a method to measure the
total power withina given time in a typical frequency
range (0.01–0.08 Hz), and has been proven to be an
important indicator of regional spontaneous neurons
activity. The different frequencies of neuronal
oscillations may represent unique brain functions
(Thut, 2012). In the current study, we will examine
three frequency bands, Slow-5 (0.01–0.03 Hz), Slow-
4 (0.03–0.08 Hz), and traditional frequency bands
(0.01–0.08 Hz). Scientists found ALFF abnormalities
in the auxiliary motor cortex, thalamus, putamen, and
prefrontal cortex of PD patients (Skidmore, 2011).
In this study, we used Linear Support Vector
Machine (LSVM) to classify PD patients and healthy
controls (HC) according to slow 4, slow 5, and
regular frequency bands. We found that Slow-4
shows superior classification ability than Slow 5 and
is comparable to traditional bands.
2 MATERIALS AND METHODS
2.1 Background Information
The data for this study comes from an open source
dataset used for fMRI experiments. The 161 right-
handed participants were divided into two groups.
One is composed of 72 PD patients, and the other is
composed of 90 age- and gender-matched healthy
controls (HC). All PD patients were diagnosed as the
brain bank of the British Parkinson's Disease
Association (Gibb, 1988). The exclusion criteria for
PD patients include a Mini Mental State Examination
(MMSE) score <24, acute physical diseases, mainly
neurological diseases and other mental diseases. MRI
examination revealed no obvious abnormalities,
history of mental illness, or neurological disease.
Actual"on" state which includes Hoehn and Yahr
staging scale (H&Y) (Hoehn, 1998), Unified
Parkinson’s Disease Rating Scale Exercise Part III
(UPDRS III) (Vassar, 2012) and global Cognitive
function (Folstein, 1975) is used to evaluate the
clinical indicators of each PD patient.
2.2 MRI Data Acquisition
A 3.0 Tesla MR system (Discovery MR750, General
Electric, Milwaukee, WI, USA) was used to retrieve
magnetic resonance (MR) images. It acquires RS-
fMRI data through gradient echo planar imaging
(GRE-EPI) sequence with the following parameters:
repetition time (TR) = 2000 ms, echo time (TE) = 30
ms, flip angle = 90°, matrix size = 64 × 64, field of
view (FOV) = 220 × 220 mm
2
, thickness/gap = 3.5
mm / 0.6 mm, number of slices = 31. They obtained
the data of 140 participants’ brain volumes . During
the experiment, the participants were asked to close
their eyes, don’t think about anything and don’t fall
asleep. In order to obtain high-resolution structural
images for standardization purposes, we applied a
T1-weighted fluid attenuation inversion recovery
(FLAIR) sequence with the following parameters:
TR = 2530 ms, TE = 3.34 ms, flip angle = 7°, matrix
= 256 × 256, FOV = 256 × 256 mm
2
, thickness = 1
mm, no gap, number of slices = 196.
2.3 Image Processing
FMRIB software library (FSL:
http://www.fmrib.ox.ac.uk/fsl, version 5.0) and
functional NeoroImaging analysis (AFNI:
http://afni.nimh.nih.gov/afni, version
2011_12_21_1014) It is used to perform standard
preprocessing steps, including motion correction,
joint registration, segmentation and normalization.
Remove irrelevant noises that cause white matter,
ventricular signals, global signals, and motion
parameters to obtain fMRI signals for each voxel. No
spatial smoothing was performed in this study. In
order to determine the frequency-specific fMRI
profile to classify PD classification, the voxel ALFF
graph of the three frequency intervals (slow 5, 0.01–
0.03 Hz and slow 4, 0.03–0.08 Hz and regular, 0.01–
0.08 Hz) is used REST The filter function provided
in the toolbox is calculated (Yang, 2007; Song,
2014). We use the code in the Connectome
Compotation System to determine the frequency
band (Xu, 2015).
Classification of Parkinson’s Disease Using the Frequency-Specific Changes of Resting Brain Activity
143
2.4 Feature Extraction, Feature
Selection and Classification
The automatic anatomical labeling (AAL) template
image is used to estimate the average ALFF value of
each subject and extract the functional magnetic
resonance spectrum features of ML (Tzourio-
Mazoyer, 2002). Ninety brain regions were selected.
Therefore, we used the three frequency bands
respectively (slow 5, slow 4, or traditional) to obtain
a matrix of 90 features for 161 subjects. Moreover, in
order to check the effect of the method on the basis
of the structure atlas on our results, we performed
feature extraction based on the Power-264 atlas
(Power, 2011) and the Yeo-17 network (Thomas,
2011). Compared to the classification performance of
slow 5, slow 4, and traditional frequency band
combinations, we concatenate the ALFF values of
slow 5 and slow 4 to generate a single original feature
vector for each topic (Wee, 2012).
Implemented a feature selection method to
achieve high accuracy, study the most distinguishing
features, and avoid overfitting in the final classifier
training. According to previous research, two-sample
t-test was chosen for the feature selection method
(Cui, 2016). The outer loop is used to evaluate
classification performance, and the inner loop is used
to select the best subset of features. The classification
performance of these two loops is evaluated by linear
support vector machine (LSVM), which is one of the
most commonly used supervised ML methods.
Matlab's LIBSVM toolbox is used to perform LSVM
classification (Chang, 2011). The penalty factor C is
set to 1 (Cui, 2016). According to the LSVM score,
participants with positive scores are classified as HC,
and those with negative scores are classified as PD.
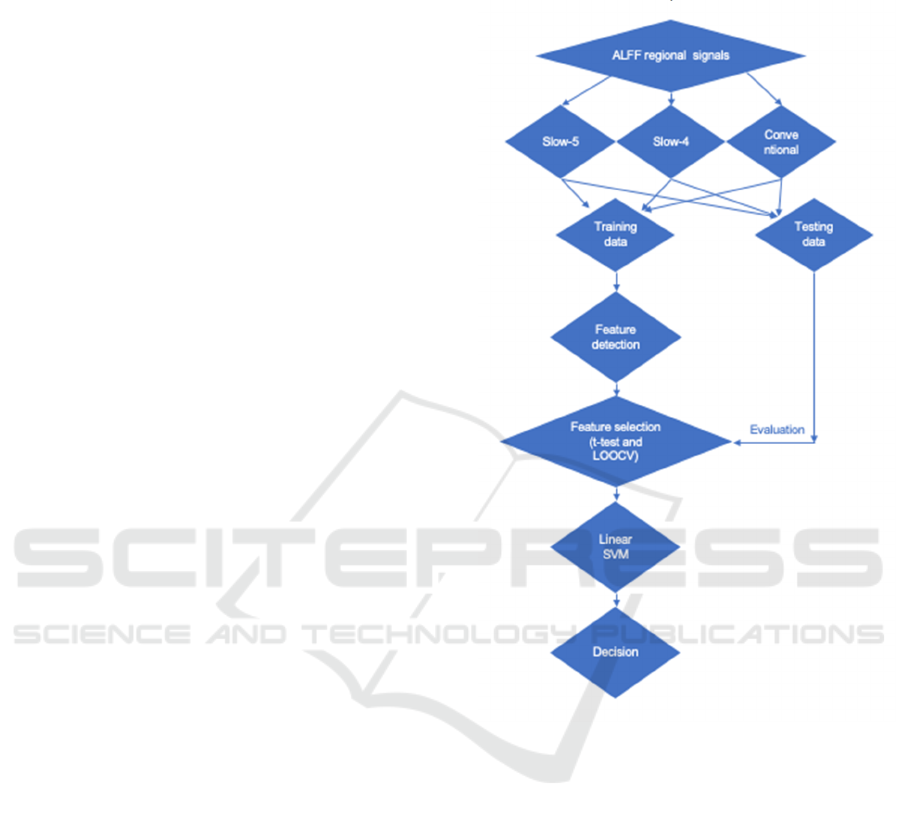
The detailed steps are as follows (Figure 1). (1)
Randomly select one subject from the entire data set
(N subjects) as the test subject, and leave the rest (N-
1 subjects) as the training set for each LOOCV. (2)
Repeat the inner LOOCV in each outer LOOCV fold,
and obtain N-2 subjects as the training subset of each
inner LOOCV. (3) Introduce the training subset of
each internal LOOCV (N-2 subjects) into feature
selection. In this study, we perform a two-sample t-
test for each feature and calculate the P value. Feature
selection is processed on the basis of a P threshold
from 0 to 1, with an interval of 0.01. Include and
exclude features below and above the P threshold,
respectively. The feature selection procedure is
repeated N-1 times for each P threshold, which
results in the accuracy of internal cross-validation.
Then we define the optimal P threshold is defined as
the P value with the highest internal cross-validation
accuracy. This threshold is used for the final classifier
training in the external LOOCV and obtain the final
cross-validation accuracy score (Wee, 2012).
Figure 1: Flow chart of data processing and ML modelling.
2.5 Evaluation of the Classification
Power of Various Indices
We use accuracy, sensitivity, and specificity values to
assess the classification ability of specific ALFF
methods at different frequencies. In addition, receiver
operating characteristics (ROC) and area under ROC
(AUC) are also used to evaluate the classification
performance of specific fMRI features in different
frequency bands, too. In addition, 1000 permutation
tests were performed to assess whether the figure of
the AUC and accuracy were significantly higher than
the random value. In addition, in order to compare the
classification performance of the multi-band (Slow-5
and Slow-4) with that of the single-band (Slow-5,
Slow-4 or traditional), we calculated the accuracy
difference and the AUC difference between them. For
ICBB 2022 - International Conference on Biotechnology and Biomedicine
144
nonparametric statistical tests, the P-value for
accuracy or AUC (or its difference) is calculated by
dividing by the number of permutations that show the
actual value (or its difference) higher than the real
sample.
3 RESULTS
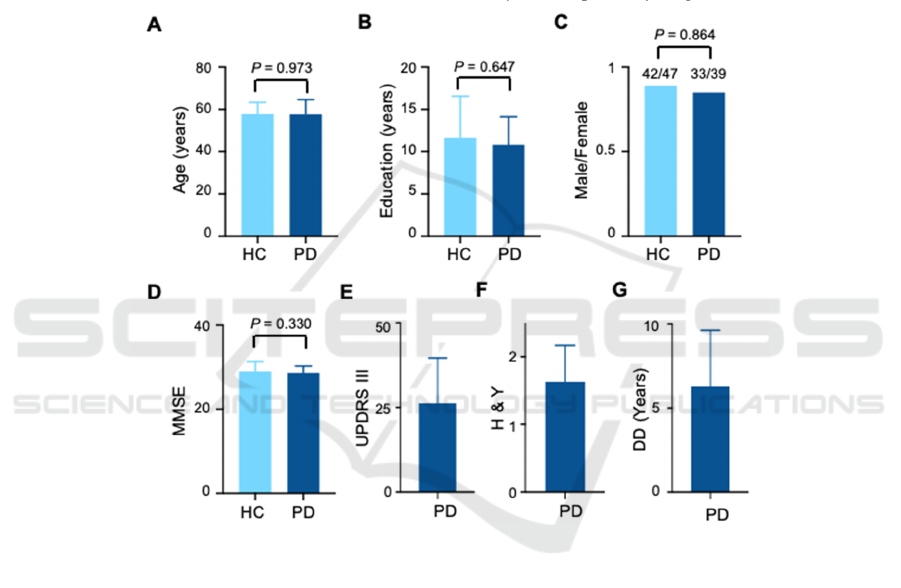
3.1 Basic Information
We did not find any significant differences in the age
(PD: 57.7 ± 7.0, HC: 57.7 ± 5.6, P = 0.97, two-sample
unpaired two-tailed t-test, N = 72, 89, respectively),
education level (PD: 10.8 ± 3.3, HC: 11.6 ± 5.0, P =
0.65, two-sample unpaired two-tailed t-test, N = 72,
89, respectively), sex (PD: 33/39, HC: 42/47, P =
0.86, Fisher’s exact test, N = 72, 89, respectively), or
MMSE scores (PD: 28.6 ± 1.7, HC: 29.0 ± 2.3, P =
0.33, two-sample unpaired two-tailed t-test, N = 72,
89, respectively) between PD patients and HCs. The
UPDRS III score, H&Y score, and disease duration
for PD patients were 26.2 ± 13.4, 1.6 ± 0.5, and 6.3 ±
3.4 years, respectively (Figure 2).
A. Distribution of ages of HC and PD. P = 0.973, two-sample unpaired two-tailed t-test, n = 89 and 72. B. Distribution of education
years. P = 0.647, two-sample unpaired two-tailed t-test, n = 89 and 72. C. Distribution of Male/Female ratios. P = 0.854, Fisher’s
exact test, n = 89 and 72. D. Distribution of MMSE values. P = 0.330, two-sample unpaired two-tailed t-test, n = 89 and 72. E.
Distribution of UPDRS III values. n = 72. F. Distribution of H & Y values. n = 72. G. Distribution of disease duration (DD). n = 72.
Figure 2: Basic information of health controls (HC) and PD patients.
3.2 Classification Performance
This study used three frequency bands, namely slow
5, slow 4 and regular frequency bands. The
classification is then determined by the linear support
vector machine (LSVM), a machine learning model
based on these bands. We further evaluated the
performance of the model (ie, AUC, accuracy,
sensitivity, and specificity). According to the AUC
value, we found that the performance of the models
based on Slow-5, Slow-4, and Conventional
frequency bands are 0.77, 0.81, and 0.84,
respectively; according to the Accuracy values, they
are 71.4, 76.8, and 79.5; according to the Sensitivity
values, they are 61.1, 74.7, and 73.6; According to
the specificity values, they were 79.8, 80.2 and 86.5
(Figure 3). These results show that classification
based on Slow-4 signal is better than classification
based on Slow-5 signal. In addition, the performance
of models based on Slow-4 signals is mostly
comparable to traditional frequency bands. Together,
we found that Slow-4 can be used as a diagnostic
criteria for PD patients to classify HC.
Classification of Parkinson’s Disease Using the Frequency-Specific Changes of Resting Brain Activity
145
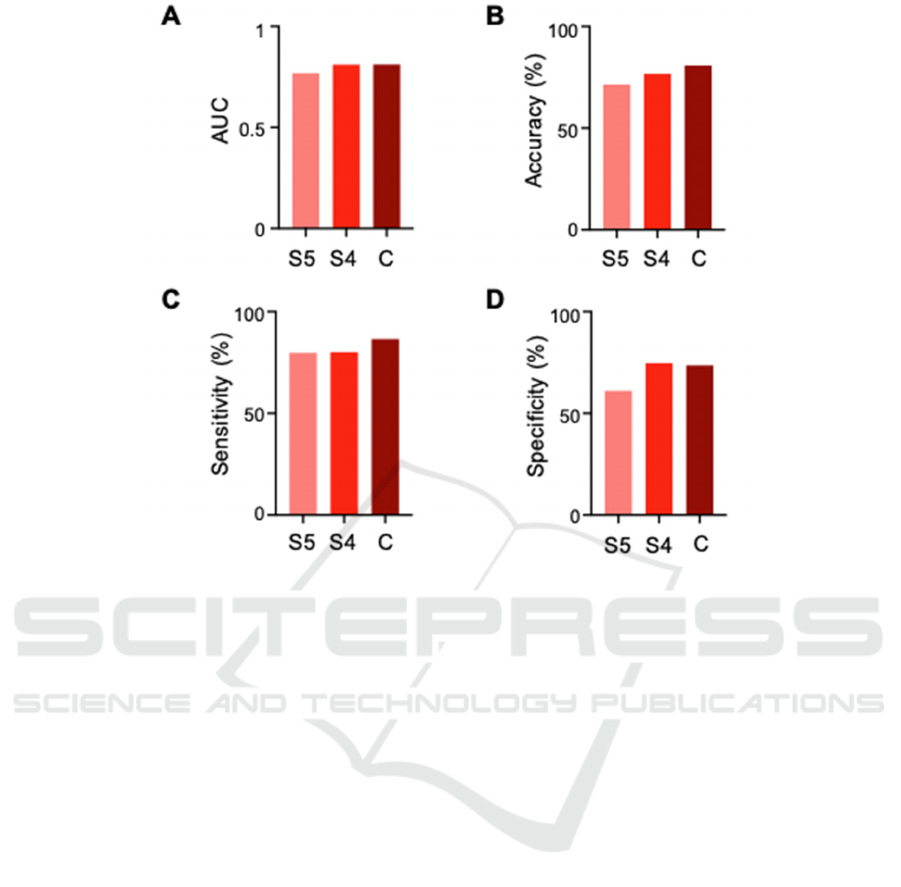
A. Comparison of AUC values among group S5, S4, and C. B. Comparison of Accuracy values (%) among group S5, S4, and C. C.
Comparison of Sensitivity values (%) among group S5, S4, and C. D. Comparison of Specificity values (%) among group S5, S4,
and C. LSVM, linear support vector machine; Slow-5 (S5), 0.01–0.03 Hz; Slow-4 (S4), 0.03–0.08 Hz; Conventional (C), 0.01–0.08
Hz; AUC, area under curve.
Figure 3: The results of the LSVM classifier with a single or combined features.
4 DISCUSSION
In the study, we used ML methods and multivariate
analysis to analyze the multi-frequency signals in the
brain and found two main findings. First of all, the
classification performance of all frequency band-
based schemes is significantly higher than that of
random schemes, indicating that all frequency bands
have good diagnostic capabilities. Secondly, through
comparing the classification performance of Slow-5
and Slow-4, we find the latter has more information
in PD classification than Slow-5.
Using LSVM to compare the classification
performance of each pair of schemes based on
frequency bins, we found that slow 4 signals (0.03-
0.08 Hz) provide more information on the
pathogenesis of PD. In addition, the results of the ML
method show that compared with the traditional
frequency band, the Slow-4 signal shows almost the
same classification performance. This shows that a
specific frequency interval can provide the most
information for PD classification.
Although the traditional method shows
classification performance comparable to multi-band
fMRI data processing, it fails to detect abnormal
activities in the lateral parietal cortex (Blandini,
2000; Tumati, 2019). Previous researches have
shown that this dysfunction is relevant to the
pathogenesis of PD (Tumati, 2019). In addition, the
classification performance of Slow-4 is superior to
the traditional frequency band (0.01-0.08 Hz) in
distinguishing the frozen and non-frozen gait of PD
patients (Hu, 2017). In summary, the results show
that multiple frequency bands can provide more
information for PD detection and classification.
5 CONCLUSION
In summary, here we established a ML framework
based on specific frequency bands in the ALFF
signals from the RS-fMRI data for the diagnosis of
PD. The results suggested the information from a
specific band (Slow-4) can provide more information
ICBB 2022 - International Conference on Biotechnology and Biomedicine
146

than any other frequency interval and is comparable
to the conventional wide-band frequency signals.
These data highlight the classification power of ML
approaches in the classification of PD by detecting
subtle and complex changes in the ALFF signals.
This study will shed light on future research on the
diagnosis and treatment for PD patients.
REFERENCES
Blandini, F, G Nappi, C Tassorelli, and E Martignoni.
2000. “Functional Changes of the Basal Ganglia
Circuitry in Parkinson’s Disease.” Progress in
Neurobiology 62 (1): 63–88.
https://doi.org/10.1016/s0301-0082(99)00067-2.
Burbulla, Lena F, Pingping Song, Joseph R Mazzulli,
Enrico Zampese, Yvette C Wong, Sohee Jeon, David P
Santos, et al. 2017. “Dopamine Oxidation Mediates
Mitochondrial and Lysosomal Dysfunction in
Parkinson’s Disease.” Science 357 (6357): 1255–61.
https://doi.org/10.1126/science.aam9080.
Cherubini, Andrea, Rita Nisticó, Fabiana Novellino, Maria
Salsone, Salvatore Nigro, Giulia Donzuso, and Aldo
Quattrone. 2014. “Magnetic Resonance Support Vector
Machine Discriminates Essential Tremor with Rest
Tremor from Tremor-Dominant Parkinson Disease.”
Movement Disorders 29 (9): 1216–19.
https://doi.org/10.1002/mds.25869.
Choi, Hongyoon, Seunggyun Ha, Hyung Jun Im, Sun Ha
Paek, and Dong Soo Lee. 2017. “Refining Diagnosis of
Parkinson’s Disease with Deep Learning-Based
Interpretation of Dopamine Transporter Imaging.”
NeuroImage: Clinical 16: 586–94.
https://doi.org/10.1016/j.nicl.2017.09.010.
Cui, Zaixu, Zhichao Xia, Mengmeng Su, Hua Shu, and
Gaolang Gong. 2016. “Disrupted White Matter
Connectivity Underlying Developmental Dyslexia: A
Machine Learning Approach.” Human Brain Mapping
37 (4): 1443–58. https://doi.org/10.1002/hbm.23112.
Chang, Luke J., Alec Smith, Martin Dufwenberg, and Alan
G. Sanfey. 2011. “Triangulating the Neural,
Psychological, and Economic Bases of Guilt
Aversion.” Neuron 70 (3): 560–72.
https://doi.org/10.1016/j.neuron.2011.02.056.
Folstein, Marshal F, Susan E Folstein, and Paul R McHugh.
1975. “‘Mini-Mental State.’” Journal of Psychiatric
Research 12 (3): 189–98. https://doi.org/10.1016/0022-
3956(75)90026-6.
Gibb, W R, and A J Lees. 1988. “The Relevance of the
Lewy Body to the Pathogenesis of Idiopathic
Parkinson’s Disease.” Journal of Neurology,
Neurosurgery & Psychiatry 51 (6): 745–52.
https://doi.org/10.1136/jnnp.51.6.745.
Hoehn, M M, and M D Yahr. 1998. “Parkinsonism: Onset,
Progression, and Mortality.” Neurology 50 (2): 318.
https://doi.org/10.1212/WNL.50.2.318.
Hu, Xiaofei, Yuchao Jiang, Xiaomei Jiang, Jiuquan Zhang,
Minglong Liang, Jing Li, Yanling Zhang, Dezhong
Yao, Cheng Luo, and Jian Wang. 2017. “Altered
Functional Connectivity Density in Subtypes of
Parkinson’s Disease.” Frontiers in Human
Neuroscience 11 (September).
https://doi.org/10.3389/fnhum.2017.00458.
Hu, Hongping, Yangyang Li, Yanping Bai, Juping Zhang,
and Maoxing Liu. 2019. “The Improved Antlion
Optimizer and Artificial Neural Network for Chinese
Influenza Prediction.” Complexity 2019 (August): 1–
12. https://doi.org/10.1155/2019/1480392.
Licarete, Emilia, Valentin Florian Rauca, Lavinia Luput,
Denise Drotar, Ioana Stejerean, Laura Patras, Bogdan
Dume, et al. 2020. “Overcoming Intrinsic Doxorubicin
Resistance in Melanoma by Anti-Angiogenic and Anti-
Metastatic Effects of Liposomal Prednisolone
Phosphate on Tumor Microenvironment.” International
Journal of Molecular Sciences 21 (8): 2968.
https://doi.org/10.3390/ijms21082968.
Maass, Fabian, Bernhard Michalke, Desiree Willkommen,
Andreas Leha, Claudia Schulte, Lars Tönges, Brit
Mollenhauer, et al. 2020. “Elemental Fingerprint:
Reassessment of a Cerebrospinal Fluid Biomarker for
Parkinson’s Disease.” Neurobiology of Disease 134
(February): 104677.
https://doi.org/10.1016/j.nbd.2019.104677.
Meder, David, Damian Marc Herz, James Benedict Rowe,
Stéphane Lehéricy, and Hartwig Roman Siebner. 2019.
“The Role of Dopamine in the Brain - Lessons Learned
from Parkinson’s Disease.” NeuroImage 190 (April):
79–93.
https://doi.org/10.1016/j.neuroimage.2018.11.021.
Meppelink, A. M., B. M. de Jong, R. Renken, K. L.
Leenders, F. W. Cornelissen, and T. van Laar. 2009.
“Impaired Visual Processing Preceding Image
Recognition in Parkinson’s Disease Patients with
Visual Hallucinations.” Brain 132 (11): 2980–93.
https://doi.org/10.1093/brain/awp223.
Nuvoli, Susanna, Angela Spanu, Mario Luca Fravolini,
Francesco Bianconi, Silvia Cascianelli, Giuseppe
Madeddu, and Barbara Palumbo. 2020. “[123I]
Metaiodobenzylguanidine (MIBG) Cardiac
Scintigraphy and Automated Classification Techniques
in Parkinsonian Disorders.” Molecular Imaging and
Biology 22 (3): 703–10.
https://doi.org/10.1007/s11307-019-01406-6.
Power, Jonathan D, Alexander L Cohen, Steven M Nelson,
Gagan S Wig, Kelly Anne Barnes, Jessica A Church,
Alecia C Vogel, et al. 2011. “Functional Network
Organization of the Human Brain.” Neuron 72 (4):
665–78. https://doi.org/10.1016/j.neuron.2011.09.006.
Qian, Long, Yi Zhang, Li Zheng, Xuemei Fu, Weiguo Liu,
Yuqing Shang, Yaoyu Zhang, et al. 2017. “Frequency
Specific Brain Networks in Parkinson’s Disease and
Comorbid Depression.” Brain Imaging and Behavior
11 (1): 224–39. https://doi.org/10.1007/s11682-016-
9514-9.
Sakar, Betul Erdogdu, M Erdem Isenkul, C Okan Sakar,
Ahmet Sertbas, Fikret Gurgen, Sakir Delil, Hulya
Apaydin, and Olcay Kursun. 2013. “Collection and
Analysis of a Parkinson Speech Dataset With Multiple
Classification of Parkinson’s Disease Using the Frequency-Specific Changes of Resting Brain Activity
147

Types of Sound Recordings.” IEEE Journal of
Biomedical and Health Informatics 17 (4): 828–34.
https://doi.org/10.1109/JBHI.2013.2245674.
Skidmore, F.M., M. Yang, L. Baxter, K.M. von Deneen, J.
Collingwood, G. He, K. White, et al. 2013. “Reliability
Analysis of the Resting State Can Sensitively and
Specifically Identify the Presence of Parkinson
Disease.” NeuroImage 75 (July): 249–61.
https://doi.org/10.1016/j.neuroimage.2011.06.056.
Song, Xiaopeng, Yi Zhang, and Yijun Liu. 2014.
“Frequency Specificity of Regional Homogeneity in
the Resting-State Human Brain.” Edited by Fa-Hsuan
Lin. PLoS ONE 9 (1): e86818.
https://doi.org/10.1371/journal.pone.0086818.
Spay, Charlotte, Garance Meyer, Marie-Laure Welter,
Brian Lau, Philippe Boulinguez, and Bénédicte
Ballanger. 2019. “Functional Imaging Correlates of
Akinesia in Parkinson’s Disease: Still Open Issues.”
NeuroImage: Clinical 21: 101644.
https://doi.org/10.1016/j.nicl.2018.101644.
Surmeier, Dalton James. 2018. “Determinants of
Dopaminergic Neuron Loss in Parkinson’s Disease.”
The FEBS Journal 285 (19): 3657–68.
https://doi.org/10.1111/febs.14607.
Thomas Yeo, B T, Fenna M Krienen, Jorge Sepulcre, Mert
R Sabuncu, Danial Lashkari, Marisa Hollinshead,
Joshua L Roffman, et al. 2011. “The Organization of
the Human Cerebral Cortex Estimated by Intrinsic
Functional Connectivity.” Journal of Neurophysiology
106 (3): 1125–65.
https://doi.org/10.1152/jn.00338.2011.
Thut, Gregor, Carlo Miniussi, and Joachim Gross. 2012.
“The Functional Importance of Rhythmic Activity in
the Brain.” Current Biology: CB 22 (16): R658--63.
https://doi.org/10.1016/j.cub.2012.06.061.
Tzourio-Mazoyer, N, B Landeau, D Papathanassiou, F
Crivello, O Etard, N Delcroix, B Mazoyer, and M
Joliot. 2002. “Automated Anatomical Labeling of
Activations in SPM Using a Macroscopic Anatomical
Parcellation of the MNI MRI Single-Subject Brain.”
NeuroImage 15 (1): 273–89.
https://doi.org/10.1006/nimg.2001.0978.
Tumati, S, S Martens, B M de Jong, and A Aleman. 2019.
“Lateral Parietal Cortex in the Generation of Behavior:
Implications for Apathy.” Progress in Neurobiology
175 (April): 20–34.
https://doi.org/10.1016/j.pneurobio.2018.12.003.
Váradi, Csaba, Károly Nehéz, Olivér Hornyák, Béla
Viskolcz, and Jonathan Bones. 2019. “Serum N-
Glycosylation in Parkinson’s Disease: A Novel
Approach for Potential Alterations.” Molecules 24
(12): 2220.
https://doi.org/10.3390/molecules24122220.
Vassar, Stefanie D, Yvette M Bordelon, Ron D Hays,
Natalie Diaz, Rebecca Rausch, Cherry Mao, and
Barbara G Vickrey. 2012. “Confirmatory Factor
Analysis of the Motor Unified Parkinson’s Disease
Rating Scale.” Parkinson’s Disease 2012: 1–10.
https://doi.org/10.1155/2012/719167.
Wiviott, Stephen D, Itamar Raz, Marc P Bonaca, Ofri
Mosenzon, Eri T Kato, Avivit Cahn, Michael G
Silverman, et al. 2019. “Dapagliflozin and
Cardiovascular Outcomes in Type 2 Diabetes.” New
England Journal of Medicine 380 (4): 347–57.
https://doi.org/10.1056/NEJMoa1812389.
Wahid, Ferdous, Rezaul K Begg, Chris J Hass, Saman
Halgamuge, and David C Ackland. 2015.
“Classification of Parkinson’s Disease Gait Using
Spatial-Temporal Gait Features.” IEEE Journal of
Biomedical and Health Informatics 19 (6): 1794–1802.
https://doi.org/10.1109/JBHI.2015.2450232.
Wang, Zhengxia, Xiaofeng Zhu, Ehsan Adeli, Yingying
Zhu, Feiping Nie, Brent Munsell, and Guorong Wu.
2017. “Multi-Modal Classification of
Neurodegenerative Disease by Progressive Graph-
Based Transductive Learning.” Medical Image
Analysis 39 (July): 218–30.
https://doi.org/10.1016/j.media.2017.05.003.
Wee, Chong-Yaw, Pew-Thian Yap, Kevin Denny, Jeffrey
N Browndyke, Guy G Potter, Kathleen A Welsh-
Bohmer, Lihong Wang, and Dinggang Shen. 2012.
“Resting-State Multi-Spectrum Functional
Connectivity Networks for Identification of MCI
Patients.” Edited by Yong He. PLoS ONE 7 (5):
e37828. https://doi.org/10.1371/journal.pone.0037828.
Xu, Ting, Zhi Yang, Lili Jiang, Xiu-Xia Xing, and Xi-Nian
Zuo. 2015. “A Connectome Computation System for
Discovery Science of Brain.” Science Bulletin 60 (1):
86–95. https://doi.org/10.1007/s11434-014-0698-3.
Yang, Hong, Xiang-Yu Long, Yihong Yang, Hao Yan,
Chao-Zhe Zhu, Xiang-Ping Zhou, Yu-Feng Zang, and
Qi-Yong Gong. 2007. “Amplitude of Low Frequency
Fluctuation within Visual Areas Revealed by Resting-
State Functional MRI.” NeuroImage 36 (1): 144–52.
https://doi.org/10.1016/j.neuroimage.2007.01.054.
ICBB 2022 - International Conference on Biotechnology and Biomedicine
148
