
Eight Sweet Cherry Cultivars Were Evaluated Based on Principal
Component Analysis
Xiaoli Ma
1,a
, Xuefeng Liu
1,b
, Pingwei Xiang
1,c
, Xiangcheng Yuan
1,d
, Mei Yang
1,e*
and Jian Liu
2,f
1
Chongqing Three Gorges Academy of Agricultural Sciences, Chongqing, China
2
The Agriculture and Rural Affairs Committee of Wuxi County, Chongqing, China
d
email: yxcheng226@163.com,
e
email: choumei2@163.com,
f
email: 18996559869@163.com
Keywords:
Sweet Cherry, Principal Component Analysis.
Abstract:
For comprehensive evaluation of eight varieties of sweet cherry introduced by WanZhou Chongqing, this
study selected the survival rate, stem diameter, roughness in new shoots, new tip length, the density of bud,
flower bud rate, leaf bud rate, density and fruit-set rate and other indicators, using principal component
analysis method to evaluate the adaptability of sweet cherry in high altitude mountainous area in Wanzhou
Chongqing. The results showed that Brooks was the best performer, Royamin the second, and Samitol the
worst. This indicates that the use of principal component analysis to evaluate sweet cherry varieties can be
used to rank the advantages and disadvantages of the experimental varieties in a concise way, and the scientific
research can eliminate the differences caused by different measurement indicators due to different dimensions,
which can reduce the systematic errors and improve the accuracy of the test.
1 INTRODUCTION
Sweet cherry (Prunus avium L.) is a subgenus of
Plum cherry in the Rosaceae family. It is very popular
among consumers because of its sweet taste and
crystal red appearance. At present, sweet cherry
planting in Chongqing is in a blind initial stage. Due
to inappropriate selection of varieties, most
production parks have the problem of only growing
trees without flowering, only flowering without
bearing fruit, and high fruit dropping rate despite
flowering and bearing fruit. (Sun, 2016) The main
way to solve these problems is to introduce sweet
cherry cultivars which have less demand for low
temperature according to the characteristics of short
accumulation time of low temperature in Chongqing,
carry out systematic variety adaptability research, and
screen out high-quality sweet cherry cultivars
suitable for the development of cold and cool areas at
this altitude in Chongqing. Therefore, eight sweet
cherry varieties, such as Brooks, Luyu, Rhoa plum,
Rhoa mine, Reed, Samitol, Sandra Rose and Santina,
were selected as test materials to carry out the
introduction experiment in Wanzhou high altitude
mountain area of Chongqing. The survival rate, stem
diameter, roughness in new shoots, new tip length,
the density of bud, flower bud rate, leaf bud rate,
density and fruit-set rate and other indicators of
introduced sweet cherry were evaluated by principal
component analysis. The aim of this study is to screen
out the suitable varieties for the high altitude
mountainous areas of Chongqing, so as to provide a
basis for the cultivation of tree species in the cold and
high altitude areas of Chongqing, and help the rural
revitalization industry.
2 MATERIALS AND METHODS
2.1 Research Materials
This experiment was conducted in Fengxiang village,
Luotian town, Wanzhou district. The test materials
included Brooks, Luyu, Rhoa plums, Rhoa min,
Reed, Samitol, Sandra Rose and Santina, and the
rootstock was Giesela 6, which was planted in 2019
and adopted root domain restriction cultivation. The
tree was super-fine spindle shaped and carefully
managed according to conventional methods.
14
Ma, X., Liu, X., Xiang, P., Yuan, X., Yang, M. and Liu, J.
Eight Sweet Cherry Cultivars Were Evaluated Based on Principal Component Analysis.
DOI: 10.5220/0012000600003625
In Proceedings of the 1st International Conference on Food Science and Biotechnology (FSB 2022), pages 14-17
ISBN: 978-989-758-638-5
Copyright
c
2023 by SCITEPRESS – Science and Technology Publications, Lda. Under CC license (CC BY-NC-ND 4.0)

2.2 Research Data Acquisition
In 2022, 10 plants of each variety were randomly
selected as samples and fixed at its base.
The survival rate (X1), The trunk diameter (X2),
shoot coarser (X3), shoot length (X4), shoot density
(X5), flower bud rate (X6), leaf bud rate (X7), flower
density (X8) and fruit setting rate (X9) were
statistically analyzed.
2.3 Study Data Analysis
Principal component analysis (PCA) is a multivariate
statistical analysis method which extracts several
independent new variables from the original variables
by linear combination. In the analysis process, some
principal components can be discarded, and only
several principal components with large variance
before and after can be taken to represent the original
variables, so as to reduce the workload of index
selection and calculation and avoid multiple common
problems among indicators (Zhu, 2006). In this study,
IBM SPSS Statistics 22 was used for the relevant
operations of principal component analysis, and the
calculation results were obtained and analyzed.
3 RESULTS
3.1 Standardized Processing of Data
SPSS was used to standardize and non-
dimensionalize the growth trait values of 8 sweet
cherry varieties, and the results are shown in Table 1.
3.2 Selection of Principal Component
Factors
PCA was performed to calculate principal component
eigenvalues, variance contribution rate and
cumulative contribution rate of growth traits of eight
sweet cherry cultivars after dimensionless
standardization. As can be seen from Table 2, the
eigenvalue of principal component 1 is 4.54, and the
variance contribution rate is 50.44%. The eigenvalue
of principal component 2 was 2.46, and the variance
contribution rate was 27.39%. The cumulative
variance contribution rate of principal components 1-
2 was 77.83%, which met the requirements of
principal component analysis, that is, the two
principal components represented nine traits of eight
sweet cherry varieties, so the two principal
components could be selected as comprehensive
evaluation indexes of sweet cherry traits.
Table 1: Normalized vectors of raw data of different indicators.
varieties
Survival
rate (X1)
The trunk
diameter
(
X2
)
Shoot
thickness
(
X3
)
Shoot
length
(
X4
)
Bud
density
(
X5
)
Flower
bud rate
(
X6
)
Leaf bud
percentage
(
X7
)
Flower
density
(
X8
)
Fruit setting
percentage
(
X9
)
Brooks
0.62 -0.61 1.70 0.89 2.12 0.77 -0.94 1.31 -0.06
Rhoa min
0.04 -0.55 -0.24 0.90 0.33 1.61 -1.53 0.43 -0.67
Rhoa plums
-2.38 -0.68 -0.70 -0.37 0.29 0.68 -0.57 0.49 -0.71
Santina
0.31 0.32 0.84 0.35 0.12 -0.29 0.32 1.11 -1.16
Reed
0.62 0.01 -0.57 0.57 -0.62 -0.65 0.72 -0.19 1.09
Samitol
-0.06 -0.83 -1.54 -1.94 -1.10 -0.37 0.37 -0.67 0.64
Luyu
0.62 2.25 0.19 0.50 -.72 -1.64 1.64 -1.41 1.60
Sandra Rose
0.23 0.09 0.33 -0.89 -0.42 -0.11 -0.02 -1.07 -0.73
Table 2: Variance contribution rate of growth traits of sweet cherry by principal component analysis.
composition
The initial ei
g
envalue Extract the sum of s
q
uares and loads
combined
Percentage of
variance
The cumulative
percentage
combined
Percentage of
variance
The cumulative
percentage
1 4.54 50.44 50.44 4.54 50.44 50.44
2 2.46 27.39 77.83 2.46 27.39 77.83
3 0.66 7.32 85.15
4 0.60 6.61 91.76
5 0.41 4.54 96.30
6 0.30 3.35 99.65
7 0.03 0.35 100.00
8 -3.30E-16 -3.66E-15 100.00
9 -6.98E-16 -7.75E-15 100.00
Eight Sweet Cherry Cultivars Were Evaluated Based on Principal Component Analysis
15
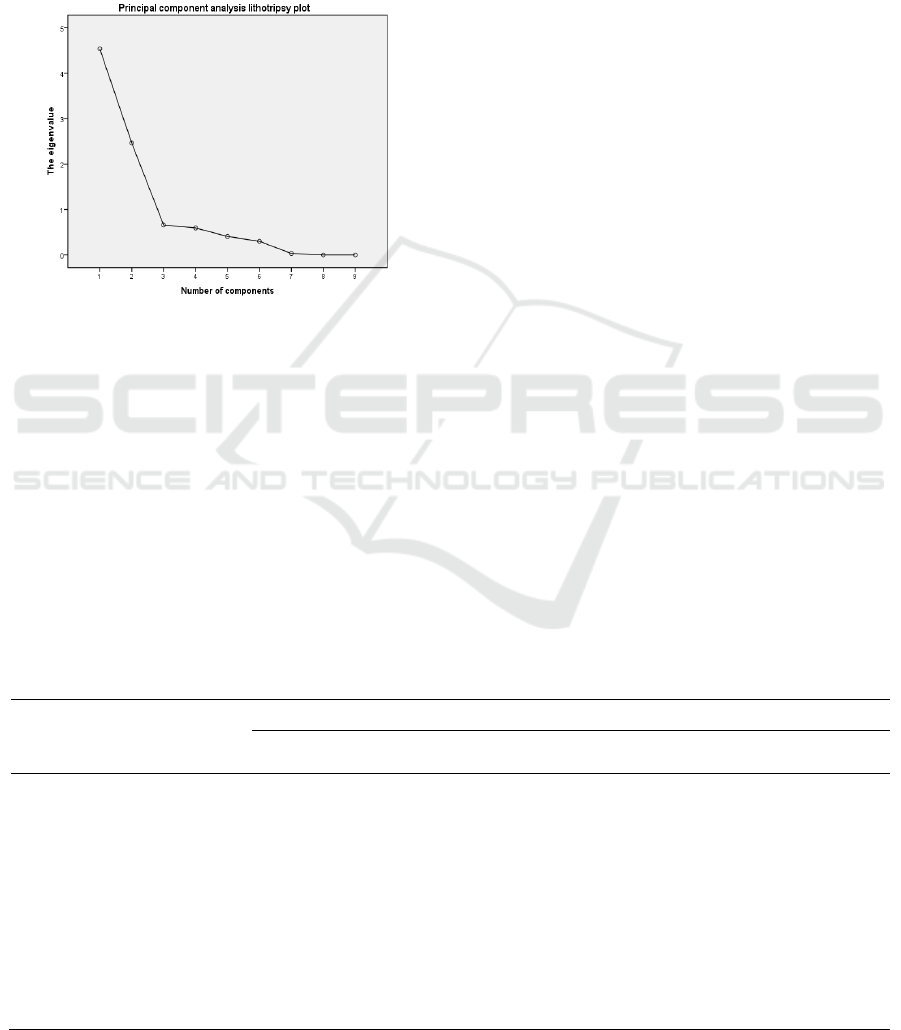
FIG. 1 is the crushed stone diagram of the
eigenvalues of different components. It can be seen
that the first factor has a high eigenvalue and makes
the largest contribution to the explanation of different
sweet cherry characters, while the third factor has a
small eigenvalue and makes negligible contribution
to the explanation of different sweet cherry
characters. Therefore, it is more appropriate to extract
two factors.
Figure 1: Lithotripsy diagram of eigenvalues of different
principal components.
The principal component loading matrix reflects
the relative magnitude and direction of action of each
trait on the principal component load, that is, the
degree of influence of the trait on the principal
component (Zhang, 2018). As shown in Table 3, the
first principal component mainly reflected the
characteristics of flower bud percentage, leaf bud
percentage, bud density, flower density, fruit setting
percentage and dry diameter. The second principal
component mainly reflected the survival rate, shoot
thickness and shoot length.
The coefficient of each factor in the principal
component expression can reflect the contribution of
the factor to the principal component. In PCA, it is
generally considered that the load greater than 0.3 is
significant. According to the eigenvectors of the
correlation matrix of sweet cherry traits in Table 3,
two principal component expressions can be written:
F1=-0.07X1-
0.15X2+0.09X3+0.08X4+0.18X5+0.20X6-
0.21X7+0.19X8-0.17X9
F2=0.27X1+0.23X2+0.34X3+0.32X4+0.19X5-
0.09X6+0.08X7+0.09X8+0.08X9
3.3 Comprehensive Evaluation of Sweet
Cherry Characters
The feature vectors in Table 3 were selected, and the
standardized data of traits of each variety were
brought into the expression to calculate the scores in
different components, and the model was established:
Z
comprehensive score
= 50.44Z
1
+ 27.39Z
2
, and the
comprehensive scores of different varieties were
obtained and sorted. The results are shown in Table 4.
It can be seen from Table 4 that in the first
principal component (mainly reflecting flower bud
rate, leaf bud rate, bud density, flower density, fruit
setting rate and dry diameter characters), the order
of each variety was: Brooks > Royamin > Roari >
Santis > Sandera rose > Red > Samitol > Luyu; In
the second principal component (survival rate of
main reaction, shoot thickness and shoot length),
the cultivars were ranked as: Brooks > Ruyu >
Santis > Reed > Roamin > Sandra rose > Roalee >
Samitol. The comprehensive scores of all traits
were: Brooks > Royamin > Santis > RoyALI >
Sandra ROSE > RED > LuYU > Samitol.
Table 3: Main component loading matrix and eigenvector of sweet cherry traits.
indicators
Load matrix The feature vectors
Principal
component 1
Principal
component 2
Principal
component 1
Principal
component 2
Survival rate(X1) -0.32 0.67 -0.07 0.27
The trunk diameter (X2) -0.70 0.57 -0.15 0.23
Shoot thickness (X3) 0.39 0.83 0.09 0.34
Shoot length (X4) 0.33 0.79 0.08 0.32
Bud density (X5) 0.82 0.46 0.18 0.19
Flower bud rate (X6) 0.92 -0.23 0.20 -0.09
Leaf bud percentage (X7) -0.93 0.18 -0.21 0.08
Flower density (X8) 0.86 0.21 0.19 0.09
Fruit setting percentage (X9) -0.76 0.20 -0.17 0.08
FSB 2022 - The International Conference on Food Science and Biotechnology
16

Table 4: Normalizes the eigenvectors.
varieties
Principal
component 1
The sorting
Principal
component 2
The
sorting
Principal
component
3
The
sorting
Brooks
1.26 1 1.24 1 97.74 1
Rhoa min
1.03 2 -0.13 5 48.25 2
Rhoa plums
0.70 3 -1.22 7 1.70 4
Santina
0.34 4 0.64 3 34.47 3
Reed
-0.66 6 0.23 4 -27.15 6
Samitol
-0.75 7 -1.50 8 -78.84 8
Luyu
-1.67 8 1.06 2 -54.99 7
Sandra Rose
-0.24 5 -0.31 6 -20.83 5
4 DISCUSSION
As a comprehensive analysis method, multivariate
statistical analysis method is often used to analyze the
statistical rules among the indicators when multiple
objects and multiple indicators are interrelated. It is
often used in crop variety resource evaluation and
genetic breeding. Song X. et al (Song, 2020) used
principal component analysis to screen out nitrogen
efficient wheat varieties. Fu Y. et al (Fu, 2022) used
principal component analysis to comprehensively
evaluate excellent varieties of blueberry. He W. et al
(He, 2021) used principal component analysis to
comprehensively evaluate 22 potato germplasm and
screened excellent germplasm resources.
In this study, the comprehensive scores of 8 sweet
cherry cultivars introduced to Chongqing were
obtained by principal component analysis, and the
suitable sweet cherry cultivars were screened out.
Principal component analysis: the first two
characteristics of the principal component values
greater than 1, and the cumulative contribution rate
was 77.83%, the most comprehensive sweet cherry
can indicators, comprehensive evaluation of 8
varieties of sweet cherry, comprehensive score results
for Brooks > Royamin > Santis > RoyALI > Sandra
ROSE > RED > LuYU > Samitol.
5 CONCLUSION
In this study, SPSS Statistics 22 software was used to
perform standardized value and PCA on the trait data
of eight sweet cherry varieties, and the principal
component assignment was sorted. Brooks had the
best performance, followed by Royamin and Samitol.
The PCA method was used to evaluate sweet cherry
varieties, and the data of different economic traits
were processed dimensionless and then calculated
with standardized values. The differences caused by
the different dimensions of different economic traits
were discarded, which could effectively reduce the
systematic errors and improve the accuracy of the
test.
REFERENCES
Fu, Y., Yang, Q., Wang, J. (2022) Comprehensive
evaluation of blueberry fine variety introduction test
based on principal component analysis. J. Anhui Agric.
Sci., 50(4):38-41
He, W., Zhang, W.F., Guo, S.Y., Yang, J.Y., Li, H.R., Liu,
L.J. (2021) Comprehensive Evaluation of 2 2 Potato
Germplasms Based on Principal Component Analysis
and Cluster Analysis. Seed, 40(3): 80-86.
Song, X., Zhang, K.K., Huang, C.C., Huang, S.M., Guo,
D.D., Yue, K., Zhang, S.Q. (2020) Selection of
Nitrogen-Efficient Wheat Varieties Based on Principal
Component Analysis. Journal of Henan Agricultural
Sciences, 49(12):10-16.
Sun, X.P., Luo, Y.J., Wang, W., Tan, M., Shi, W.J., Xie, Y.H.
(2016) Suggestions on selection of sweet cherry
cultivars for trial planting in Chongqing. Fruit trees in
south China, 45(5): 152-154
Zhu, J.P. (2006) Applied multivariate statistical analysis.
Beijing: Science Press
Zhang, T., Song, H.Y., He, P., Xu, P., Huang, X.Y., Tang,
X.H., Qin, Z.S., Wang, W.L., Zheng, S.F., Mo, Q.D.
(2018) Comprehensive evaluation of clausena indica
characters base principal component and cluster
analysis. Guizhou Agricultural sciences,46(11):9-14.
Eight Sweet Cherry Cultivars Were Evaluated Based on Principal Component Analysis
17
