
Modelling the Effects of Green Infrastructures on Water Quantity
Under Different Rainfall Characteristics
Qian Yu
1,2
, Xiaohe Du
1,2
, Na Li
1,2
, Yuting Meng
3
and Jing Wang
1,2
1
China Institute of Water Resources and Hydropower Research, Beijing, 100038, China
2
Research Center on Flood & Drought Disaster Reduction of the Ministry of Water Resources, Beijing, 100038, China
3
PowerChina Zhongnan Engineering Corporation Limited, Changsha, 410014, China
Keywords: Green Infrastructures, Water Quantity Control, Rainfall Characteristics, Pluvial Flooding.
Abstract: Under the dual impacts of climate change and rapid urbanization, urban pluvial flooding disasters in China
are increasingly serious, which cause huge economic losses and even serious casualties. Green infrastructure
(GI), a kind of resilient measure, can control rainfall runoffs and improve water quality. Modelling the effects
of GIs on controlling stormwater runoff under different rainfall characteristics plays an important role in
planning and designing GIs that are adapted to both local conditions and future climate change. In this paper,
we set nine rainfall scenarios with varying rainfall characteristics (intensity-duration-frequency, IDF) and
then study the effects of the combined GIs on water quantity in the Jinan pilot area. The results show that GIs
have good control effects on the inundation areas and runoff coefficients under rainfalls with small return
periods. With the increases in return periods and rainfall intensities, the control effects of GIs on inundation
areas decrease significantly. However, with the increases in rainfall intensities, the control effects on runoff
coefficients are not that obvious. In addition, rainfall duration variations have little impact on reducing rates
of controlling inundation areas and runoff coefficients.
1 INTRODUCTION
In the past few decades, China's urbanization
construction has developed rapidly. By the end of
2020, the urbanization rate in China has increased
from 17.9% in 1978 in the early stage of reform and
opening up to more than 60% (NBS, 2021), followed
by the increases in urban densities, changes in land
use and increases of the rate of surface
impermeability. However, the development of urban
flood control and drainage systems lags behind the
rate of urbanization, and rivers and lakes lose their
ability to regulate and store water. In addition, short-
term heavy rainfall events occur more frequently with
climate change (Min et al., 2011). Therefore, under
the dual pressures of urbanization developments and
climate change, the urban flooding problems in China
are increasingly severe. According to the China
Flood and Drought Disaster Bulletin, since 2008, an
average of 158 cities in China have experienced
fluvial or pluvial flooding, most of which is caused
by heavy rainfalls.
To simultaneously alleviate the urban flooding
problems and solve water environmental and
ecological problems, Sponge City Construction (SCC)
has been put forward in China since 2013 (Li et al.,
2017). A total of 30 national pilot cities have been
chosen to construct sponge cities. The core concept of
a sponge city is low impact development (LID) or in
other words green infrastructure (GI). LID/GI is a
kind of resilient practice, including grass swales,
bioretentions, green roofs, vegetated filter strips, etc.,
to reduce negative impacts caused by urbanization
(Ghodsi et al., 2016). GIs are designed to capture,
hold, and permeate urban runoff (Elliott et al., 2007),
and improve water quality. Previous studies have
revealed that the GIs are effective in controlling water
quantity under small to medium rainfalls (ATKINS,
2015; Yu et al., 2021). However, research on effects
of GIs on water quantity under different rainfall
characteristics, e.g., rainfall intensities and durations,
are rarely studied. According to the latest report
published by IPCC (IPCC, 2021), the frequency and
intensity of heavy precipitation events have increased
over the most land area since the 1950s. In recent
years, several heavy rainfall events have caused
serious economic loss and casualties, such as the
“7.21” storm in Beijing, in 2012, and the “7.20” storm
222
Yu, Q., Du, X., Li, N., Meng, Y. and Wang, J.
Modelling the Effects of Green Infrastructures on Water Quantity Under Different Rainfall Characteristics.
DOI: 10.5220/0011999400003536
In Proceedings of the 3rd Inter national Symposium on Water, Ecology and Environment (ISWEE 2022), pages 222-228
ISBN: 978-989-758-639-2; ISSN: 2975-9439
Copyright
c
2023 by SCITEPRESS – Science and Technology Publications, Lda. Under CC license (CC BY-NC-ND 4.0)
in Zhengzhou, in 2021. Hence, it is necessary to study
the effects of GI on water quantity under different
rainfall characteristics (intensity-duration-frequency,
IDF), which will provide more practical experiences
and technical support for the SCC under future
climate changes.
Given the above considerations, the present study
employed the Flood Risk Analysis Software (FRAS),
independently developed by the China Institute of
Water Resources and Hydropower Research, to
model and analyse the effects of GIs on water
quantity under different rainfall characteristics.
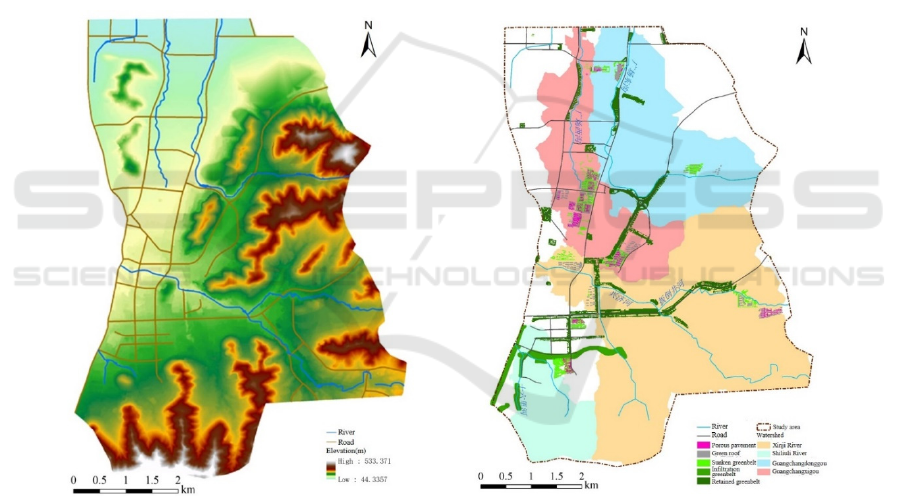
2 STUDY AREA
Jinan, one of the first batch of pilot SCC cities, is
located in the east of China with an average annual
rainfall of 672.8mm. Our study area is located in the
main urban areas of Jinan with a total area of about
39km
2
. The overall terrain of the study area is higher
in the south, lower in the north, higher in the east, and
lower in the west (see Figure 1 left). Rainstorms in
the summer result in serious flood disasters. The
eastern and southern regions are mountainous areas,
and the central area is the piedmont slope. There are
four small watersheds within the study area, including
Guangchangxigou, Guangchangdonggou, Xingji
River, and Shiliuli River (see Figure 1 right).
According to the Implementation Plan of Sponge
City Construction Pilot Project in Jinan, Shandong
Province (2015-2017) (hereinafter referred to as the
implementation plan). Five kinds of GIs are designed
within the study area: green roofs (0.26km
2
), sunken
greenbelt (0.31km
2
), retained greenbelt (1.32km
2
),
intensified infiltration greenbelt (0.46km
2
), and
permeable pavement (0.18km
2
) (see Figure 1 right).
Figure 1: Topography (left) and distributions of GIs (right).
3 DATA AND METHODS
3.1 Data
The following basic geographic data is used for
scenario modelling: 1:2000 DLG data and 1:1000000
soil data (1995). DLG data includes roads, residential
areas, and land use data. The aforementioned data are
adopting CGCS2000 coordinate system, Gauss
Kruger projection, and the coordinate unit is a meter.
The 1985 national elevation datum is adopted.
In addition, the following hydrological and
meteorological data are also collected: the river
systems and the main cross-section data, the
monitoring precipitation data at Guishan, Xinglong,
and other precipitation stations and hydrological
stations, and the design storm data as well, including
5-year return period, 10-year return period and 20-
year return period. Furthermore, data on drainage
systems are also collected. At present, the drainage
Modelling the Effects of Green Infrastructures on Water Quantity Under Different Rainfall Characteristics
223
pipe network within the study area is designed
according to the standard of 2-year or 3-year return
period.
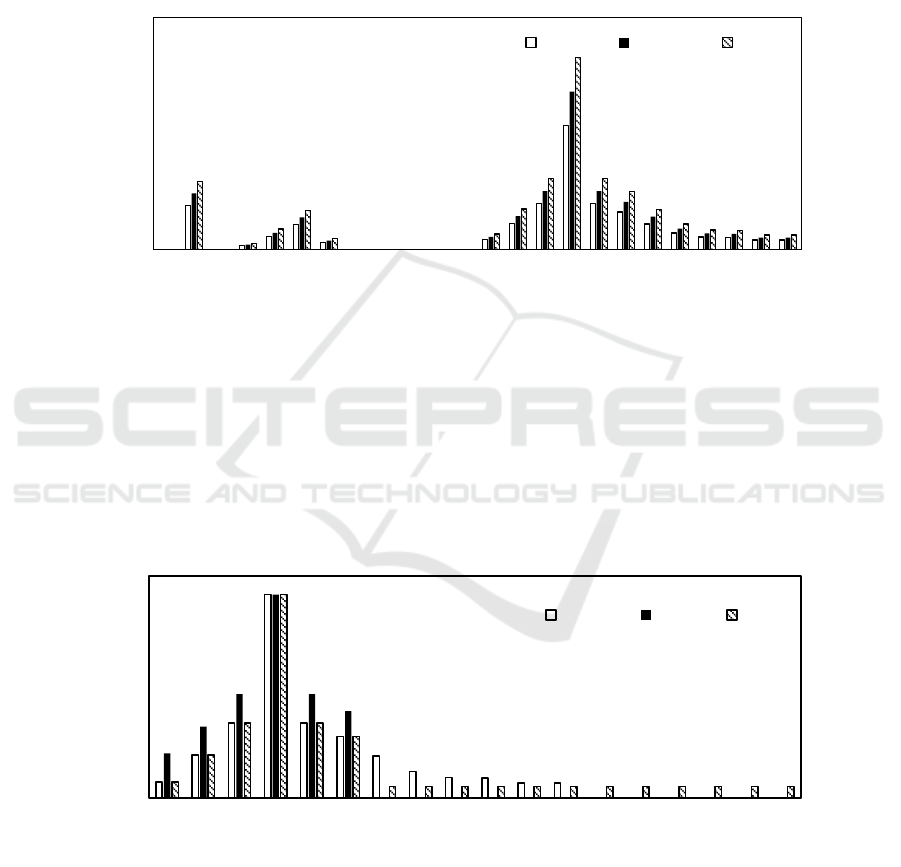
3.2 Rainfall Scenarios
3.2.1 Rainfall Frequency
In this study, the return period is used to represent the
frequency. Three rainfall frequency scenarios (see
Figure 2) based on typical rainfall processes are set
for modelling: 5-year return period, 10-year return
period and 20-year return period.
Figure 2: The 24h design rainfall process under three different rainfall frequency scenarios.
3.2.2 Rainfall Duration
According to the actual conditions of Jinan city, the
inundation within the study area after rainfall events
is usually drained within 3~6h. Based on the usual 5-
year, 24-hour rainfall process in Jinan, we design
three possible scenarios for rainfall duration. As the
rainfall-runoff at the early stage (2~7h) is usually
drained within the first 12h (see Figure 2). Therefore,
we selected the last 12h continuous rainfall process
with a rainfall volume of 96.84 mm (see Figure 2).
The three rainfall duration scenarios are shown in
Figure 3.
Figure 3: 24h design rainfall process under 3 different rainfall duration scenarios.
3.2.3 Rainfall Intensity
Based on the short-duration rainstorm intensity
formula in Jinan (see equation 1), the design
rainstorm intensity with different return periods is
calculated.
0
10
20
30
40
50
60
123456789101112131415161718192021222324
Rainfall volume (mm)
Time (h)
5 year 10 year 20 year
0
5
10
15
20
25
30
35
123456789101112131415161718
Rianfall volume (mm)
Time (h)
12h 6h 18h
ISWEE 2022 - International Symposium on Water, Ecology and Environment
224
()
()
0.9973
35.0185 1 1.6868lg
27.7543
T
i
t
+
=
+
(1)
Where i is rainfall intensity, mm/min, T is the return
period, a, t is rainfall duration, min. The design
rainfall intensity under different return periods is
shown in Table 1.
Table 1: Design rainfall intensity.
Return period
(a)
Duration
(180min)
i (mm/min)
1 180 0.171
2 180 0.258
5 180 0.373
10 180 0.459
20 180 0.546
50 180 0.661
100 180 0.748
200 180 0.835
On "7.18", 2007 in Jinan, an extreme rainfall
event caused huge economic loss and serious
casualties. Hence, we select the heaviest 3h process
(16:00-18:00) of the natural rainstorm at the rainfall
station of the flood control office of Shizhong District
on “7.18” as the typical rainfall process. The rainfall
volume of 3h was 142.3mm. We set three different
rainfall intensity scenarios (see Figure 4).
Figure 4: The 24h design rainfall process under three different rainfall intensity scenarios.
3.3 Hydro-Hydraulic Model
FRAS is used to simulate the inundation areas under
different rainfall characteristics. FRAS is an
integrated software that can simulate the whole flood
process, mainly including 1D-2D coupling hydraulic
model, hydrological model, and drainage model (Li
et al., 2018). The hydraulic model can simulate the
surface flow well, including flow simulations in wide
or narrow rivers and the flow spreading along streets.
In this software, the 1D hydraulic model is coupled
with the 2D hydraulic model by calculating the flow
exchanges between the passage and grids on both
sides. The SCS-CN model is selected in this research
to simulate the runoff production. In addition, the
equivalent pipe network model is used to simulate
underground drainage.
A total of 26659 irregular grids are divided with
an average grid area of 1500m
2
(38m×38m). The
rivers and roads are set as special passages. The
roughness coefficients are set according to the soil
types. Four kinds of GIs are modified by changing
parameters, i.e., elevations, roughness, and values of
CN (see table 2). Retained greenbelt is also
considered an intensified infiltration greenbelt.
The calibration and validation details of the model
can be found in our previous paper (Li et al., 2018),
which is then not elaborated in this paper.
0
10
20
30
40
50
60
123
Rainfall volume (mm)
Time (h)
5 year 10 year 20 year
Modelling the Effects of Green Infrastructures on Water Quantity Under Different Rainfall Characteristics
225
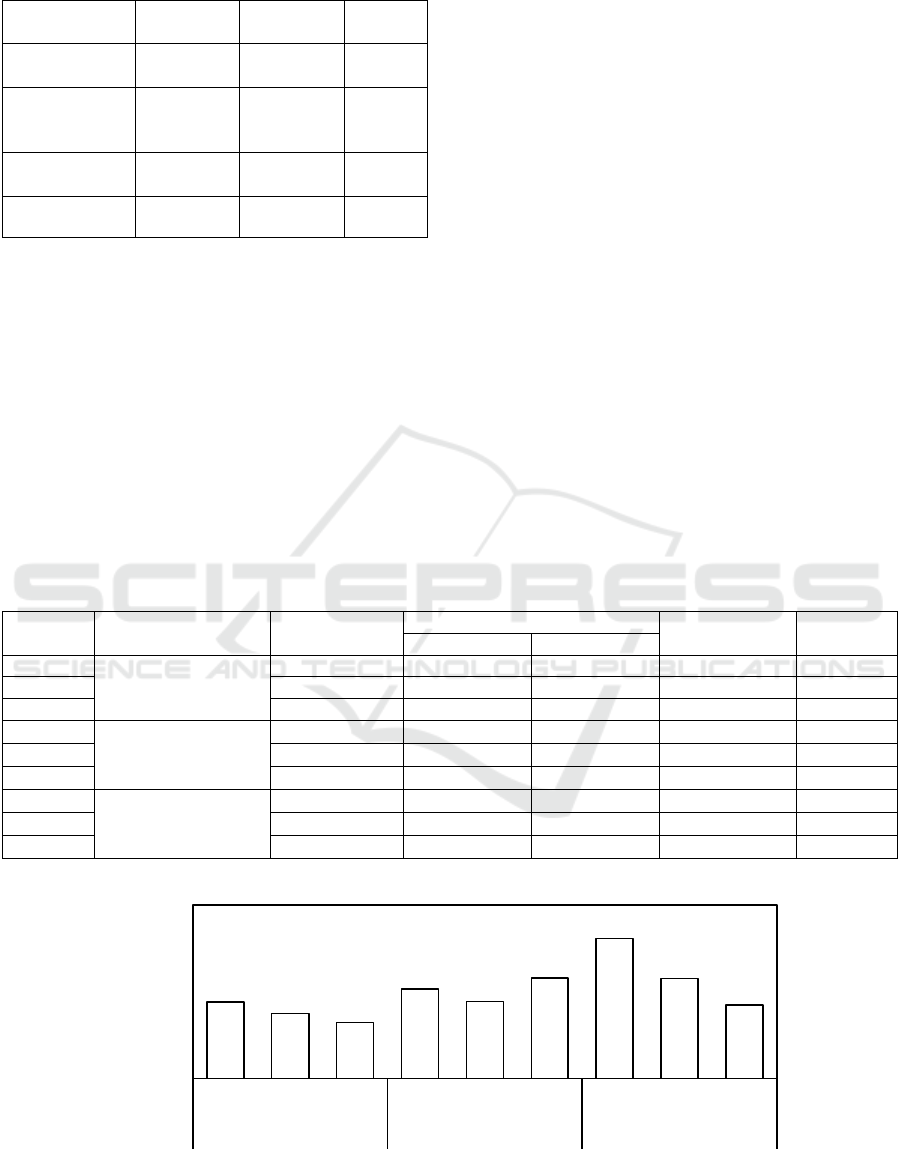
Table 2: Parameters used for GIs in the FRAS model.
Measures Elevation Roughness
Value
of CN
Sunken
g
reenbelt
Lower
20c
m
0.06 61
Increased
infiltration
greenbelt
Unchanged 0.06 39
Porous
p
avement
Unchanged 0.035 66
Green roof Unchanged 0.07 61
4 RESULTS AND DISCUSSION
4.1 Effects of GIs on Inundation Areas
under Different Rainfall
Characteristics
Table 3 and Figure 5 show the effects of the
implementation of GIs on inundation areas under
different rainfall characteristics. The results show that
the inundation areas are reduced after the
implementation of GIs under different rainfall
frequency-duration-intensity, which suggests that GIs
have control effects on reducing the inundation areas
to some extent. In addition, GIs have the most
obvious control effect under 5-year events. With the
increases of rainfall volumes varying with the return
periods, the control effects of inundation areas
decrease. Moreover, with the increases of rainfall
intensities, the reduction rate of controlling
inundation areas decreases as well. Compared to the
obvious impacts of rainfall return periods and
intensity on the control effects, rainfall duration
variations have little effect on the reduction rates of
controlling inundation areas. The simulation results
are consistent with the field observations conducted
by Carpenter and Kaluvakolanu (2010) and Lewellyn
et al. (2015). In fact, grey infrastructures play a more
important role in controlling urban pluvial flooding.
GIs can help grey infrastructures control rainfall
runoff at the sources. Although the relatively weak
control effects compared to grey infrastructures, GIs
have more comprehensive benefits, such as
improving surface water quality and enhancing public
awareness on water security, which is very important
in view of many water problems facing to urban areas
(Yu et al., 2020).
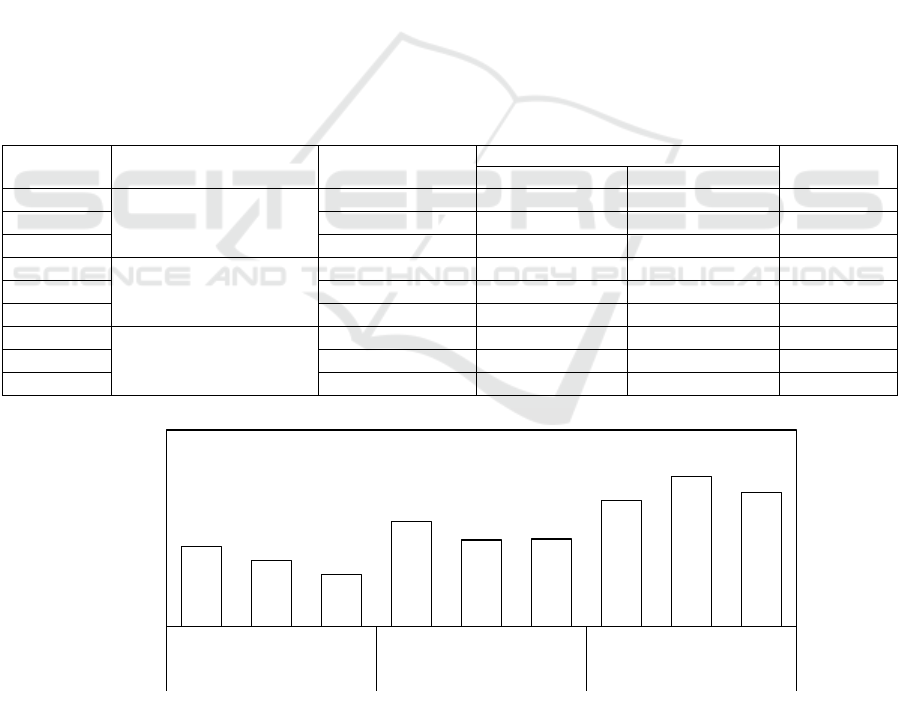
Table 3: Effects on inundation areas under different rainfall characteristics.
No. Rainfall characteristics Scenarios
Inundation area (km
2
)
Reduction
(km
2
)
Reduction
ratio (%)
Before Afte
r
1
Frequency
5 yea
r
2.003 1.782 0.221 11.02
2 10
y
ea
r
3.000 2.720 0.279 9.32
3 20
y
ea
r
3.927 3.613 0.315 8.02
4
Duration
6h
1.823 1.588 0.235
12.89
5
12h
1.241 1.104 0.137
11.08
6
18h
1.303 1.114 0.189
14.47
7
Intensity
5 year
1.176 0.939 0.237
20.14
8
10 year
1.919 1.643 0.276
14.37
9
20 year
2.797 2.501 0.296
10.58
Figure 5: Reduction ratios of inundation areas under different rainfall characteristics.
11,02
9,32
8,02
12,89
11,08
14,47
20,14
14,37
10,58
0
5
10
15
20
25
5 year 10 year 20 year 6h 12h 18h 5 year 10 year 20 year
Frequency Duration Intensity
Reduction ratio (%)
ISWEE 2022 - International Symposium on Water, Ecology and Environment
226
4.2 Effects of GIs on Comprehensive
Runoff Coefficients under Different
Rainfall Characteristics
Table 4 and Figure 6 show the effects of GIs on runoff
coefficient control under different rainfall
characteristics. The results show that the runoff
coefficients after the implementation of GIs are
smaller than those before the implementation under
different rainfall characteristic scenarios, which
means that GI can control rainfall runoffs. In addition,
with the increases of rainfall return periods, rainfall
intensities and durations, the corresponding runoff
control coefficients of GIs decrease. The simulation
results are consistent with the field investigations
conducted by Carpenter and Kaluvakolanu (2010).
They found that the average runoff coefficient on
green roofs is 0.044 under small rainfalls (<12.7 mm),
0.131 under middle rainfalls (12.7~25.4mm), and
0.591 under heavy rainfalls (>25.4mm), based on 21
rainfall events. According to the study of US EPA
(2015), the LID and related measures can only reduce
rainfall runoffs with 12.7~50.8 mm. With regard to
rainfall intensity, the heavier the rainfall is, the more
prone to generate runoffs. Lewellyn et al. (2015)
found that the study area generated runoffs even
though the total rainfall volume did not reach the
design storage volume.
With the increases of rainfall return periods, the
reduction ratios of control effects decrease obviously.
The reduction ratios of control effects under 5-year
and 20-year events are 10.148% and 6.611%,
respectively. The simulation results are consistent
with Yin et al. (2021), which found that the runoff
control rate is 98.1% under a small rainfall (<10 mm),
73.8% under a middle rainfall (10~15 mm) and 52.9%
under a heavy rainfall (>25 mm), respectively.
However, compared to the obvious control effects on
runoff coefficients with the increases of return
periods, the reduction ratios of control effects are not
that obvious with the increases of rainfall intensities
and durations. Yin et al. (2021) also observed that the
control effects of rainfall durations on control effects
are not obvious.
Table 4: Effects on runoff coefficient under different rainfall characteristics.
No. Rainfall characteristics Scenarios
Runoff coefficient
Reduction ratio
(%)
Before Afte
r
1
Frequency
5 years
0.517 0.465 10.148
2
10 years
0.559 0.512 8.406
3
20 years
0.578 0.540 6.611
4
Duration
6h
0.372 0.323 13.364
5
12h
0.453 0.403 10.977
6
18h
0.460 0.409 11.135
7
Intensity
5 years
0.281 0.236 16.053
8
10 years
0.319 0.258 19.082
9
20 years
0.350 0.291 17.066
Figure 6: Reduction ratio of runoff coefficient under different rainfall characteristics.
10,148
8,406
6,611
13,364
10,977
11,135
16,053
19,082
17,066
0
5
10
15
20
25
5 year 10 year 20 year 6h 12h 18h 5 year 10 year 20 year
Frequency Duration Intensity
Reduction ratio (%)
Modelling the Effects of Green Infrastructures on Water Quantity Under Different Rainfall Characteristics
227

5 CONCLUSIONS
Hydrological performances of combined GIs under
nine rainfall scenarios are modeled using FRAS. The
results showed that GIs have good control effects on
water quantity in the study area under rainfalls with
small return periods. As the rainfall volumes grow
with the return periods, the control effects of GIs on
inundation areas and runoff coefficients decrease
significantly. In addition, with the increases in rainfall
intensities, the control effects on inundation areas
decrease obviously. However, the reduction ratios of
GIs on controlling runoff coefficients are not that
obvious with the increases in rainfall intensity. The
rainfall duration variations have little impact on the
reduction ratios of controlling rainfall runoffs.
GIs can design and accompany grey
infrastructures, such as deep tunnels and drainage
pipe networks, together to control rainfall runoffs
effectively. In order to provide technical assistance
for GIs to better adapt to climate change and improve
urban resilience, more studies should be conducted to
examine the control impacts of combined green and
gray infrastructures on rainwater runoff under future
climate change scenarios.
ACKNOWLEDGEMENTS
This work was supported by the National Natural
Science Foundation of China [No. 51909273] and
Talent Innovation Team for the Strategic Research on
Flood and Drought Disaster Prevention of the
Ministry of Water Resources [No.
WH0145B042021].
REFERENCES
National Bureau of Statistics 2021 Statistical bulletin of the
People's Republic of China on national economic and
social development in 2020
Min S K, Zhang X, Zwiers F W, et al 2011 Human
contribution to more-intense precipitation extremes.
Nature, 470(7334) 378-381.
Li H, Ding L Q, Ren M L, et al. 2017 Sponge city
construction in China: a survey of the challenges and
opportunities. Water, 9(9), 594.
Ghodsi S H, Kerachian R, Zahmatkesh Z. 2016 A multi-
stakeholder framework for urban runoff quality
management: application of social choice and
bargaining techniques. Sci. Total Environ. 500 574-
585.
Elliott A H, Trowsdale S A 2007 A review of models for
low impact urban stormwater drainage. Environ.
Modell. Softw. 22(3) 394-405.
ATKINS 2015 Flood loss avoidance benefits of green
infrastructure for stormwater management. Maryland.
Yu Q, Li N 2021 Research Progress and Perspective of
Effects of Low Impact Development on Rainfall Runoff
Reduction under Different Rainfall Characteristics.
Water Resources and Power, 39(08), 18-21+9. (in
Chinese)
IPCC, 2021. Summary for Policymakers. In: Climate
Change 2021: The Physical Science Basis. Contribution
of Working Group I to the Sixth Assessment Report of
the Intergovernmental Panel on Climate Change
[Masson-Delmotte, V., P. et al (eds.)]. (Cambridge
University Press. In Press)
Li N, Meng Y T, Wang J, et al 2018 Effect of low impact
development measures on inundation reduction-Taking
Jinan pilot area as example. Journal of Hydraulic
Engineering. 49(12) 1489-1502. (in Chinese)
Carpenter D D, Kaluvakolanu P 2010 Effect of roof surface
type on storm-water runoff from full-scale roofs in a
temperate climate. J. Irrig. Drain. E-ASCE, 137(3) 161-
169.
Lewellyn C, Lyons C E, Traver R G, et al. 2015 Evaluation
of seasonal and large storm runoff volume capture of an
infiltration green infrastructure system. J. Hydrol. Eng.,
21(1) 04015047.
Yu Q, Li N, Wang S, et al. 2020 Study on comprehensive
benefit assessment systems for low impact
development practices. Journal of Hydroelectric
Engineering. 39(12), 94-103. (in Chinese)
Yin D K, Chen Z X, Li Q. et al. 2021 Influence of rainfall
characteristics on runoff control of a sponge
reconstructed community in a rainy city. Journal of
Tsinghua University (Science and Technology). 61(01)
50-56. (in Chinese)
ISWEE 2022 - International Symposium on Water, Ecology and Environment
228
