
Artificial Intelligence as a Tool to Support Students’ Bachelor’s
Degree and Vocational Training Choices
Aitor Moreno-Fernandez-de-Leceta
1a
, Nagore Ipiña
2b
, Koldo Diaz
2 c
, Ane Zubizarreta
2 d
,
Victor Gonzalez
1
and Leire Ezquerro
3
1
Artificial Intelligence Department (Ibermatica Innovation Institute i3b). Avenida de los Huetos,
75, Edificio Azucarera, 01010 Vitoria-Gasteiz, Spain
2
Mondragon University (Faculty of Humanities and Education), Spain
3
Department of Education of the Basque Government, Vitoria-Gasteiz, Spain
Keywords: Artificial Intelligence, Education, Segmentation, Hierarchical Clustering, BigData.
Abstract: Artificial Intelligence (AI) has great potential for supporting students in their Bachelor’s degree choices.
Studies have found that AI and big data in education may provide more effective monitoring and support in
real time. In this paper, we present the findings of a study carried out to create a model to support students in
their choices after compulsory education and match them with business needs. The study was conducted in
two phases. First, in an experimental study, 528 participants from secondary education in Spain filled in a
159-item questionnaire that identified their main interests and matched them with business needs. Second, an
algorithmic supportive model based on AI was created in order to offer schools and students the opportunity
to obtain extra data to help them choose their Bachelor’s degree or vocational training program with reference
to business needs. This paper presents the results from each of these phases, which show that AI and big data
may be useful to provide students, parents and teachers with extra data to justify the students’ choices.
However, it is necessary to empower educational agents to understand both the potential and and the risks of
AI and big data.
1 INTRODUCTION
Interest has been increasing every year in the
application of Artificial Intelligence (AI) in
education, which has undergone significant
development over the last twenty-five years (Roll,
2016). Along these lines, educators and researchers
are working on how to apply AI techniques such as
deep learning and data mining to complex educational
issues and the personalization of individual learning
processes (Chen, 2020). (Berendt, 2020) present AI
based on the definition given by the Encyclopedia
Britannica as “the ability of a digital computer or
computer-controlled robot to perform tasks
commonly associated with intelligent beings.”
(Chassignol, 2018) adds the idea that AI is dedicated
to solving cognitive problems commonly associated
with human intelligence, such as learning, problem-
a
https://orcid.org/0000-0003-0556-4457
b
https://orcid.org/0000-0002-9080-0540
c
https://orcid.org/0000-0003-3490-2320
d
https://orcid.org/0000-0001-9880-6050
solving, and pattern recognition. Regarding
education, (Berendt, 2020) note that AI is considered
to be a “way to improve education in ways that offer
more personalized, flexible, inclusive and engaging
learning.”
Through machine learning and data mining
techniques, AI is able to structure and analyze large
data sets and reveal patterns and trends to derive
predictions (Berendt, 2020), and this can also be done
in educational settings. Recently, AI has been used in
education to develop predictive models of student
dropout (Lee, 2019), predict students’ grades
(Adekitan, 2019), create dashboards and visual
dashboards to show learner progression on learning
paths (Rienties, 2018), establish recommendation
systems to help students (Ipiña, 2016), provide instant
feedback to students (Cope, 2020), create adaptive
systems to personalize learning paths (Chen, 2020),
558
Moreno-Fernandez-de-Leceta, A., IpiÃ
´
sa, N., Diaz, K., Zubizarreta, A., Gonzalez, V. and Ezquerro, L.
Artificial Intelligence as a Tool to Support Studentsâ
˘
A
´
Z Bachelorâ
˘
A
´
Zs Degree and Vocational Training Choices.
DOI: 10.5220/0011960900003612
In Proceedings of the 3rd International Symposium on Automation, Information and Computing (ISAIC 2022), pages 558-565
ISBN: 978-989-758-622-4; ISSN: 2975-9463
Copyright
c
2023 by SCITEPRESS – Science and Technology Publications, Lda. Under CC license (CC BY-NC-ND 4.0)

and link performance with university programs or job
applications (Berendt, 2017), among other things.
This article examines the potential of AI in
educational systems as a tool to support students’
future Bachelor’s degree or vocational training
choices and match them with business needs. The
article is structured as follows: in Section 2, we
discuss the potential of the use of AI in education. In
Section 3, we describe an experimental study carried
out to create an algorithmic supportive model. In
Section 4, we discuss the creation of a prescriptive
model. In Section 5, we offer some recommendations
on how schools and educational communities might
use the model created, and explore issues associated
with the use of AI in education.
2 POTENTIAL OF AI IN
EDUCATION: USING DATA TO
SUPPORT CHOICES
This section explores the advantages and
potentialities of using big data analysis in the process
of aligning students’ interests with their Bachelor’s
degree or vocational training choices. In particular,
the present section analyses how big data can help
students to address existent mismatches and hence,
support them in their choices. Indeed, (Pérez, 2019)
state that 20.4% of students drop out or change their
bachelor’s degree program in their first university
year. This highlights the need to conduct studies in
this area.
As is well known, information and
communication technology (ICT)-related innovations
have fostered the creation of new types of data. Along
these lines, big data can offer new information on
students’ learning processes and therefore can help
increase students’ performance in their academic
development. Moreover, those data can be interpreted
for the purpose of aligning educational programs to
better prepare students for their future, making it
possible to personalize each student’s learning path.
Furthermore, as (Berendt, 2020), point out, a fine-
grained analysis of big data can support students,
families and educators in their decision-making
processes.
An important goal of education is to prepare
students for the labor market. Thus, several studies
have been carried out in higher education with an eye
to aligning students’ skills with trends driven by the
labor market. In a report prepared for the European
Union, (Berendt, 2017) conclude that big data
analytics can reveal training needs more accurately
and therefore, fix the gap between higher education
training and labor market needs. However, as the
authors point out, a new approach toward partnership
will be required to better understand and continuously
monitor the respective contributions of the labor
market and educational institutions. Other studies
conducted in the field (Chen, 2020) have also shown
that AI learning systems can improve learning
capabilities that could fit labor market needs. The
analysis concludes that AI systems can always be
adapted to offer aid to students. Therefore, AI
systems can offer extra help to students in their
processes.
Nevertheless, to the best of our knowledge, very
few studies have analyzed secondary students’
interests by means of big data to support their future
choices and match them with business needs. Big data
analysis in secondary education has been limited to
assessing students’ performance in relation to the
established educational program or to offering
learning personalization options. Indeed, as
(Kurilovas, 2018) states, the personalization of
learning objects and activities has become very
popular in recent years and the use of learners’
profiles (including prior knowledge, intellectual
level, interests, goals, cognitive traits, learning
behavior, learning styles models) is recognized to be
effective. Thus, as (Berendt, 2017) claim, it is
necessary to inform students about their interests and
competences so that they may frame their choices
better. In fact, examining how students make these
decisions has important consequences. (Baker, 2017)
assert that students often receive little guidance on
how to make such decisions, and most schools do not
offer the necessary structure to help in the decision-
making process.
Thus, building students’ profiles and grouping
and clustering them according to their learning
characteristics through algorithms can identify
different types of learners, and educational
opportunities could be adapted to their needs (Li,
2018). However, the development of a big data
infrastructure and analytics solutions to connect
Bachelor’s degree and vocational training options
with educational programs requires complex and
costly big data techniques and analysis tools. The aim
of the present study was to develop a supportive
model based on big data that can guide students in
their Bachelor’s degree and vocational training
choices and match their decisions with business
needs.
Artificial Intelligence as a Tool to Support Studentsâ
˘
A
´
Z Bachelorâ
˘
A
´
Zs Degree and Vocational Training Choices
559
3 CREATION OF THE
UNSUPERVISED
ALGORITHMIC MODEL
An experimental study was carried out to create an
algorithmic supportive model. This study included
528 participants from secondary education in Spain,
who first completed a 159-item questionnaire
designed to identify students’ interests based on the
Bachelor’s degrees and vocational training programs
offered in the Spanish province of Gipuzkoa. The
questionnaire was created by a group of experts and
corroborated by means of semi-structured interviews
carried out with 16 professionals in five knowledge
areas (arts and humanities, science, health science,
technical engineering, and legal science). The
questionnaire was delivered online and was
completed by 528 students, of whom 421 gave their
consent to use their information. Data quality was
analyzed statistically before defining the model; all
participants answered all the questions, the 159
variables were consistent, and no outliers were found.
Consequently, the gathered data were considered
consistent and valid. In a subsequent step, the data
were enriched by sociodemographic variables such as
unemployment rates, and contextual variables.
Sociodemographic data obtained from different
OpenData sources were added to the questionnaire
dataset (Figure 1), specifically, according to the
postal code of the center, including data referring to
the business and industrial concentration of the
education center area, data referring to the job offer
rate, and data regarding the unemployment rate in
recent years in the area.
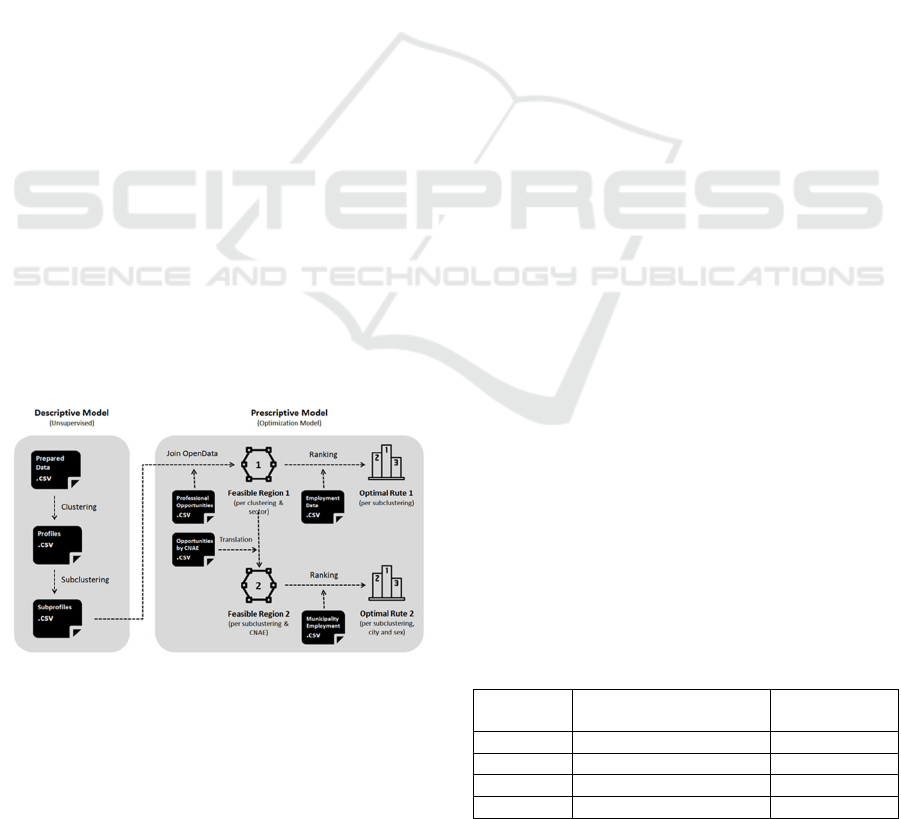
Figure 1. Internal and External data processing in the
project. CNAE, National Classification of Economic
Activities (Clasificación Nacional de Actividades
Económicas).
The main idea was to obtain in an unsupervised and
automatic way the different groups into which the
students were triangulated with respect to their
answers on the survey. Note that we have not
identified the students in any a priori way, and one of
the important objectives of the project was to
characterize sets of students within homogeneous
groups large enough to be able to generate general
recommendation rules per group, but specific enough
for those rules to be efficient at the level of
personalization of the recommendations.
Four segmentation algorithm methods were
executed in each profiling:
Kmeans (KM): a centroid-based clustering
method that works when clusters have similar
sizes and are locally and isotropically
distributed around their centroid. Euclidean
distances are used in the similarity search
function.
AffinityPropagation (AP): a relatively new
clustering algorithm that operates by
simultaneously considering all data points as
potential exemplars and exchanging messages
between data points until a good set of
exemplars and clusters emerges.
AgglomerativeClustering (AC): the most
common type of hierarchical clustering used to
group objects in clusters based on their
similarity. It is also known as Agglomerative
Nesting (AGNES). The algorithm starts by
treating each object as a singleton cluster. Next,
pairs of clusters are successively merged until
all clusters have been merged into one big
cluster containing all objects. The result is a
tree-based representation of the objects, called
a dendrogram.
GaussianMixture (GM): this algorithm can be
viewed as an extension of the ideas behind k-
means, but it can also be a powerful tool for
estimation beyond simple clustering.
When generating the models, all of these algorithms
were applied to the enriched data set. In order to
evaluate the results, the following statistics were
used: Gini, Silhouette, Calinski-Harabasz, and
Davies-Bouldin. Table 1 shows the results of the
different algorithms evaluated by different statistical
metrics.
Table 1. Clustering methods and evaluation.
Clustering
Metho
d
Statistical Criterion Statistical
Validation
KM Gini 0.85
Silhouette 0.09
Calinski-Harabasz 0.58
Davies-Bouldin 0.29
ISAIC 2022 - International Symposium on Automation, Information and Computing
560
AP Gini 0.93
Silhouette 0.03
Calinski-Harabasz 0.15
Davies-Bouldin 0.26
AC Gini 0.83
Silhouette 0.08
Calinski-Harabasz 0.47
Davies-Bouldin 0.30
GM Gini 0.97
Silhouette 0.09
Calinski-Harabasz 0.58
Davies-Bouldin 0.30
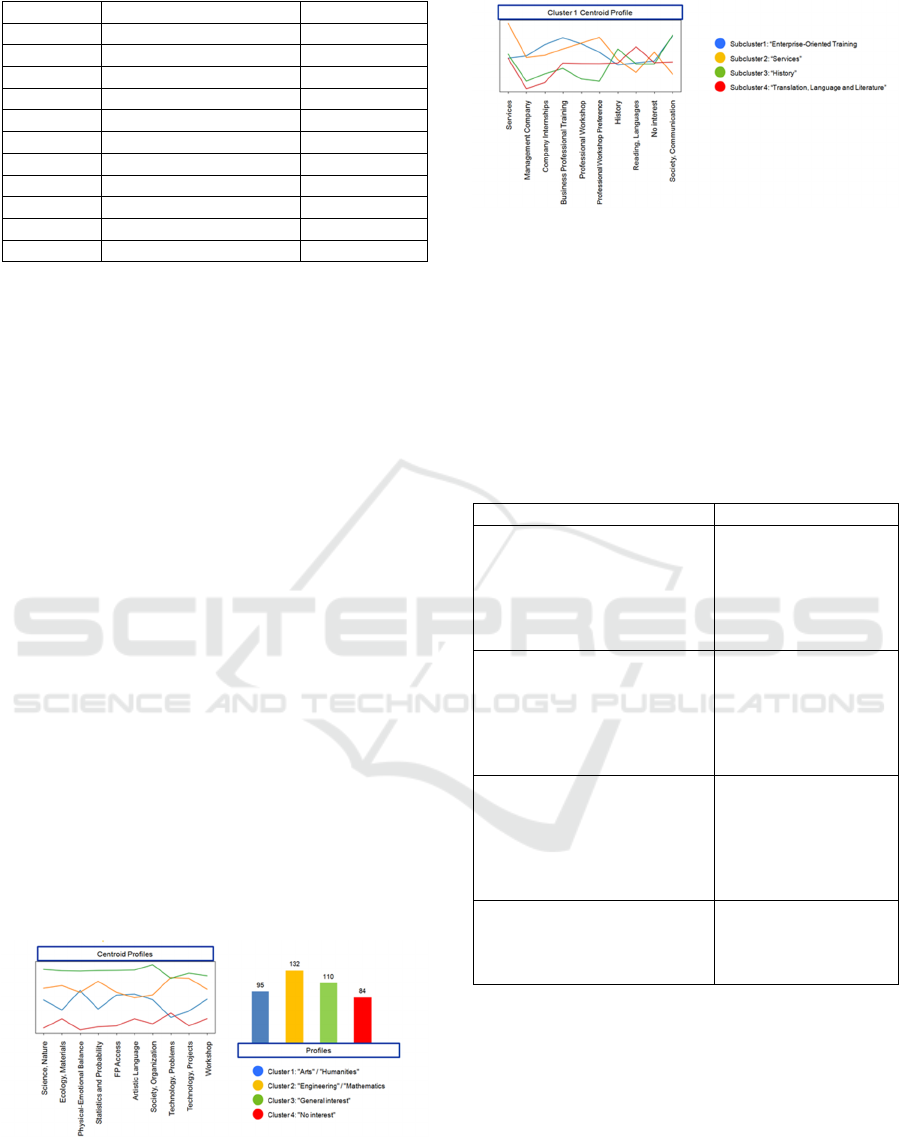
The GM algorithm, which had the highest Gini
validation, was selected. In the first stage, a cluster of
the GM type was generated from the data. The
extracted profiles are descriptive, based on an
analysis of their centroids. As shown in Figure 2, the
clustering algorithm models the original vector space
in very general profiles, which explains the
preferences based not on professional topics, but on
scientific disciplines. However, by applying a
profiling model to each of the obtained subsets
(Subclustering), we obtain, preferences at the
professional subject level at the second level of the
hierarchy (Figure 3). For this second subcluster, we
selected the AC, within which the Gini statistic
showed the highest median value, at 0.85 in the
subprofiles.
This demonstrates that a hierarchical analysis of
the same layers of original information is the most
efficient way to automatically divide and analyze
information related to student preferences. In this
way, it is possible to generate a graph of the
relationships between the general categories and the
obtained subcategories, and it is possible to locate
each student within one of the branches of the
Cluster-Subcluster graph, based on their surveys
responses and environment data. It is also possible to
analyze similarities between different students based
on their combined profiles.
Figure 2. Automatically extracted profiles and centroids.
Figure 3. Automatically extracted subprofiles and
centroids.
This advanced analysis was conducted and 4 different
profiles were defined: [profile 1] Arts and Humanities
(22.56%), [profile 2] Engineering and Mathematics
(31.35%), [profile 3] General Interest (26.12%), and
[profile 4] No Interest (19.85%). The four clusters
were analyzed and subdivided into subcategories, as
shown in Table 2:
Table 2. Interpretation of clusters and subclusters.
Clusterin
g
Subclusterin
g
[profile 1]
Arts and Humanities
Business-Oriented
Vocational Training
Services
History
Translation, Language
and Literature
[profile 2]
Engineering and Mathematics
Engineering, Natural
Science
Physics Teaching
Technical
Engineering
Ph
y
sics
[profile 3]
General Interest
Education
Natural Sciences
History, Language
and Literature
Chemistry, Education,
Engineering
[profile 4]
No Interest
No interest
Any vocational
training
Robotics, Lan
g
ua
g
es
Finally, a relationship graph was generated to show
the relationships between the cluster-subcluster
profiles and career opportunities (Figure 4). This
graph illustrates the possible combinations, called
“feasible regions,” that we can assign as
recommendations once the student has been
triangulated into the appropriate group(s).
Artificial Intelligence as a Tool to Support Studentsâ
˘
A
´
Z Bachelorâ
˘
A
´
Zs Degree and Vocational Training Choices
561
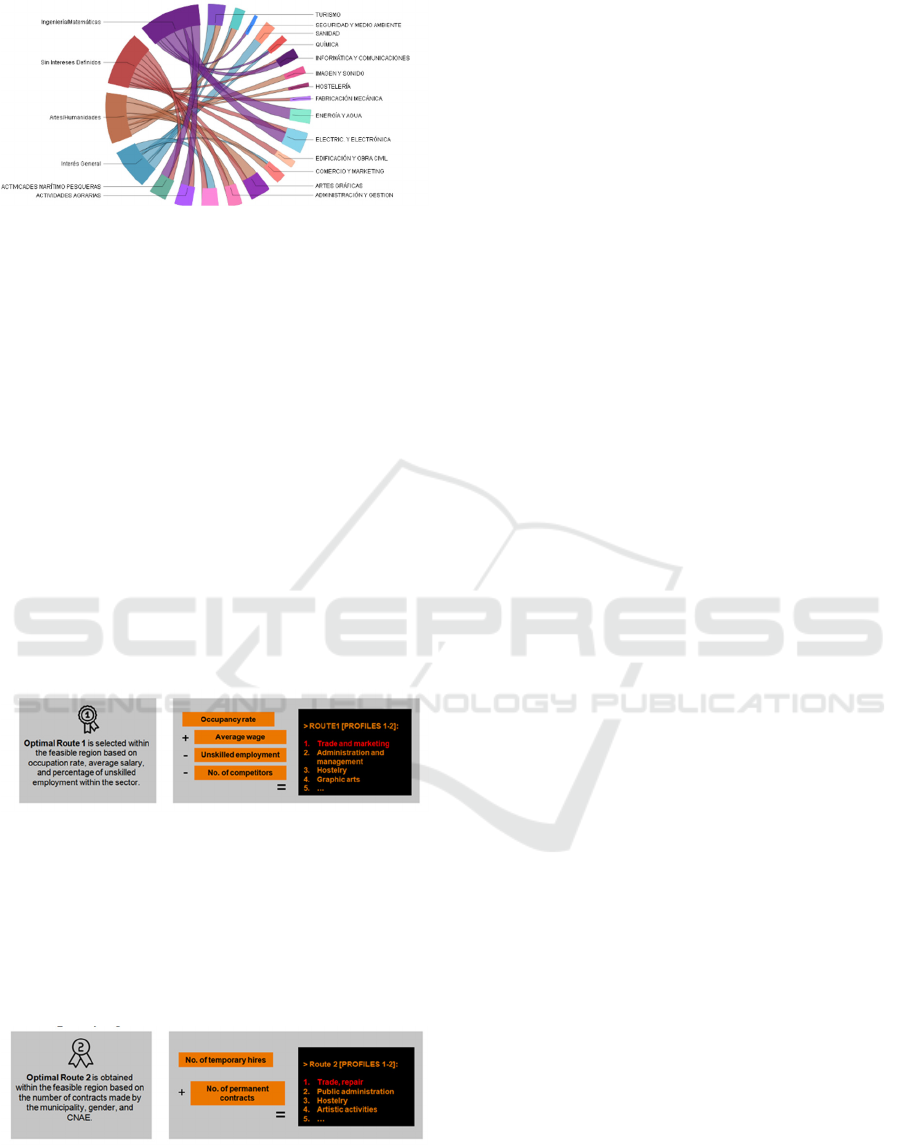
Figure 4. Graph of the relationships between profiles and
career opportunities.
4 CREATION OF THE
PRESCRIPTIVE MODEL
Data were optimized for each category and
subcategory and the feasible region was defined by
means of the possible career paths available for that
profile. The feasible region was generated by taking
the interests of students with that profile into account.
A ranking was prepared for each subcategory taking
other sociodemographic variables into consideration,
such as variables related to the demands of the labor
market. Two optimal routes were designed for each
category and subcategory, one based on general
criteria for future careers (Figure 5) and a second one
considering local demand and genre (Figure 6).
Figure 5. Optimization criteria for recommendations using
Route 1.
As shown, Optimal Route 1 was developed within the
feasible region taking into account the occupation
rate, average salary, and percentage of unskilled
employment within the sector, while Optimal Route
2 was defined by the number of contracts made by the
municipality, gender and CNAE data.
Figure 6. Optimization criteria for recommendations using
Route 2.
In order to determine the optimal routes for each
student, linear regressions were generated based on
data pertaining to the student’s context, and based on
the student’s gender, given that there is a significant
gender bias in job opportunities (particularly in regard
to the temporality of contracts). The regression linear
equation is the following:
Rm,l = 2ol + 2sl - 1el - 1al + 1dp,l + 0.5ip,l + 0.25sp,l
- 0.5np,l + 2hg,l + 1tg,l
where:
R: ranking in the labor supply by feasible region by
student (m)
l: labor supply
p: profile/subprofile
ol: occupancy rate by labor supply
sl: average wave by labor supply
el: unskilled unemployment by labor supply
ap: number of students with the same
profile/subprofile
dp,l: direct relationship between academic demand
and labor supply by profile/subprofile
ip,l: indirect relationship between academic demand
and labor supply by profile/subprofile
sp,l: overqualification of academic demand with
respect to labor supply
np,l: no relationship between academic demand and
labor supply by profile/subprofile
hg, l: work with indefinite contract by gender, where
g is student gender, by labor supply
tg, l: work with temporal contract by gender, where g
is student gender, by labor supply.
Thus, a prescriptive model was generated for each
student, based on the student’s subjective data,
preferences, and contextual environment with respect
to sociodemographic and labor data, as well as the
competence of other similar students. The student has
only to answer a number of questions on a form, and
the system is able to recommend the best route in
terms of work projection, based on the optimization
of the previously described equation, 𝐿
𝑚𝑎𝑥𝑅
,
1
, which finds the labor supply of the
market that maximizes the R
m,l
function for each
student, that is, the best labor supply (𝐿
).
Each student is registered at one and only one
educational center, therefore, we will need to know
the demand for labor supply at each center. In
addition, the number of students at each center is
weighted with respect to the percentage that that
center represents in terms of the population of each
municipality, so we can calculate the total demand for
ISAIC 2022 - International Symposium on Automation, Information and Computing
562
labor supply for each profession in each municipality.
On the other hand, we also have the capacity of each
municipality to absorb said demand or not, depending
on the educational centers that offer training in these
professions, so finally, we have a photo of each
municipality’s capacity to respond to existing
demand, and the number of students who must travel
to other municipalities if the recommendations made
were executed.
𝐶
𝐿
𝐶
𝑁
𝐶
is the number of students weighted by school based
on labor demand (by profession), where:
l: labor supply
m: students
𝐿
: best labor supply by student
C: number of students per center
N: number of centers by municipality
𝐷
𝑂
𝐶𝐶
𝐷
is the demand covered by educational centers with
respect to professions (l), by municipality, where 𝑂
is
the offer by the number of students and profession in
each municipality.
The prescriptive algorithm allows each student to
be assigned an optimal job offer route, and even
suggests the municipality in which to study, based on
the following algorithm:
Prescriptive Algorithm
1. The student fills out the subjective question
survey.
2. The sociodemographic data of the student
are added according to their study center.
3. Information is normalized (z-transformed).
4. Calculate centroid GM(m).
5. Calculate centroid AC(m).
6. Function R
m,l
is optimized to obtain the best
professional route 𝐿
.
7. The result is added to the data set of the
center 𝐶
and the capacity of the demand is
calculated 𝐷
.
8. If 𝐷
< 0) the student is assigned to the
center (𝐶′
) with the closest professional
offer (l) available 𝐷′
0
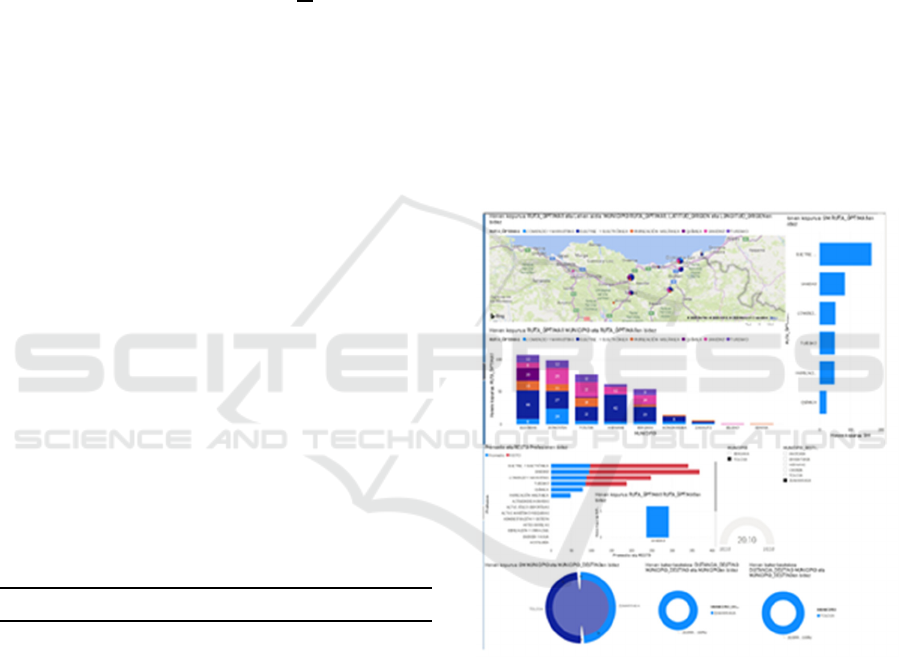
The indicators above allow a descriptive analysis
of the information, including the following points:
Level of labor demand by center.
Level of labor demand by municipality (Figure
7).
Level of global labor demand.
Average distance of travel by municipality in
order to satisfy demand.
Demand not covered by the global educational
offer (Figure 7).
These descriptive models can be filtered, analyzed
and visualized, both from an analytical point of view
and from a geospatial point of view, through a
dynamic visualization platform, either by the public
administration or by the centers themselves.
Furthermore, it is integrated with the students’
response forms so that the assignment of optimal
training routes and the selection of centers can be
done online.
Figure 7. Professional demand by municipality, and
demand not covered by the global educational offer.
5 RECOMMENDATIONS AND
CONCLUSIONS
This article analyzes AI issues in education,
emphasizing how data can be used to help students
with choices about their future. Moreover, we assert
that it is not sufficient to use big data and analytics
solely to evaluate what learners have done (Long,
2011), but that this technology can also be used to
Artificial Intelligence as a Tool to Support Studentsâ
˘
A
´
Z Bachelorâ
˘
A
´
Zs Degree and Vocational Training Choices
563

help them with decisions about their future. We are
aware that linking predictions made by AI systems
with students’ interests will likely have a serious
impact on the students’ future choices (Berendt,
2020), therefore, the model proposed in this paper
should be complemented with the students’
qualitative views, educators’ perspectives and the
opinions of the students’ families. That is to say, our
model should be used as extra input together with
other information provided to the students by their
group of teachers. Along these lines, in order to
prevent biased data-driven decision-making and
considering that big data skills are becoming
increasingly important in all areas, it is necessary to
invest in capacity building and training of both
students and teachers to further support the ICT
infrastructure (Berendt, 2020). In that vein, our model
was provided to schools with recommendations and
guidelines for using the questionnaire and
interpreting the results appropriately.
It is important to remember that models based on
prediction such as ours will need to be updated due to
the fact that skills and interests may change owing to
technological and social developments. Hence, both
more detailed and informative longitudinal studies of
skills requirements and more fine-grained analyses
will be needed. As mentioned above, an important
goal of education is to prepare students for the labor
market, where there may be increasingly dynamic
developments in skills demands.
Nonetheless, legal and ethical issues require
deeper discussion, particularly when taking into
account the fact that our model was designed and
piloted with secondary education students. In fact, as
most organizations are likely to implement AI
strategies and pilot AI solutions to enhance decision
making (Chassignol, 2018), ethical issues should also
be part of the discussion. Furthermore, it could help
students as future citizens to educate them on these
new perspectives. This work contributes to the
existing knowledge on AI in education and is
interesting not only for professionals who support and
teach students but also because of its potential to
empower students in their decision making.
ACKNOWLEDGEMENTS
This work was funded by the Department of
Economic Development, Rural Environment and
Territorial Balance of the Provincial Council of
Gipuzkoa (Talent and Learning 2019).
REFERENCES
Roll, I. & Wylie, R. 2016. Evolution and revolution in
Artificial Intelligence in education, Int J Artif Intell
Educ (2016)26 582-599
Chen, L., Chen, P. & Lin, Z. 2020. Artificial Intelligence in
education: a review IEEE Access 8, 75264–75278
Berendt, B., Littlejohn, A. & Blakemore, M. 2020. AI in
education: learner choice and fundamental rights,
Learning, Media and Technology 40(3) 312-324
Chassignol, M., Khoroshavin, A., Klimova, A. &
Bilyatdinova, A. 2018. Artificial Intelligence trends in
education: a narrative overview Procedia Computer
Science, 136, 16-24
Lee, S. & Chung, J.Y. 2019. The machine learning-based
dropout early warning system for improving the
performance of dropout prediction, Applied Science, 9,
3093
Adekitan, A.I. & Noma-Osaghae, E. 2019. Data mining
approach to predicting the performance of first year
students in a university using the admission
requirements, Educ Inf Technol, 24, 1527-1543
Rienties, B., Herodotou, C., Olney, T., Schencks, M. &
Boroow, A. 2018. Making sense of learning analytics
dashboards: a technology acceptance perspective of 95
teachers, International Review of Research in Open and
Distributed Learning, 19(5), DOI:
10.19173/irrodl.v19i5.3493
Ipiña, N., Basagoiti, R., Jimenez, O. & Arriaran, I. 2016.
Recommendations as a Key aspect for online learning
personalization: perceptions of teachers and students,
International Journal of Social, Behavioral,
Educational, Economic, Business and Industrial
Engineering, 2016, 3321-3325.
Cope, B., Kalantzis, M. & Searsmith, D. 2020. Artificial
Intelligence for education: knowledge and its
assessment in AI-enabled learning ecologies,
Educational Philosophy and Theory, 2020, 1-17, DOI:
10.1080/00131857.2020.1728732
Berendt, B., Littlejohn, A., Kern, P., Mitros, P., Shacklock,
X. & Blakemore, M. 2017. Big Data for Monitoring
Educational Systems. (Luxembourg: Publications
Office of the European Union)
https://publications.europa.eu/en/publication-detail/-
/publication/94cb5fc8-473e-11e7-aea8-01aa75ed71a1/
Pérez, F. & Aldas, J. 2019. Indicadores sintéticos de las
Universidades Españolas. U-ranking. Fundación
BBVA,
http://dx.medra.org/10.12842/RANKINGS_SP_ISSU
E_2019
Kurilovas, E. 2018. On data-driven decision-making for
quality education, Computers in Human Behavior, 107,
DOI: 10.1016/j.chb.2018.11.003
Baker, R., Bettinger, E., Jacob, B. & Marinescu, I. 2017.
The effect of labor market information on community
college students’ major choice, JEL,
https://www.edpolicy.umich.edu/files/02-2017-labor-
market-major-choice.pdf
ISAIC 2022 - International Symposium on Automation, Information and Computing
564

Li, Y. & Zhay,X. 2018. Review and Prospect of Modern
Education using Big Data, Procedia Computer Science,
129, 341-347
Long, P. & G. Siemens. 2011. Penetrating the fog: analytics
in learning and education, EDUCAUSE Review, 46(5),
30-40
Artificial Intelligence as a Tool to Support Studentsâ
˘
A
´
Z Bachelorâ
˘
A
´
Zs Degree and Vocational Training Choices
565
