
Design of the Feeding System Automatic Koi Fish Based on Internet
of Things Using the Fuzzy Logic Controller Method
M. Udin Harun Al Rasyid, Nur Rosyid Mubtadai and Aditya Yogi Dwi Nugraha
Informatic Engineering, Politeknik Elektronika Negeri Surabaya (PENS), Sukolilo, Surabaya, Indonesia
Keywords: Automatic Feeder, Internet of Things, Fuzzy.
Abstract: Feeding is important in fish farming. However, in general, feeding is still done manually, which is oriented
to human resources. This method has drawbacks that also affect fish growth, such as scheduling errors and
uncontrolled feeding doses that can cause overfeeding. This research aims to create a system for feeding and
scheduling feeds and checking feed remotely using Internet of Things (IoT) technology which is equipped
with several types of sensors, namely temperature sensors, humidity sensors, and rain sensors that function to
monitor weather conditions around the pond as input. fuzzy to determine the amount of feed issued, while the
ultrasonic sensor functions to monitor the availability of feed in the container. The sensor takes the data and
then it is received by the Arduino Uno microcontroller. Furthermore, the data will be sent to the ESP8266 and
there is data processing with the fuzzy method as an output for how long the servo motor is open. The data
that is ready will be passed to the database server (Firebase) using the ESP module with a Wi-fi network, then
from the Firebase the data will be passed to the Android application via the API. That way users can see the
results of monitoring feed conditions, automatic feeding scheduling, monitoring the weather around the pond
in real time through an Android-based application. Feeding monitoring trials and application functionality
have been successfully carried out with scenarios testing applications, devices, and sensors that are connected
to each other that are attached to the feed container.
1 INTRODUCTION
Feeding is important in fish farming. However, in
general, feeding is still done manually, which is
oriented to human resources. This method has
drawbacks that also affect fish growth, such as
scheduling errors and uncontrolled feed dosages.
Feeding koi fish is done 3-4 times a day with the right
dose and time. Feeding that is too frequent and
excessive will affect the health of the fish, because the
leftover food will mix with feces so that it becomes
ammonia and decomposes into nitrite which is
harmful to fish health.
In addition to cultivation ponds, small koi ponds
owned by many homeowners are often left to go out
of town or are not at home, this is also a problem if
the fish are not fed at the right time or even not fed at
all. Outside temperature conditions greatly affect the
amount of feed given to fish, if during the rainy
season the dose of feed given is not as much as during
the dry season or when it is not raining, the
temperature also affects feeding (Rasyid, 2021).
The problem with koi fish farmers today is
feeding fish in ponds. In traditional koi fish
cultivators, human error often occurs with feeding
hours and feed dosages in koi ponds, especially for
small ponds if the homeowner is not at home for a
long time. This system causes farmers to be unable to
monitor feed availability and check feeding at any
time or in real time in koi ponds. So that the
management of koi pond feed with this system is still
not optimal.
To solve the above mentioned problem, this
research proposes feeding system automatic for Koi
fish based on internet of things (IoT) using the fuzzy
logic controller method. The development of feed
management is needed to increase automation,
intelligence, productivity, and expand the aquaculture
industry.
Several studies have been carried out to solve the
above-mentioned problems to build an automatic feed
system. Sousa et al. proposed an integrated IoT
platform for aquaculture environmental monitoring
and environmental data collection. A mobile
unmanned surface vehicle and buoy equipped with
Al Rasyid, M., Mubtadai, N. and Nugraha, A.
Design of the Feeding System Automatic Koi Fish Based on Internet of Things Using the Fuzzy Logic Controller Method.
DOI: 10.5220/0011957300003575
In Proceedings of the 5th International Conference on Applied Science and Technology on Engineering Science (iCAST-ES 2022), pages 921-930
ISBN: 978-989-758-619-4; ISSN: 2975-8246
Copyright © 2023 by SCITEPRESS – Science and Technology Publications, Lda. Under CC license (CC BY-NC-ND 4.0)
921
environmental sensors collects data on water
conditions (aquatic), and sends it to a data centre for
further data storage and processing (Sousa, 2019).
Sun et al. proposed an integrated water quality
monitoring system with GIS and IoT technology. The
system performs remote monitoring, management
and control of water temperature, dissolved oxygen,
pH, and water level. The system performs packet loss
rate analysis using a Wi-Fi network and analyses
dissolved oxygen conditions (Sun, 2019).
Lee et al. proposed an IoT-based urban aquaponic
system. The system consists of a fish tank,
hydroponic tank, IoT monitor (pH), and a water test
kit (pH, NO2, NO3). Case study using hydroponics
plant lettuces and breed goldfish (Lee, 2019). Ismail
et al. proposed a model for direct measurement and
IoT-based fishpond water parameter monitoring
system. The system consists of a Raspberry Pi
microcontroller, DO sensor, temperature sensor, pH
sensor. Data from the sensor is sent to the
microcontroller, and then sent to the database server
(Ismail, 2020).
Uddin et al. proposed a real-time freshwater
shrimp monitoring system. The system detects the
sensor values for temperature, pH, dissolved oxygen,
salinity level, and turbidity. The system will give an
alert if it is out of the range value that has been set.
The system analyses the size, weight, and percentage
of live shrimp (Uddin, 2020). Ouyang et al. proposed
a monitoring framework for aquaculture farms. The
framework consists of a robotic sensing platform
equipped with water quality sensors, an automatic
charging system and sensor cleaning, a data
processing system using machine learning, and an
aquaculture farm control centre (Ouyang, 2021).
2 SYSTEM DESIGN
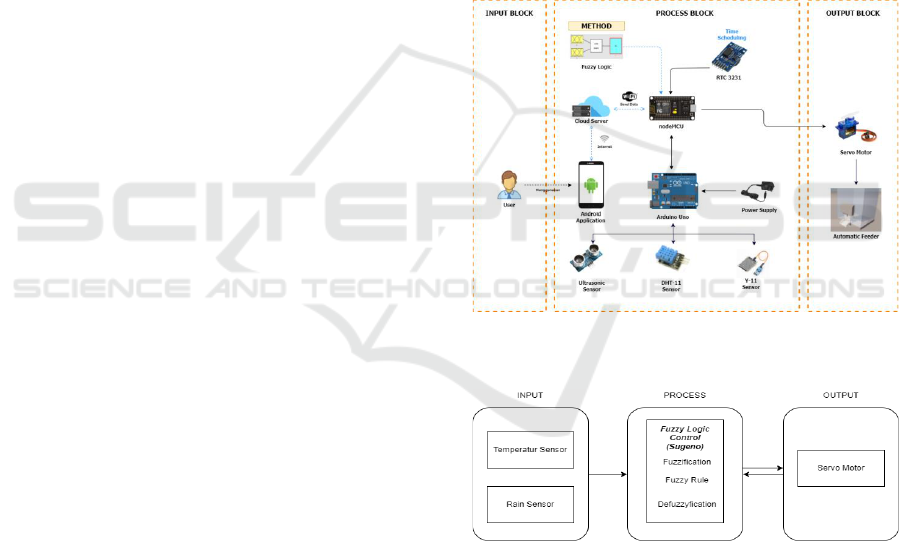
Figure 1 shows an overview of the proposed system
design. In the design of this system, the data to be
processed will be obtained directly from the data on
the feed container in the fish pond. Where there are
three parts contained in the design of this system,
namely, block input, process, and output.
In the input block section there are users who can
monitor the status of feed conditions and feeding
schedules in real time with the Android application.
And also, users can receive notifications of feeding
schedules.
In the process block, there is an Arduino Uno as
the sensor control centre. The sensor used is an
ultrasonic sensor, which functions to measure the
availability of feed. The DHT sensor and Rain
detector for monitoring weather conditions as an
output of the amount of feed measured using the
fuzzy method. NodeMCU will receive the data value
sent from Arudino Uno. The data values are sent by
nodeMCU to Firebase.
At the output, nodeMCU gives commands to the
servo motor to move the feed container valve to open
it according to the specified time and the amount of
feed depends on the fuzzy calculation.
After the data is processed, the data will be sent
and stored on the Firebase real-time database server.
The android application will display the data in the
database in real-time to the application user via
internet communication. The main features of the
Android application as data visualization are
monitoring feeder, control schedule, and monitoring
weather.
Figure 1: Design of an automatic feeder system in a koi
fishpond.
Figure 2: Design of an automatic feeder system in a koi
fishpond.
Fuzzy logic control is applied to the servo motor.
The function of this control is to control the length of
time the servo motor opens the valve. The input of the
fuzzy logic control system is data from temperature
and humidity sensors and rain sensors. Both sensors
are used to determine the outdoor weather conditions
in the koi fish pond. The final desired result from this
fuzzy logic control application is that fish feed can be
distributed on a scheduled basis and according to the
iCAST-ES 2022 - International Conference on Applied Science and Technology on Engineering Science
922
expected dose. The fuzzy logic control block diagram
can be seen in figure 2.
This process aims to create a membership function
from real numbers. The output is a linguistic variable
that distinguishes each condition based on the range
value.
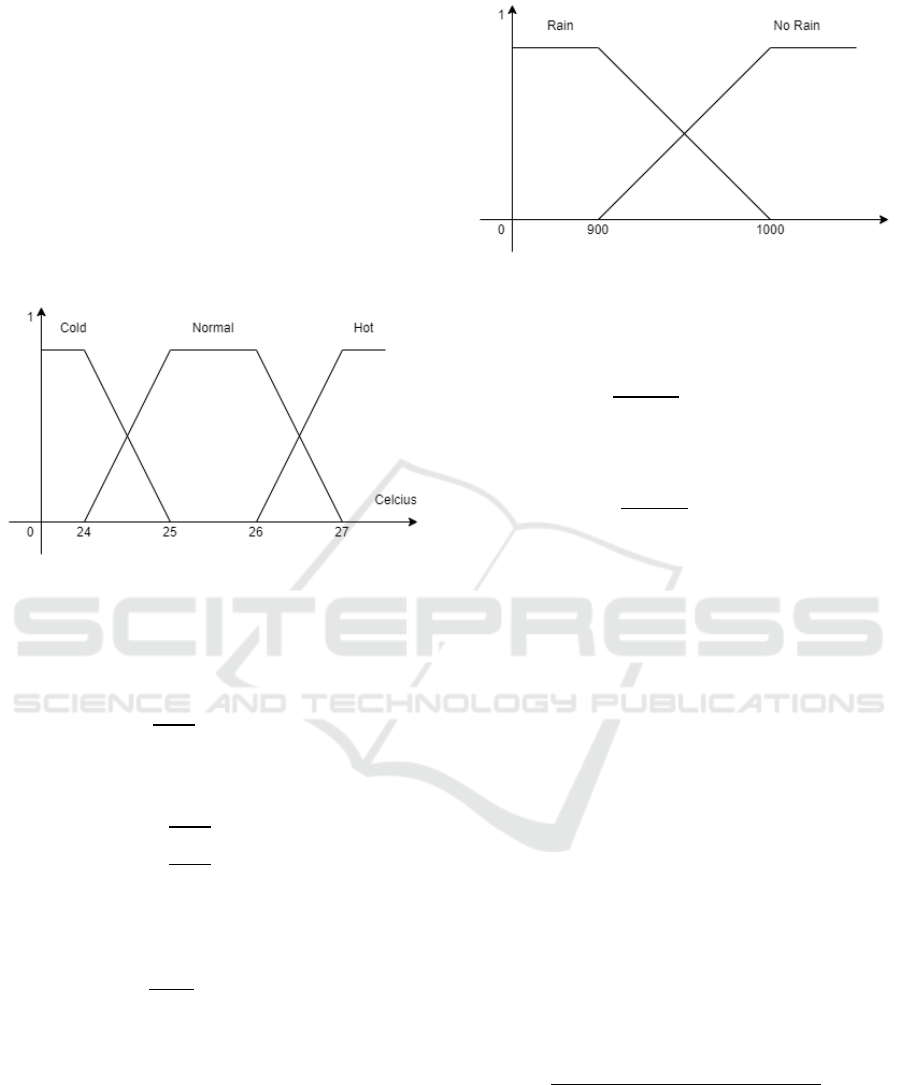
a) Temperature Variable
Air temperature will be grouped into three
different variables. The variables used include cold,
normal, and hot. Then the values and variables are
described in the fuzzy set of air temperature into the
membership function in figure 3.
Figure 3: Temperature member.
For the temperature membership function as
follows:
(1)
(2)
(3)
b) Rain Variable
Rain Status will be grouped into two different
variables. The variables used include rain and no rain.
Then the values and variables are described in the
fuzzy set of rain status into the membership function
in figure 4.
Figure 4: Rain member.
For the rain membership function as follows:
(4)
(5)
Fuzzy Rule
R1) IF Temperature = Cold AND Rain Status = Rain
THEN Valve Condition = Fast
R2) IF Temperature = Cold AND Raining Status =
No Rain THEN Valve Condition = Medium
R3) IF Temperature = Normal AND Rain Status =
Rain THEN Valve Condition = Fast
R4) IF Temperature = Normal AND Rain Status = No
Rain THEN Valve Condition = Long
R5) IF Temperature = Hot AND Rain Status = Rain
THEN Valve Condition = Medium
R6) IF Temperature = Hot AND Raining Status = No
Rain THEN Valve Condition = Old
Defuzzification
Defuzzification in the Sugeno method is to calculate
the centre of single-ton or the centre point of the crisp
value using the weight average method which is
described in the following formula.
(6)
Description:
Z = fuzzy calculation result
an = value for the nth combination (singleton value)
zn = fuzzy membership rule value for the nth
combination
Design of the Feeding System Automatic Koi Fish Based on Internet of Things Using the Fuzzy Logic Controller Method
923
The value of zn is obtained from the implication
function that uses the minimum function, namely by
looking for the i-th rule and can be expressed by the
following equation:
(7)
Description:
= minimum value of fuzzy sets A and B in the i-th
rule
= degree of member x of the fuzzy set A in the
i-th rule
= degree of member x of the fuzzy set B in the
i-th rule
So, the value of the servo motor will open
according to the z value obtained and according to the
following z function.
(8)
Where if it's fast then the servo motor opens for 2
seconds, medium 4 seconds, and long 6 seconds.
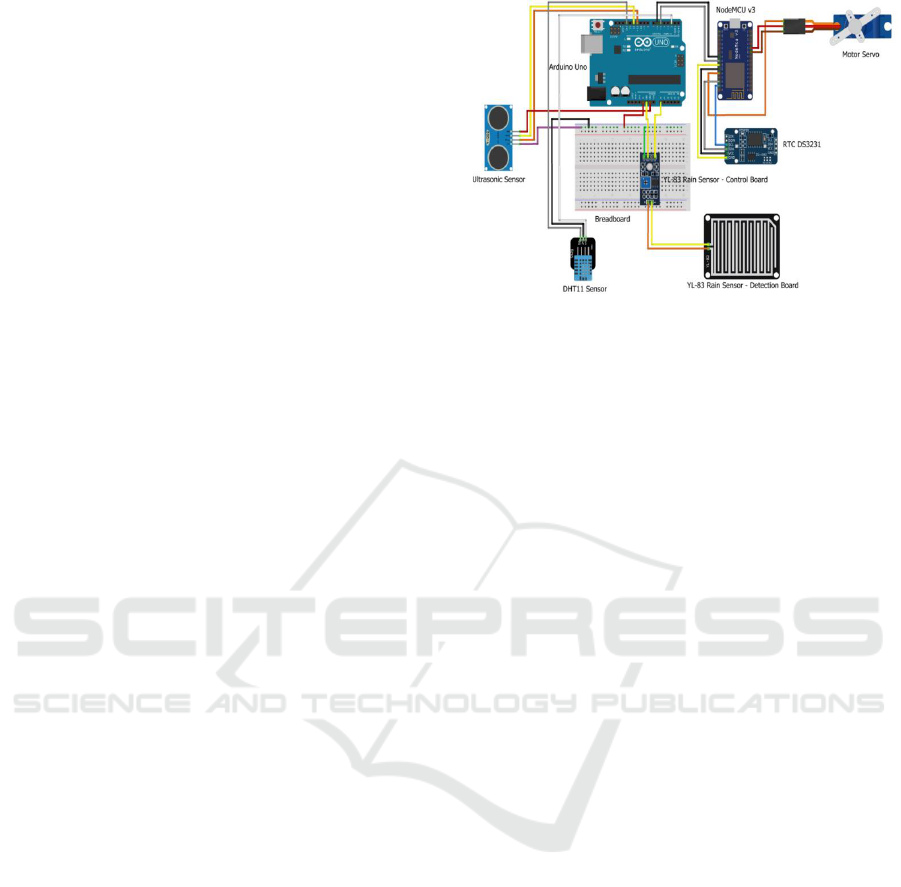
2.1 Hardware
The components are assembled on a breadboard with
the aim of making the components neat so that there
are no many wires and no need for soldering. Arduino
as the main microcontroller which is connected to
each DHT sensor, ultrasonic, and rain sensor. While
the NodeMCU is connected to the servo motor and
RTC. Each component is connected by a jumper
cable, for the voltage to the sensor is taken from the
5v pin available on the Arduino Uno, while for the
servo and rtc motors the voltage is taken from the 3.3v
pin available on the NodeMCU. The results design is
as in figure 5.
The detailed sections of each piece of hardware
are described as follows:
Main Component
The detailed sections of each piece of hardware are
described as follows:
a. Arduino Uno
Arduino Uno using the ATmega328 chip
functions to control sensors including dht11
sensors, rain sensors and ultrasonic sensors. This
device requires 5v power.
Figure 5: Design hardware.
b. Nodemcu v3 ESP8266
The NodeMCU with a power of 5v serves as a
liaison between the hardware and the cloud server
or database that is connected via Wi-Fi technology
using the internet network.
c. DHT11 sensor(Temperature and humidity sensor)
The DHT11 sensor is a temperature and humidity
measurement sensor that is directly related to the
Arduino Uno on the digital pin (pin 2) with 5v
input. °C and humidity from 20% to 90% with an
accuracy of ±1 °C and ±1%.
d. Y-11 Rain Sensor
This Rain Sensor or Rain Sensor uses a 5v voltage
which is directly related to the Arduino Uno on the
analog pin, namely pin A0.
e. Ultrasonic Sensor
This ultrasonic sensor serves to measure the
distance from the sensor to the fish feed, so that
it can detect the availability of existing feed. This
sensor uses a 5v voltage which is directly related
to Arduino Uno on digital pins (pin 11 and pin 12).
f. Servo Motor
Servo motor as an automatic feed valve controller
which is ordered by the NodeMCU to a certain
angle according to the conditions and
opening time from the fuzzy calculation results.
The servo motor is connected to the NodeMCU on
digital pin D4 with 3.3v input.
g. RTC DS3231
This DS3231 RTC is used for timing controllers.
Directly connected to NodeMCU on digital pins
D1 and D2 with 3.3v input.
Supporting Component
The following components function to support the
main components so that the system and hardware
design can work optimally:
a. Jumper Cable
iCAST-ES 2022 - International Conference on Applied Science and Technology on Engineering Science
924
Jumper cable serves as a connector between
the hardware. In this study, 3 types of jumper
cables were used, including: male to male, female
to female, and male to female.
b. Micro USB Cable
This cable serves to connect the NodeMCU
with the power adapter so that the NodeMCU can
be turned on.
c. Breadboard
Breadboard is used to make temporary
electronic circuits for the purpose of testing or
prototyping without having to solder. This avoids
components from being damaged if incorrectly
soldered.
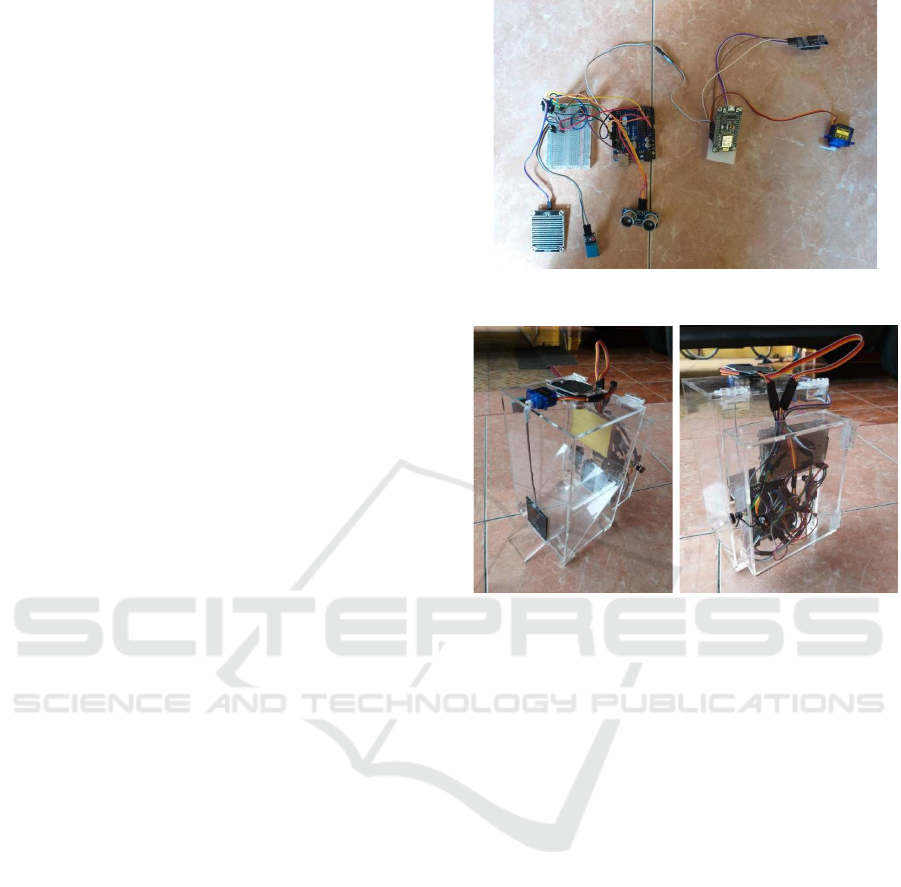
Hardware Assembly
The components that have been previously designed
are then assembled into one according to the
electronic component design. The results can be seen
in figure 6.
The components are assembled on a breadboard
with the aim of making the components neat so there
are no many wires and no soldering required. Arduino
as the main microcontroller which is connected to
each sensor. While the NodeMCU is connected to the
servo motor and RTC. Each component is connected
by a jumper cable, for the voltage to the sensor is
taken from the 5v pin available on the Arduino Uno,
while for the servo and rtc motors the voltage is taken
from the 3.3v pin available on the NodeMCU.
For the implementation of the manufacture of feed
containers, acrylic is used as the main material in the
manufacture of containers. Acrylic material is
considered to have a lighter and more durable
material quality, because later this container is placed
in an outdoor environment. The following is the result
of the implementation of the container which can be
seen in figure 7. Pre-installed hardware will be
installed or integrated with the finished receptacle.
The hardware is stored on the back of the case
consisting of arduino uno, esp8266, beardboard, rtc,
etc. Meanwhile, the sensors are mounted on the
outside of the top of the container in order to take
maximum sensor data. There is a valve that is
connected to a servo motor as the driving motor of the
valve, so that the feed can come out through the hole
in the front of the container.
Figure 6: Assembled Hardware Components.
Figure 7: Implementation of feed containers.
2.2 Database Server (Firebase)
To accommodate sensor data from the
microcontroller, a real-time database system is
designed. Realtime database created using Firebase.
To create a Firebase database project, you must first
create a Google Firebase account. Then create a
database and select the Realtime Database type.
In this study, there are three children in one
database. The database that has been created is named
feeder. Each database that has been created will
automatically degenerate an account to perform
remote data. This remote data function is to send data
and retrieve data. The account that must be owned to
connect firebase with the server and gateway is the url
name and secret key which is automatically
degenerated according to the database name created.
Initialize firebase_host as account url and
firebase_auth as authentication account in the form of
a unique secret key. This secret key can be
regenerated by requesting a request to firebase. So in
connecting nodeMCU to firebase, it is enough to enter
the url and secret key.
Design of the Feeding System Automatic Koi Fish Based on Internet of Things Using the Fuzzy Logic Controller Method
925
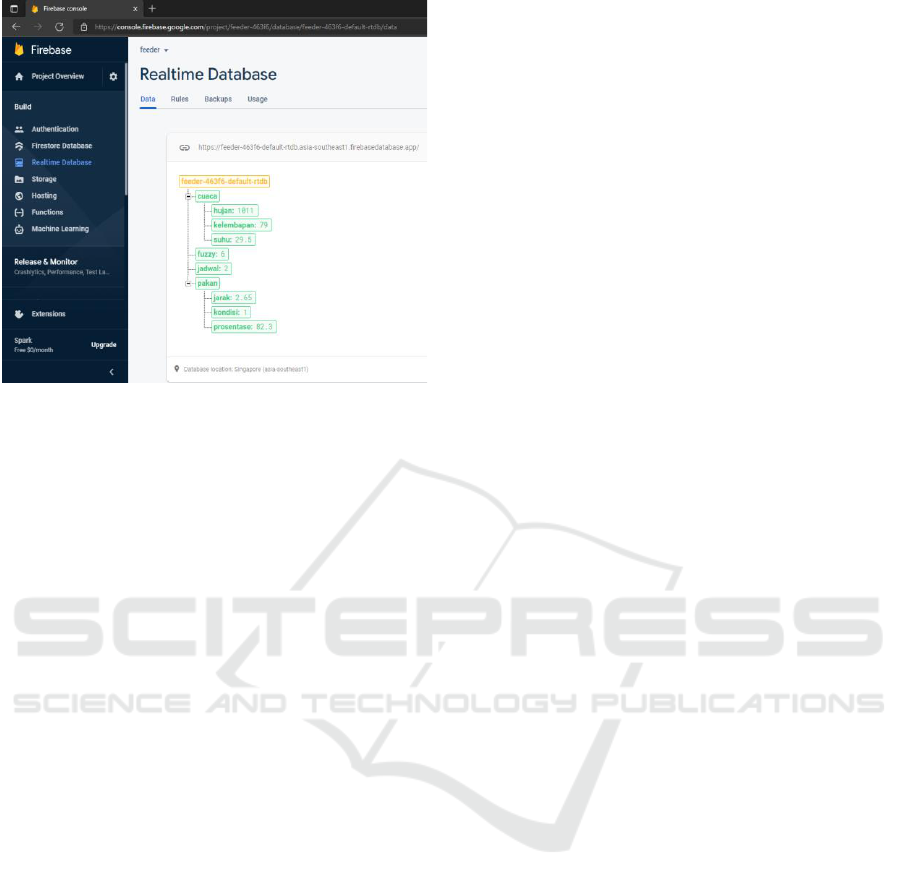
Figure 8: Design Database.
Figure 8 displays a database containing data that
accommodates sensor data. The data type used in
firebase is Float. The children used in this study
include Weather, Fuzzy, and Feed. Weather is a child
that is used to store weather sensor data outside the
pool, while the reference child is rain, humidity, and
temperature. Fuzzy Child is a child that is used to
accommodate data on the value of defuzzification in
this research system, which is used as a determinant
of how long the feed valve opens. Feed Child is a
child that is used to accommodate feed data obtained
from ultrasonic sensors, there are reference children
namely distance, condition, and percentage of feed
availability. All children in this database have the
Float data type. Each data sent will have a unique id
generated by Firebase.
2.3 Software Application
Application made for visualization of data sent from
a microcontroller based on android. The android
application in this research uses the native java
language that is built using the android studio tool.
There are several features in the mobile-based
(android) application in this research, namely:
1) Feed Monitoring Features.
Users of this application will get information
about feed availability status data, information on
remaining feed, and information about the feed itself.
The sensor data displayed will be automatically
updated at any time (realtime) using the firebase
database.
2) Auto Feed Feature.
Users of this application will get information about
the feeding schedule every day at previously set
hours.
3) Weather Monitoring Features Around the Pool
This feature will display weather sensor data
obtained in real time and users can see the results of
fuzzy calculations as well as how long the feed valve
has been open.
4) Real-time Notification Feature.
Users of this application will get notifications in
real time if the feed valve opens according to a
predetermined schedule. In the notification there is
information on the schedule of feeding hours and how
long the valve opens at that hour.
3 EXPERIMENTAL STUDY
This section describes the performance of measuring
weather conditions and feed distances with each of
the available sensors. We compare dynamic
responses to get the weather state in seconds. We
analyzed the results of this comparison experiment to
find out how efficiently these monitoring devices
work.
The first is hardware testing and sensor
performance in detecting the weather.
3.1 Rain Sensor Testing
This test is carried out to determine whether the rain
sensor is able to read rain conditions through water
droplets. In this rain sensor, the test is carried out by
dripping water on the sensor panel using a tissue
moistened with water as shown in figure 9 below.
This test is a simulation as if it were raining in the
original conditions outside the room.
We observed the interaction of changes in the rain
sensor value whose sensor value was received and
displayed by Arduino Uno. Table 1 shows data from
the rain sensor that has been tested. It can be seen in
output number 1 when the rain senor is still dry and
has not been wetted by water and shows the value is
1022. Then at output number 2 the sensor starts to be
wetted by water droplets, and the value drops to 414,
as well as at output number 3, which are 439. The
sensor value means that the more puddles or water
intensity on the rain sensor panel, the smaller the
sensor value obtained. It can be seen that the more
water droplets are given, the smaller the value of the
rain sensor will be. The average delay obtained is 2
seconds. So it can be concluded that the rain sensor
data that has been tested has a change in value and the
rain sensor test has been successful.
iCAST-ES 2022 - International Conference on Applied Science and Technology on Engineering Science
926
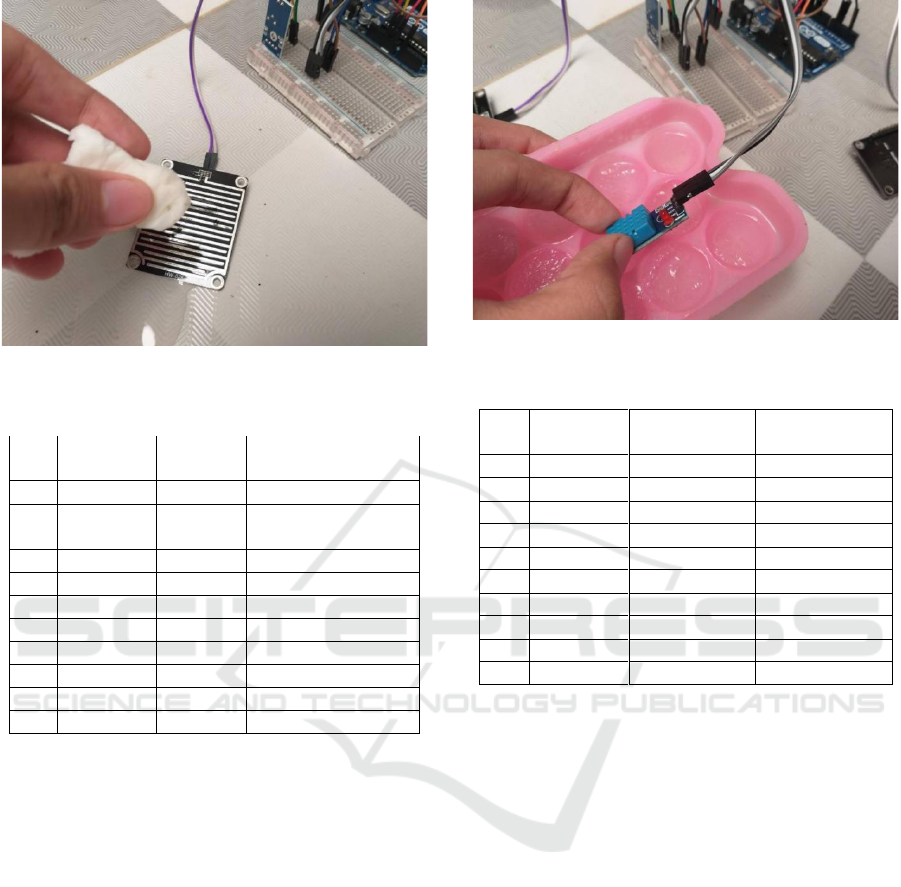
Figure 9: Rain sensor testing.
Table 1: Rain Sensor Test Results.
No
Time
Analog
Value
Panel Condition
1.
07:42:42
1022
Dry
2.
07:43:00
1018
Starting to drip
water
3.
07:43:19
975
Dropped by water
4.
07:43:37
929
Dropped by water
5.
07:43:56
577
Dropped by water
6.
07:44:14
673
Dropped by water
7.
07:44:33
499
Dropped by water
8.
07:44:51
452
Dropped by water
9.
07:45:10
390
Dropped by water
10.
07:45:28
250
Dropped by water
3.2 DHT Sensor Testing
This test is carried out to determine whether the dht-
11 sensor is able to read the condition of temperature
changes in the outside air. On the temperature and
humidity sensor, the test is carried out using ice cubes
that are brought closer to the sensor as shown in figure
10. This test is a simulation as if there is a change in
outside temperature.
Table 2 shows data from the temperature and
humidity sensors that have been tested. Data is
retrieved every 10 seconds and displayed on a serial
monitor. It can be seen that when the sensor is brought
near to an ice cube, the temperature value will
decrease as well as the humidity level. There is an
average delay of 1.5 seconds when reading the
temperature and humidity values. At the time of data
collection, the sensor value does not immediately
change in value when brought close to ice cubes. So
it can be concluded that the temperature and humidity
sensor data that has been tested has been successful.
Figure 10: DHT sensor testing.
Table 2: DHT Sensor Result.
No
Time
Temperature
Value (°C)
Humidity (%)
1.
08:23:48
28.70
63.00
2.
08:24:01
28.30
57.00
3.
08:24:13
27.50
44.00
4.
08:24:25
26.60
57.00
5.
08:24:37
25.50
52.00
6.
08:24:49
24.40
49.00
7.
08:25:02
23.50
48.00
8.
08:25:14
23.20
68.00
9.
08:25:26
23.70
50.00
10.
08:25:38
24.00
55.00
3.3 Ultrasonic Sensor Testing
This test is carried out to determine whether the
ultrasonic sensor is able to measure the distance from
the sensor to the fish feed in order to determine the
availability of feed in the container. The test is carried
out by reducing the content of the feed periodically
and comparing it with manual measurements using a
ruler which can be seen in figure 11.
Table 3 shows of data from the ultrasonic sensor
that has been tested. Table 4 shows that ultrasonic
sensor testing has been successfully carried out. The
sensor measures the feed distance from 6 cm to 26 cm
which is done by periodically reducing the feed
content in the feed container. The sensor
measurement results are compared with a ruler, from
the data it can be concluded that the data read by the
ultrasonic sensor is very accurate and the accuracy
value is 100%, because the value is the same as the
manual measurement. There is a delay that is obtained
an average of 1.5 seconds.
Design of the Feeding System Automatic Koi Fish Based on Internet of Things Using the Fuzzy Logic Controller Method
927
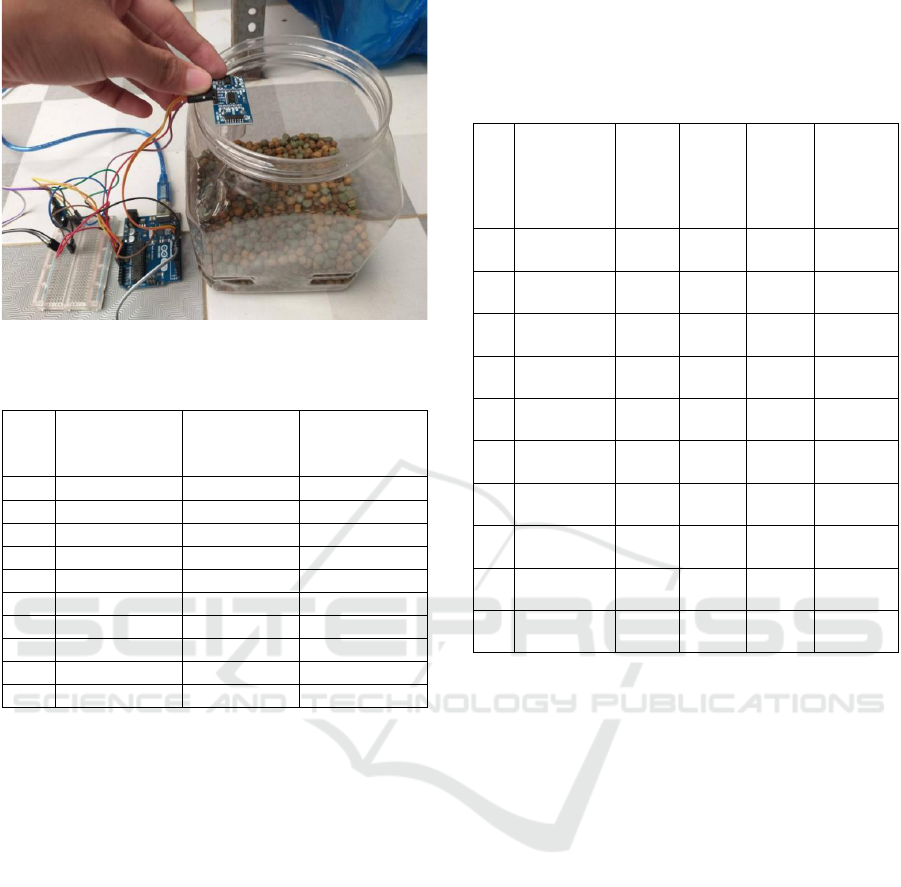
Figure 11: Ultrasonic Sensor Testing.
Table 3: Ultrasonic Sensor Testing.
No
Sensor
Measure-
ment (cm)
Manual
Measure-
ment (cm)
Feed Status
1.
6
6
full
2.
6
6
full
3.
10
10
will run out
4.
12
12
will run out
5.
15
15
will run out
6.
15
15
will run out
7.
18
18
will run out
8.
22
22
run out
9.
25
25
run out
10.
26
26
run out
The second is testing the fuzzy method on the
device. Fuzzy testing is carried out, with the aim of
knowing the success of the system in determining the
amount of feed issued based on fuzzy calculations.
This test is carried out by monitoring the readings of
the temperature and rain sensors to get fuzzy output
results. The test is carried out by simulating weather
changes on a regular basis, namely with scenarios of
rain and hot temperatures, rainy and cold, no rain and
cold temperatures, no rain and hot temperatures. This
scenario was carried out to see if the old valve opened
in accordance with the existing conditions. The
following output is displayed from the NodeMCU
serial monitor.
Table 4 shows the fuzzy test result. The fuzzy test
uses 10 data samples with different input values for
temperature and rain. The test carried out is to analyze
that the fuzzy formula applied to the system can
produce output according to manual calculations and
can control the servo motor according to the given
fuzzy output. From the many experiments and various
tested scenarios, it can be concluded that the system
can run according to the previous design, and the
fuzzy output results have shown 100% accuracy
results, namely by comparing the system output value
with manual calculations and can provide controlling
the length of the servo motor valve to open it.
Table 4: Fuzzy test result.
N
o
Temperatu
re Sensor
(°C)
Rain
Sens
or
Outpu
t
Fuzzy
Syste
m
Outpu
t
Fuzzy
Manu
al
Valve
Openin
g
Conditi
on
1.
28.80
1020
6,00
6,00
6
second
2.
24,90
1021
5,80
5,80
6
second
3.
24.50
1022
5,00
5,00
6
second
4.
24.40
1020
4,80
4,80
6
second
5.
23.80
1020
4,00
4,00
4
second
6.
21.90
1017
4,00
4,00
4
second
7.
24.40
704
2,00
2,00
2
second
8.
24.60
590
2,00
2,00
2
second
9.
25.00
1014
6,00
6,00
6
second
10
.
25.60
1019
6,00
6,00
6
second
After doing some hardware and software testing,
then test the sustainability of the automatic feed
system when it was run with several days of
observation trials. This test is carried out by running
the tool for a period of one week (7 days).
Observations were made by monitoring each feeding
schedule. The focus of this test is to see how long the
valve opens every hour and calculate the timeliness
of the tool throwing the feed whether it is in
accordance with the specified. Data is taken directly
and periodically. Sensor data is taken every 2 seconds
from the tool and sent directly to firebase.
The results of the observations can be seen in
table 5, by displaying the length of time the valve
opens, the dose issued, and the time the valve opens.
iCAST-ES 2022 - International Conference on Applied Science and Technology on Engineering Science
928
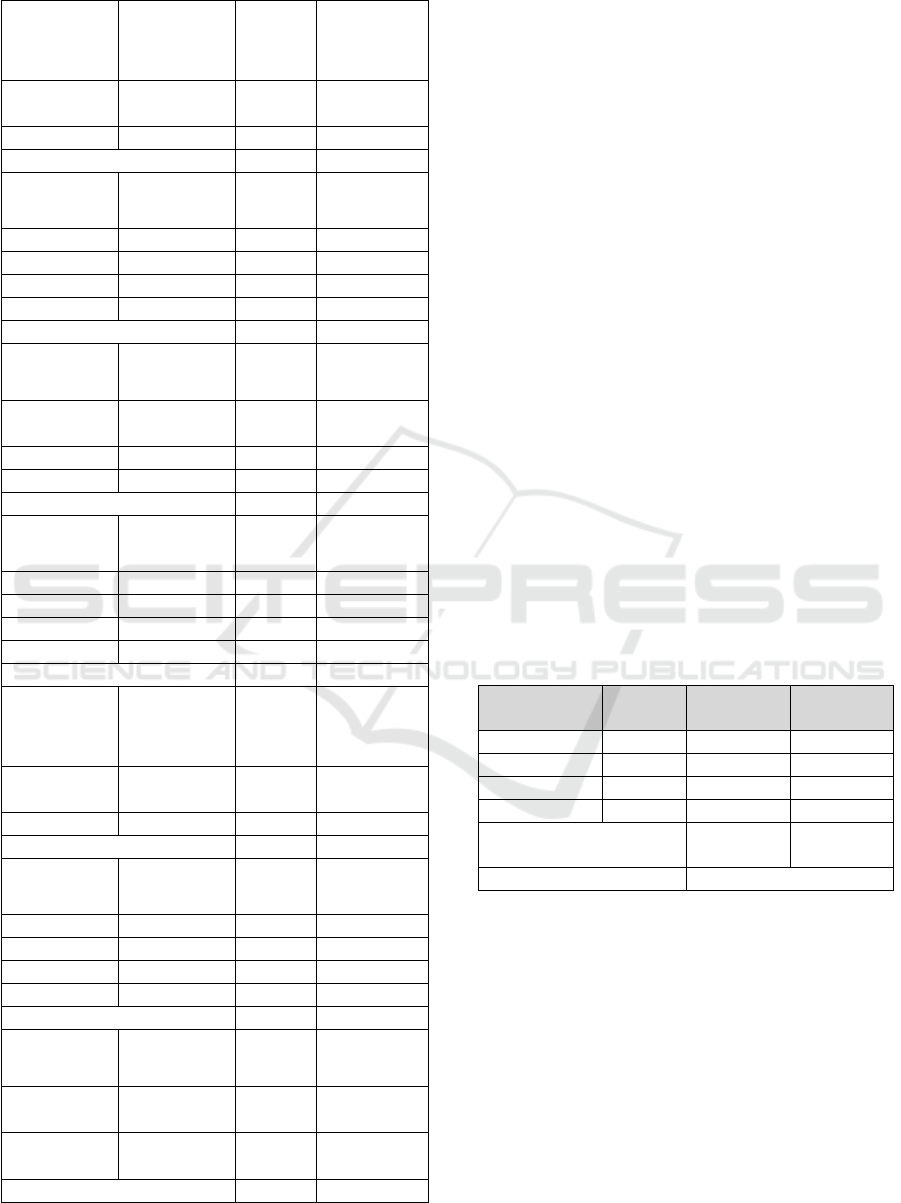
Table 5: Automatic Feed Observation Result (7 Days).
Day 1 Trial
Open Valve
(second)
Dose
(gram)
Time
(hh:mm:ss)
first time
4
52,3
07:00:04
second time
6
73,6
11:50:05
third time
4
52,3
15:30:02
fourth time
2
22
19:00:03
Total Feed
200,2
Day 1 Trial
Open Valve
(second)
Dose
(gram)
Time
(hh:mm:ss)
first time
6
73,6
07:00:21
second time
6
73,6
11:50:10
third time
2
22
15:30:05
fourth time
2
22
19:00:03
Total Feed
191,2
Day 1 Trial
Open Valve
(second)
Dose
(gram)
Time
(hh:mm:ss)
first time
4
52,3
07:00:15
second time
6
73,6
11:50:07
third time
2
22
15:30:10
fourth time
2
22
19:00:12
Total Feed
169,9
Day 1 Trial
Open Valve
(second)
Dose
(gram)
Time
(hh:mm:ss)
first time
4
52,3
07:00:05
second time
6
73,6
11:50:12
third time
4
52,3
15:30:11
fourth time
2
22
19:00:07
Total Feed
200,2
Day 1 Trial
Open Valve
(second)
Dose
(gram)
Time
(hh:mm:ss)
first time
4
52,3
07:00:06
second time
6
73,6
11:50:05
third time
4
52,3
15:30:02
fourth time
2
22
19:00:11
Total Feed
200,2
Day 1 Trial
Open Valve
(second)
Dose
(gram)
Time
(hh:mm:ss)
first time
6
73,6
07:00:11
second time
6
73,6
11:50:02
third time
2
22
15:30:08
fourth time
4
52,3
19:00:09
Total Feed
221,5
Day 1 Trial
Open Valve
(second)
Dose
(gram)
Time
(hh:mm:ss)
first time
6
73,6
07:00:14
second time
6
73,6
11:50:07
third time
4
52,3
15:30:05
fourth time
4
52,3
19:00:09
Total Feed
252,8
From the table 5, the automatic feed system can
already do its job of throwing feed according to the
specified schedule. Thus the RTC function as a time
scheduler has been running well. There is a time
difference between the scheduled time and the launch
time. From these observations, the average time
difference is 7.89 seconds. With the longest
difference of 21 seconds, and the fastest time
difference of 2 seconds. This can happen due to the
difference in the seconds of the hour on the time
measuring device and the seconds of the hour on the
tool. The time difference can also be caused by the
delay in collecting data from the device.
Because the feed released depends on the weather
around the pond, it can be seen the efficiency of the
feed that cultivators must use within these 7 days.
Prior to the existence of this tool, cultivators needed
320 grams of feed per day with each feeding time of
80 grams for fish ponds with medium fish needs as
many as 15 fish with a pond size of 3 x 2 meters. After
the equipment in this study, the need for daily feed
consumption is only about 200.2 grams. This is
because the need for feed consumption at each
feeding time depends on the weather around the pond,
because previously cultivators gave the same amount
of feed every time they were fed. With this tool, it can
save up to 37.44% of feed usage per day, this can have
a good impact on the expenditure of fish farming
costs from the cost of fish feed itself. The comparison
and efficiency table can be seen in table 6.
Table 6: Feed consumption efficiency.
Time
Modus
(second)
After
(gram)
Before
(gram)
first time
4
52,3
80
second time
6
73,6
80
third time
4
52,3
80
fourth time
2
22
80
Amount of Feed
Consumption
200,2
320
Feed Efficiency
Save 37,44 %
4 CONCLUSIONS
This research has been carried out to create an
automatic feed system application that is integrated
with the Internet of Things in the aquaculture
environment in the case of koi fishponds. The
experimental results show that the sensors connected
to the microcontroller retrieve data and the
microcontroller integrated with the ESP8266 can
connect to a wireless internet network to send sensor
data using Wi-Fi communication to the cloud server,
where sensor data can be displayed in the android
Design of the Feeding System Automatic Koi Fish Based on Internet of Things Using the Fuzzy Logic Controller Method
929

application in real time. The data processing process
in the fuzzy method runs as expected in accordance
with the input temperature sensor and rain sensor
which are read correctly and in accordance with fuzzy
manual calculations. The android application is able
to display sensor data and send notifications to users
when the feed has been launched by the tool. The
automatic feed system as a whole has been running
according to the specified schedule and the dose
issued is according to the weather around the pond at
that time. For the next research, Communication
between NodeMCU and Android can use Socket IO
to be more secure in data communication.
REFERENCES
Ismail, R., Shafinah, K., Latif, K. (2020). A Proposed
Model of Fishpond Water Quality Measurement and
Monitoring System based on Internet of Things (IoT).
14th International UMT Annual Symposium. IOP Conf.
Series: Earth and Environmental Science.
Lee, C-H., Jang, J-H. (2019). System Design for Internet of
Things Assisted Urban Aquaponics Farming. IEEE 8th
Global Conference on Consumer Electronics (GCCE).
Ouyang, B. et al. (2021). Initial Development of the Hybrid
Aerial Underwater Robotic System (HAUCS): Internet
of Things (IoT) for Aquaculture Farms. IEEE Internet
of Things Journal, vol. 8, no. 18, pp. 14013-14027, doi:
10.1109/JIOT.2021.3068571.
Rasyid, M.U.H.A., Mubtadai, N.R., Sukaridhoto, S.,
Ardianto, R., Fahmi, N., Nugraha, A.Y.D., Faisal, M.
(2021). Water Quality Monitoring System in
Aquaculture Environment based on Internet of Things.
Smart Cities Symposium. IET.
Sousa, D., Hernandez, D., Oliveira, F., Luis, M., &
Sargento, S. (2019). A Platform of Unmanned Surface
Vehicle Swarms for Real Time Monitoring in
Aquaculture Environments. Sensors, 19(21), 4695.
Sun, P., Chen, Y. (2019). Aquiculture Remote Monitoring
System Based on Internet of Things. International
Conference on Robots & Intelligent System (ICRIS).
Uddin, M.S., Istiaq, Md.F., Rasadin, M., Talukder, Md.R.
(2020). Freshwater shrimp farm monitoring system for
Bangladesh based on internet of things. Engineering
Reports. https://doi.org/10.1002/eng2.12184
iCAST-ES 2022 - International Conference on Applied Science and Technology on Engineering Science
930
